Will the Huge Corporate Spending on AI Pay Off?

Last Tuesday I posted on the topic, “Tech Stocks Sag as Analysists Question How Much Money Firms Will Actually Make from AI”. Here I try to dig a little deeper into the question of whether there will be a reasonable return on the billions of dollars that tech firms are investing into this area.

Cloud providers like Microsoft, Amazon, and Google are building buying expensive GPU chips (mainly from Nvidia) and installing them in power-hungry data centers. This hardware is being cranked to train large language models on a world’s-worth of existing information. Will it pay off?

Obviously, we can dream up all sorts of applications for these large language models (LLMs), but the question is much potential downstream customers are willing to pay for these capabilities. I don’t have the capability for an expert appraisal, so I will just post some excerpts here.

Up until two months ago, it seemed there was little concern about the returns on this investment.  The only worry seemed to be not investing enough. This attitude was exemplified by Sundar Pichai of Alphabet (Google). During the Q2 earnings call, he was asked what the return on Gen AI investment capex would be. Instead of answering the question directly, he said:

I think the one way I think about it is when we go through a curve like this, the risk of under-investing is dramatically greater than the risk of over-investing for us here, even in scenarios where if it turns out that we are over investing. [my emphasis]

Part of the dynamic here is FOMO among the tech titans, as they compete for the internet search business:

The entire Gen AI capex boom started when Microsoft invested in OpenAI in late 2022 to directly challenge Google Search.

Naturally, Alphabet was forced to develop its own Gen AI LLM product to defend its core business – Search. Meta joined in the Gen AI capex race, together with Amazon, in fear of not being left out – which led to a massive Gen AI capex boom.

Nvidia has reportedly estimated that for every dollar spent on their GPU chips, “the big cloud service providers could generate $5 in GPU instant hosting over a span of four years. And API providers could generate seven bucks over that same timeframe.” Sounds like a great cornucopia for the big tech companies who are pouring tens of billions of dollars into this. What could possibly go wrong?

In late June, Goldman Sachs published a report titled, GEN AI: TOO MUCH SPEND,TOO LITTLE BENEFIT?.  This report included contributions from bulls and from bears. The leading Goldman skeptic is Jim Covello. He argues,

To earn an adequate return on the ~$1tn estimated cost of developing and running AI technology, it must be able to solve complex problems, which, he says, it isn’t built to do. He points out that truly life-changing inventions like the internet enabled low-cost solutions to disrupt high-cost solutions even in its infancy, unlike costly AI tech today. And he’s skeptical that AI’s costs will ever decline enough to make automating a large share of tasks affordable given the high starting point as well as the complexity of building critical inputs—like GPU chips—which may prevent competition. He’s also doubtful that AI will boost the valuation of companies that use the tech, as any efficiency gains would likely be competed away, and the path to actually boosting revenues is unclear.

MIT’s Daron Acemoglu is likewise skeptical:  He estimates that only a quarter of AI-exposed tasks will be cost-effective to automate within the next 10 years, implying that AI will impact less than 5% of all tasks. And he doesn’t take much comfort from history that shows technologies improving and becoming less costly over time, arguing that AI model advances likely won’t occur nearly as quickly—or be nearly as impressive—as many believe. He also questions whether AI adoption will create new tasks and products, saying these impacts are “not a law of nature.” So, he forecasts AI will increase US productivity by only 0.5% and GDP growth by only 0.9% cumulatively over the next decade.

Goldman economist Joseph Briggs is more optimistic:  He estimates that gen AI will ultimately automate 25% of all work tasks and raise US productivity by 9% and GDP growth by 6.1% cumulatively over the next decade. While Briggs acknowledges that automating many AI-exposed tasks isn’t cost-effective today, he argues that the large potential for cost savings and likelihood that costs will decline over the long run—as is often, if not always, the case with new technologies—should eventually lead to more AI automation. And, unlike Acemoglu, Briggs incorporates both the potential for labor reallocation and new task creation into his productivity estimates, consistent with the strong and long historical record of technological innovation driving new opportunities.

The Goldman report also cautioned that the U.S. and European power grids may not be prepared for the major extra power needed to run the new data centers.

Perhaps the earliest major cautionary voice was that of Sequoia’s David Cahn. Sequoia is a major venture capital firm. In September, 2023 Cahn offered a simple calculation estimating that for each dollar spent on (Nvidia) GPUs, and another dollar (mainly electricity) would need be spent by the cloud vendor in running the data center. To make this economical, the cloud vendor would need to pull in a total of about $4.00 in revenue. If vendors are installing roughly $50 billion in GPUs this year, then they need to pull in some $200 billion in revenues. But the projected AI revenues from Microsoft, Amazon, Google, etc., etc. were less than half that amount, leaving (as of Sept 2023) a $125 billion dollar shortfall.

As he put it, “During historical technology cycles, overbuilding of infrastructure has often incinerated capital, while at the same time unleashing future innovation by bringing down the marginal cost of new product development. We expect this pattern will repeat itself in AI.” This can be good for some of the end users, but not so good for the big tech firms rushing to spend here.

In his June, 2024 update, Cahn notes that now Nvidia yearly sales look to be more like $150 billion, which in turn requires the cloud vendors to pull in some  $600 billion in added revenues to make this spending worthwhile. Thus, the $125 billion shortfall is now more like a $500 billion (half a trillion!) shortfall. He notes further that the rapid improvement in chip power means that the value of those expensive chips being installed in 2024 will be a lot lower in 2025.

And here is a random cynical comment on a Seeking Alpha article: It was the perfect combination of years of Hollywood science fiction setting the table with regard to artificial intelligence and investors looking for something to replace the bitcoin and metaverse hype. So when ChatGPT put out answers that sounded human, people let their imaginations run wild. The fact that it consumes an incredible amount of processing power, that there is no actual artificial intelligence there, it cannot distinguish between truth and misinformation, and also no ROI other than the initial insane burst of chip sales – well, here we are and R2-D2 and C3PO are not reporting to work as promised.

All this makes a case that the huge spends by Microsoft, Amazon, Google, and the like may not pay off as hoped. Their share prices have steadily levitated since January 2023 due to the AI hype, and indeed have been almost entirely responsible for the rise in the overall S&P 500 index, but their prices have all cratered in the past month. Whether or not these tech titans make money here, it seems likely that Nvidia (selling picks and shovels to the gold miners) will continue to mint money. Also, some of the final end users of Gen AI will surely find lucrative applications. I wish I knew how to pick the winners from the losers here.

For instance, the software service company ServiceNow is finding value in Gen AI. According to Morgan Stanley analyst Keith Weiss, “Gen AI momentum is real and continues to build. Management noted that net-new ACV for the Pro Plus edition (the SKU that incorporates ServiceNow’s Gen AI capabilities) doubled [quarter-over-quarter] with Pro Plus delivering 11 deals over $1M including two deals over $5M. Furthermore, Pro Plus realized a 30% price uplift and average deal sizes are up over 3x versus comparable deals during the Pro adoption cycle.”

How to (Almost) Double Your Investing Returns 3. “Stacked” Multi-Asset Funds

Two weeks ago we described a simple way to achieve roughly double investing returns on some asset class like an S&P 500 stock basket, or on some commodity like gold or oil, by buying shares in an exchange-traded fund (ETF) whose price moves up or down each day two times as much as the price of the underlying stocks or commodities. For instance, if the S&P 500 stocks go up (or down) by 2% on a given day, the price of the SSO ETF will move up (or down) by 4%.  And last week we noted that buying deep in the money call options can also result in an investment which can move up or down by twice the percentage of the underlying stock. These call options side-step the volatility drag implicit in the 2X funds, but require some housekeeping on the investors part to roll them over once or twice a year.

Today we present a third approach for multiplying the return on your investment dollars. This is to buy shares of a fund which holds two different asset classes, in a leveraged form. As an example: if you buy $100 worth of the fund PSLDX, you are buying the equivalent of $100 worth of S&P 500 stocks PLUS about $100 worth of long-dated US Treasury bonds. (PSLDX happens to be an old-fashioned mutual fund, not an ETF, but no matter). It works like this: The fund takes your $100 and buys a bucket of bonds. It then uses those bonds as collateral, and uses futures to get around $100 worth of exposure to the price movements of the S&P 500 stocks. There is not quite a free lunch here, since there is a “carry” cost on the futures, which is about equal to the LIBOR/SOFR short term interest rates (currently ~ 5%).

PSLDX does not promise exactly 100/100  stock/bond exposure, but it comes out pretty close much of the time. A similar product is NTSX which is leveraged x1.5. It gives 90/60 stocks/mixed-term bonds. NTSX has outperformed PLSDX in recent years, since the price of long-term (10-20 year) bonds has been crushed due to the rise in interest rates. RSSB is a recent entry into this space, offering 100/100 exposure to global stocks/laddered Treasuries.

Another reason these leveraged stock/bond products have done relatively poorly in the past two years is that the cost of leverage is actually higher than the bond coupons, due to the inverted yield curve.  This problem will go away if the Fed lowers short-term rates back down to near zero, as they were prior to 2022, but lingering inflation makes that prospect unlikely.

That said, if I have $200 to invest and want $100 stock and $100 bond coverage, I can put $100 into one of these 100/100 funds, and still have $100 left to collect interest on or to invest in some other, hopefully higher-yielding venue. So, these stock/bond funds have their place.

Where this so-called asset stacking shines even more is combining stocks or bonds with something like managed futures. Managed futures are an excellent diversifier for equities (see here). Moreover, since managed futures are typically held in both long and short positions, there will be less financing (carry) cost associated with them. When both stocks and bonds cratered in 2022, managed futures went up. Thus, funds like BLNDX (50 global stocks/100 managed futures) and MAFIX (stocks plus managed futures) went up in 2022, and then continued to rise as stocks recovered. Thus, the returns for these two funds have been steadier and higher than plain stocks (SP 500) over the past three years:

Total returns for past three years, for BLNDX (50 stocks/100 managed futures), SP500 stocks, BND broad US bonds, and MAFIX stacked multi-asset.

BLNDX and its sister fund REMIX are readily available at most brokerages (I hold some), while MAFIX may have daunting minimum investment requirements. RSST is a recent 100/100 stock/managed futures ETF that is easily invested in, and seems to be performing well.

Disclaimer: As usual, nothing here should be considered advice to buy or sell any investment.

One Up on Wall Street in the Meme Stock Era

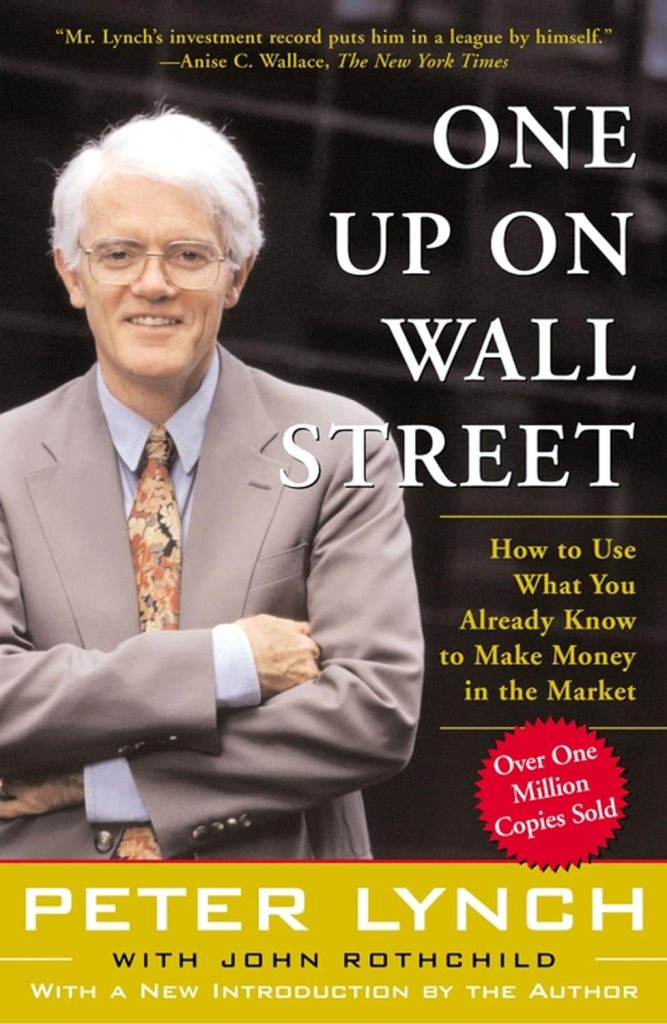
Peter Lynch was one of the most successful investors of the 1970’s and 1980’s as the head of the Fidelity Magellan Fund. In 1989 he explained how he did it and why he thought retail investors could succeed with the same strategies in the bestselling book “One Up on Wall Street”. Given the meme stock exuberance of retail investors in the past few years, I thought the book might be due for a comeback.

Instead interest seems flat, and when I do hear Peter Lynch mentioned it is by institutional investors more than retail. But the book seems to me like it is still valuable, so I’ll share some highlights here. This one could easily have been written this year:

Where did the Dow close? I’m more interested in how many stocks went up versus how many went down. These so-called advance/decline numbers paint a more realistic picture. Never has this been truer than in the recent exclusive market, where a few stocks advance while the majority languish. Investors who buy “undervalued” small stocks or midsize stocks have been punished for their prudence. People are wondering: How can the S&P 500 be up 20 percent and my stocks are down? The answer is that a few big stocks in the S&P 500 are propping up the averages.

I see why the book hasn’t caught on with meme stock traders:

Nobody believes in long-term investing more passionately than I do… I think of day-trading as at-home casino care.

I’ve never bought a future nor an option in my entire investing career, and I can’t imagine buying one now. It’s hard enough to make money in regular stocks without getting distracted by these side bets, which I’m told are nearly impossible to win unless you’re a professional trader.

So where does he think retail investors have a chance to get “One Up on Wall Street”?

Continue reading →

How to (Almost) Double Your Investing Returns 2. Buy Deep in the Money Calls

Last week we described a simple way to achieve roughly double investing returns on some asset class like an S&P 500 stock basket, or a narrow class of stocks such as semiconductors, or on some commodity like gold or oil. That way is to buy one of the many exchange-traded funds (ETFs) which use sophisticated derivatives to achieve a 2X or even 3X daily movement in their share prices, relative to the underlying asset. For instance, if the S&P 500 stocks move up by 2% on a given day, the SSO ETF will rise by 4%.

Of course, these leveraged funds will also go down two or three times as much. They also have a more subtle disadvantage, which is that when the markets go up and down a lot, they tend to lose value due to their daily reset mechanism.

In this post we describe a different way to achieve roughly double returns, which does not suffer from this volatility drag issue. This way is to buy long-dated deep in-the-money call options on a stock or a fund.

Say what? We have described how stock options work here and here. The reader who is unfamiliar with options should consult those prior articles.

A stock option is a contract to buy (if it is a call option) or to sell (if it is a put option) a given stock at some particular price (“strike price”), by some particular expiration date. Investors generally buy calls when they believe that the price of some stock or fund will go up.  For a call option with a strike price far below the current market price of a stock, the market price of the option will move up and down essentially 1:1 with the market price of the stock.

For instance, as I write this the market price of Apple is about $230. Suppose I think Apple is going to go up by say $40 in the next six months. One way for me to capture this gain is to invest $230 in buying Apple stock. The alternative propose here is to instead of buying the stock itself, buy, say, a call option with a strike price of $115 and an expiration date of January 17, 2025. The current market price of this option is about $119.

Other things being equal, we expect that the market value of this call option will go up by $40 if Apple itself goes up by $40. But we have invested only $119, rather than $230, so our return on our investment is roughly double with the option than by buying the stock itself.

There is a subtle cost to this approach. At a stock price of $230 and a strike price of $115, the intrinsic value of this call option is $115. But we pay an extra $3 of extrinsic value when we buy the option for $118. This extrinsic value will gradually decay to zero over the next six months.

Thus, if Apple went up by $40 within the next month or so, we could turn around and sell this call option for nearly $40 more than our purchase price. But if we wait for six months before selling it, we would only net $37 (i.e., $40 minus $3). This is still fine, but it illustrates that there is a steady cost of holding such options. This annualized cost is about equal to or slightly higher than the prevailing short term interest rate (5% /year). This option pricing makes sense, since an alternative way to control this many shares would be to borrow money at current interest rates (5%) and use those borrowed funds to buy Apple shares. Options and futures pricing is generally rational, to make things like this equivalent, or else there would be easy arbitrage profits available.

As a side comment, the reason I am focusing on deep in the money calls here is that the extrinsic premium you pay in buying the call gets lower the further away the strike price is (i.e. deeper in the money) from the current stock price. A deeper in the money call does cost you more up front, but net net its dollar movements up and down more closely track (1:1) the movements of the underlying stock. So, if I am not trying to guess right on any market timing, but simply want to get the equivalent of holding the underlying stock but tying up less money to do so, I find buying a call that is about 50% in the money generally works well.

How I Use Deep in the Money Call Options

I consider the technology-oriented stock fund QQQ to be a core holding in my portfolio, so I would like to stay exposed to its movements. But I might as well do this on a 2X basis, to make better use of my funds. I do hold some of the 2X ETF QLD. But if we experience a lot of market volatility, the price of QLD will suffer, as explained in our previous post.

As a more conservative approach here, I recently bought a deep in the money call on the QQQ ETF. As usual, I went for a call option with a strike price roughly half of the market price, with an expiration date 6-12 months away. When this gets close to expiration (May-June next year), I will “roll” it forward, by selling my existing call option, and buying a new one dated yet another 6-12 months further out. This takes little work and little decision making. I will pay the equivalent of about 5% annualized cost on the decay of the extrinsic option premium, but I come ahead as long as QQQ goes up more than 5% per year.

This is a little more work than just holding the 2X QLD ETF, but it gives me a bit more peace of mind, knowing I have done what I can to smooth out some of the risk there. Of course, if QQQ plunges along with the markets in general, I will be looking at double the losses. For that reason, I am taking some of the money I am saving by using these leveraged approaches, and stashing it in safe money market funds. In theory that should give me “dry powder” for buying more stocks after they drop. In practice, I may be too frozen with fear to make such clever purchases. But at any rate, I should not be appreciably worse off for having used these leveraged investments (2X funds or deep in the money calls).

Disclaimer: As usual, nothing here should be considered advice to buy or sell any investment.

From Cubicles to Code – Evolving Investment Priorities from 1990 to 2022

I’ve written before about how we can afford about 50% more consumption now that we could in 1990. But it’s not all bread and circuses. We can also afford more capital. In fact, adding to our capital stock helps us produce the abundant consumption that we enjoy today. In order to explore this idea I’m using the BEA Saving and Investment accounts. The population data is from FRED.

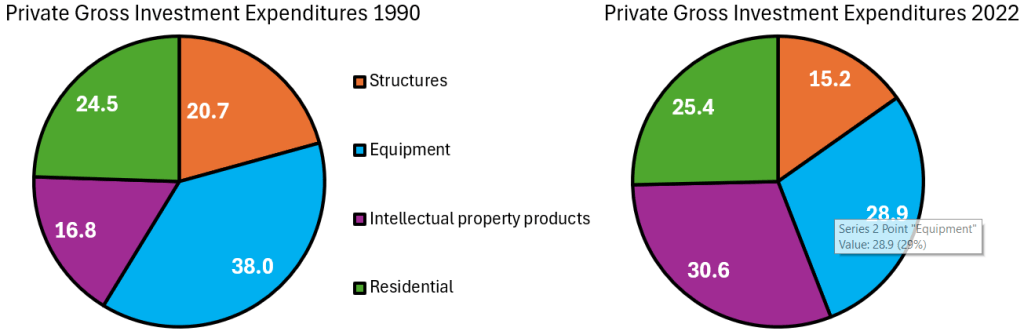
The tricky thing about investment spending is that we need to differentiate between gross investment and net investment. Gross investment includes spending on the maintenance of current capital. Net investment is the change in the capital stock after depreciation – it’s investment in additional capital not just new capital.  Below are two pie charts that illustrate how the composition of our *gross investment* spending has changed over the past 30 years. Residential investment costs us about the same proportion of our investment budget as it did historically. A smaller proportion of our investment budget is going toward commercial structures and equipment (I’ve omitted the change in inventories). The big mover is the proportion of our investment that goes toward intellectual property, which has almost doubled.

It’s easiest for us to think about the quantities of investment that we can afford in 2022 as a proportion of 1990. Below are the inflation-adjusted quantities of investment per capita. On a per-person basis, we invest more in all capital types in 2022 than we did in 1990. Intellectual property investment has risen more than 600% over the past 30 years. The investment that produces the most value has moved toward digital products, including software. We also invest 250% more in equipment per person than we did in 1990. The average worker has far more productive tools at their disposal – both physical and digital. Overall real private investment is 3.5 times higher than it was 30 years ago.

Continue reading →

How to Roughly Double Your Investing Returns 1. 2X (or 3X) Leveraged Funds

Most years, stocks go up, by something like 9%. Wouldn’t it be nice to invest in a fund that went up double those amounts? Such funds exist. They use futures or other derivatives to move up (or down!) by double, or even triple, the percentage that the underlying stock or index moves, on a daily basis.

For instance, a common unleveraged fund (ETF) is SPY that roughly tracks the S&P 500 index of large U.S. stocks is SPY. SSO is a 2X fund, which gives double the returns of SPY, on a daily basis. UPRO is a 3X fund, giving triple the returns. 2X funds exist for many different asset classes, including semiconductor stocks, treasury bill, and crude oil – see here. And similarly for 3X funds.

Since all the action in stocks these days seems to be in large tech companies, I will focus on the NASDAQ 100 index universe. The leading unleveraged fund there is QQQ. The 2X version is QLD, and the 3X is TQQQ. Let’s look at how these three funds performed over the past twelve months:

QQQ is up a respectable 36%, but QLD is up by 70%, and TQQQ by a mouth-watering 106%. You could have doubled your money in the past twelve months simply by investing in a 3X fund instead of holding boring 1X QQQ. 

These leveraged funds can be utilized in more than one way. One approach is to just put the monies you have allocated for stocks into such funds, and hope for higher returns. Another approach is to put, say half of your speculative funds into a 2X fund (to get roughly the same stock exposure as putting all of it into a 1X fund), and then use the remaining half to put into other investments, or to keep as dry powder to give you the option to buy more equities if the market crashes.

What’s not to like about these funds? It turns out that a year of daily doubling of returns does not necessarily add up to doubling of yearly returns. There is “volatility drag” associated with all the exaggerated moves up and down. As an illustration of how this works, suppose you held a stock that went down by 50% one day, say from a price of $100 to $50. The next day, it went back up by 50%. But this would only get you back to $75, not $100.

It turns out that with these leveraged funds, as long as stocks are generally going up, the yearly returns can match or even exceed the 2X or 3X targets. But in a period with a lot of volatility, the yearly returns can fall far short. And in a down year, the combination of the leverage and the volatility drag lead to truly horrific losses. For instance, here is what 2022 looked like for these funds:

QQQ was down by 31%, which is bad enough. But imagine your $10,000 in TQQQ melting down to $3,300 that year.

And here is the chart from January 2022 to the present:

QQQ is up 27% in the past 2.5 years, 2X QLD is up only 16%, while 3X TQQQ is actually down by 6%, as it could not recovery from 2022.

This was a kind of a worst-case scenario, since 2022 was an exceptionally bad year for QQQ, coming off a fabulous 2021. A chart of the past five years, which includes the 2020 Covid crash and recovery, and the 2022 crash and subsequent recovery still shows the leveraged funds coming out ahead over the long term:

The net returns on QLD (321%) were about double QQQ (158%), while the more volatile TQQQ return (386%) was plenty high, but fell well short of three times QQQ.

In my personal investing, I hold some QLD as a means to free up funds for other investments I like. But if I smell major market trouble coming, I plan to swap back into plain QQQ until the storm clouds pass.

There are some other ways to get roughly double returns, which suffer less from volatility drag than these 2X funds. I will address those in subsequent posts.

Disclaimer: As usual, nothing here should be considered advice to buy or sell any investment.

Coming In to Land

And I twisted it wrong just to make it right
Had to leave myself behind
And I’ve been flying high all night
So come pick me up, I’ve landed

-Fed Chair Ben Folds on the Covid inflation

The Fed has now almost landed the plane, bringing us down from 9% inflation during the Covid era to something approaching their 2% target today. But it is not yet clear how hard the landing will be. Back in March I thought recurrent inflation was still the big risk; now I see the risk of inflation and recession as balanced. This is because inflation risks are slightly down, while recession risk is up.

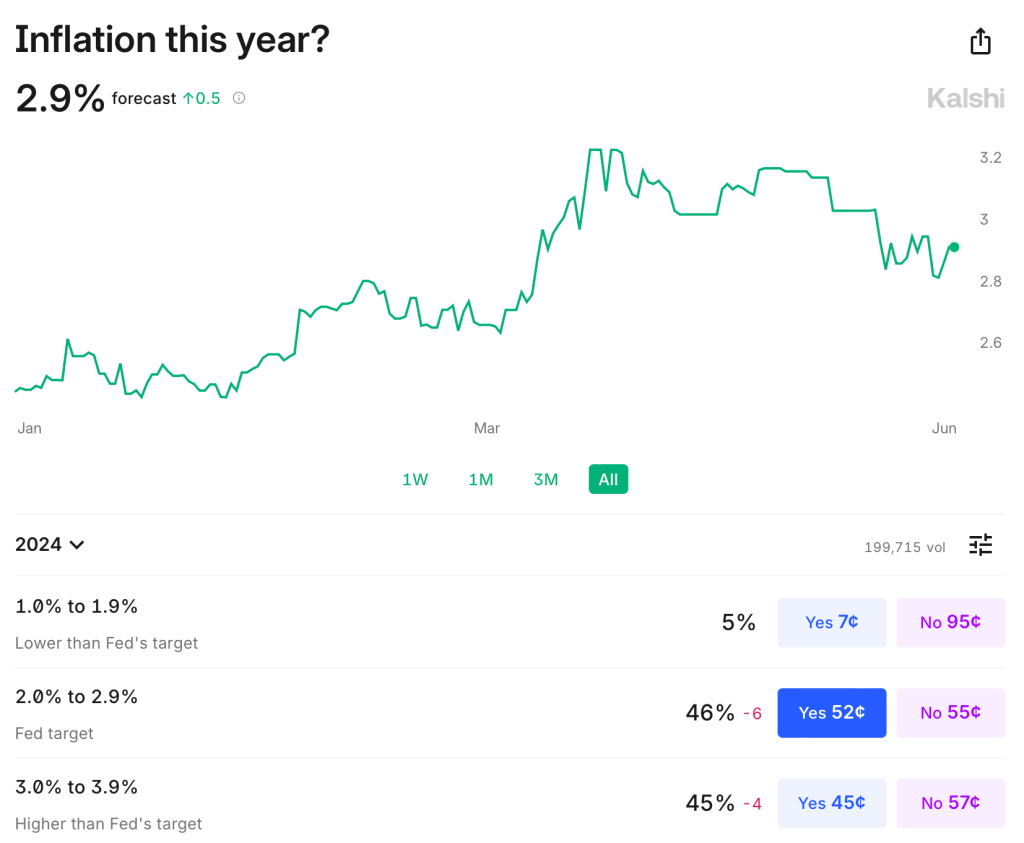
Inflation remains somewhat above target: over the last year it was 3.3% using CPI, 2.7% by PCE, and 2.8% by core PCE. It is predicted to stay slightly above target: Kalshi estimates CPI will finish the year up 2.9%; the TIPS spread implies 2.2% average inflation over the next 5 years; the Fed’s own projections say that PCE will finish the year up 2.6%, not falling to 2.0% until 2026. The labels on Kalshi imply that markets are starting to think the Fed’s real target isn’t 2.0%, but instead 2.0-2.9%:

The Fed’s own projections suggest this to be the somewhat the case- they plan to start cutting over a year before they expect inflation to hit 2.0%, though they still expect a long run rate of 2.0%. In short, I think there is a strong “risk” that inflation stays a bit elevated the next year or two, but the risk that it goes back over 4% is low and falling. M2 is basically flat over the last year, though still above the pre-Covid trend. PPI is also flat. The further we get from the big price hikes of ’21-’22 with no more signs of acceleration, the better.

But I would no longer say the labor market is “quite tight”. Payrolls remain strong but unemployment is up to 4.0%. This is still low in absolute terms, but it’s the highest since January 2022, and the increase is close to triggering the Sahm rule (which would predict a recession). Prime-age EPOP remains strong though. The yield curve remains inverted, which is supposed to predict recessions, but it has been inverted for so long now without one that the rule may no longer hold.

Looking through this data I think the Fed is close to on target, though if I had to pick I’d say the bigger risk is still that things are too hot/inflationary given the state of fiscal policy. But things are getting close enough to balanced that it will be easy for anyone to find data to argue for the side that they prefer based on their temperament or politics.

To me the big wild card is the stock market. The S&P500 is up 25% over the past year, driven by the AI boom, and to some extent it pulls the economy along with it. The Conference Board’s leading economic indicators are negative but improving overall this year; recently their financial indicators are flat while non-financial indicators are worsening.

Overall things remind me a lot of the late ’90s: the real economy running a bit hot with inflation around 3% and unemployment around 4%; the Fed Funds rate around 5%; and a booming stock market driven by new computing technologies. Naturally I wonder if things will end the same way: irrational exuberance in the stock market giving way to a tech-driven stock market crash, which in turn pushes the real economy into a mild recession.

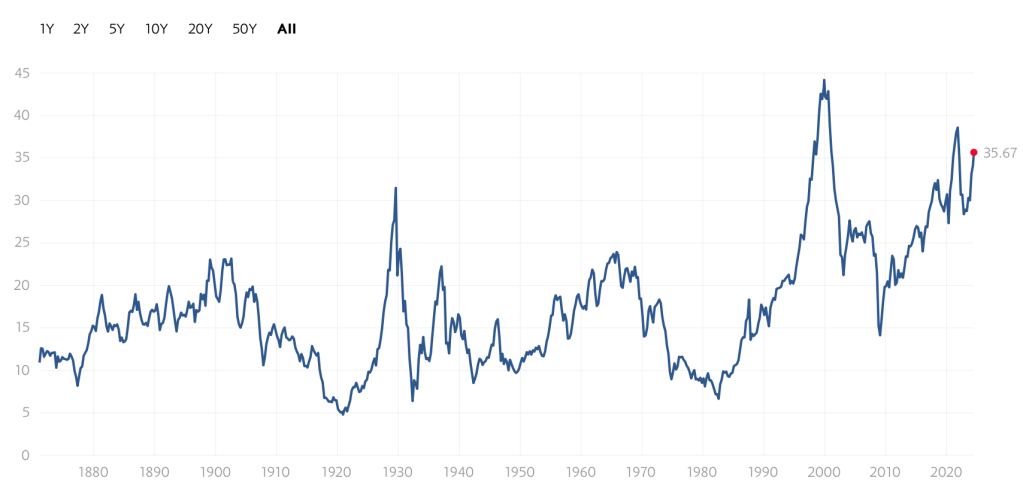
Of course there is no reason this AI boom has to end the same way as the late-90’s internet boom/bubble. There are certainly differences: the Federal government is running a big deficit instead of a surplus; there are barely a tenth as many companies doing IPOs; many unprofitable tech stocks already got shaken out in 2022, while the big AI stocks are soaring on real profits today, not just expectations. Still, to the extent that there are any rules in predicting stock crashes, the signs are worrying. Today’s Shiller CAPE is below only the internet and Covid meme-stock bubble peaks:

Again, this doesn’t mean that stocks have to crash, or especially that they have to do it soon; the CAPE reached current levels in early 1998, but then stocks kept booming for almost two years. I’m not short the market. But the macro risk it poses is real.

Boardroom Backstabbing: The Rise of “Lender-on-Lender Violence”

When I first started reading of “Lender-on-Lender Violence” this year, images of bankers in three-piece suits brawling in the streets of Lower Manhattan came to mind. It turns out that this is a staid legal term for a practice which has been around for some time, but is becoming more common and consequential.

Consider a case where say three lenders (e.g. banks or more likely venture capital funds) have lent money to some startup or struggling company XYZ. Let’s call these lenders A, B, and C. Now XYZ needs even more funding, perhaps because they need to build another factory, or perhaps because things are not working out as they hoped and they cannot pay off the original loans and still stay in business.

Now Lenders A and B get together and cook up a scheme. They will lend some more money to company XYZ to largely replace the original loan, but they contrive to get legal terms for that new loan that give it a higher priority for payment than the original loan. This is called “up-tiering” the new loan.  This has the effect of reducing the market value of the original loan.

Lender C is now hosed. It faces murky prospects for repayment on that original loan. Lenders A and B offer to buy them out of the original loan for 40 cents on the dollar. Lender C proceeds to sue Lenders A and B.

Will Lender C prevail? Probably not, if the course of recent cases is any guide. Unless there is very specific language in the legal “covenant” regarding the first loan forbidding this practice, it seems to be legal.

A similar maneuver would be for a new Lender D to offer a replacement loan to Company XYZ, with legal language giving it priority over the original loan. This is called “priming.”

Yet another tactic by the aggressive lenders includes working with Company XYZ to move its more valuable assets into a subsidiary or shell company, and to get the new loan to hold that as collateral. This again hoses the “victim” lenders, since again the assurance that they will be repaid has gone down.

My Personal Experience with Lender-on-Lender Violence

Some years ago, I bought the bonds of a company called SeaDrill. I bought the bonds instead of the common or preferred stock, for an additional margin of safety. Unlike the stock, the bonds must be repaid in full, right? Both the bonds and the preferreds were paying about 9%, back when general interest rates were much lower than that are now. So, I was a lender to the company.  

Silly me. Times got tough in the oil patch, and the company would have had difficulty paying off its bonds AND paying its management their high salaries. So, they went for Chapter 11 bankruptcy. I had not realized the difference between Chapter 7 bankruptcy, where the company shuts down and liquidates and pays off its creditors in pecking order, and Chapter 11, which is largely a chance for the company to put the losses on its creditors and to keep on operating.

As with the example above, some big institution offered to refinance things with new secured bonds that had priority ahead of the old bonds (which I held). In the end I got about 44 cents on the dollar for my bonds. I was not happy about that, but I did make out better than the hapless preferred stockholders, who got just a tiny crumb to make them go away. It was a learning experience. I did feel, well, violated.

Implications for the Burgeoning Private Credit Market

I will be writing more on the booming “private credit” market. Many of the loans in this space are “covenant-lite.” Back before say 2008, a large fraction of loans to business were through banks, who would insist on strong legal protection for their money. But in recent years, private equity funds have competed for this lending, allowing the borrowers to borrow on terms that give much less protection to the lenders. Cov-lite is now the norm.

Traditionally, loans (as distinct from bonds) to businesses have enjoyed decent recoveries (e.g., around 70%) in case of defaults, thanks to strong collateral backing the loans. But if we face any sort of prolonged recession and elevated defaults, the recoveries on all these loans will be far less than in the past. These are uncharted waters.

A Reference for “Lender-on-Lender Violence”

A solid description  of these matters is found in “ Uptier Transactions and Other Lender-on-Lender Violence: The Potential for More Litigation and Disputes on the Horizon “ at dailydac.com.

The Calming Psychology of Money

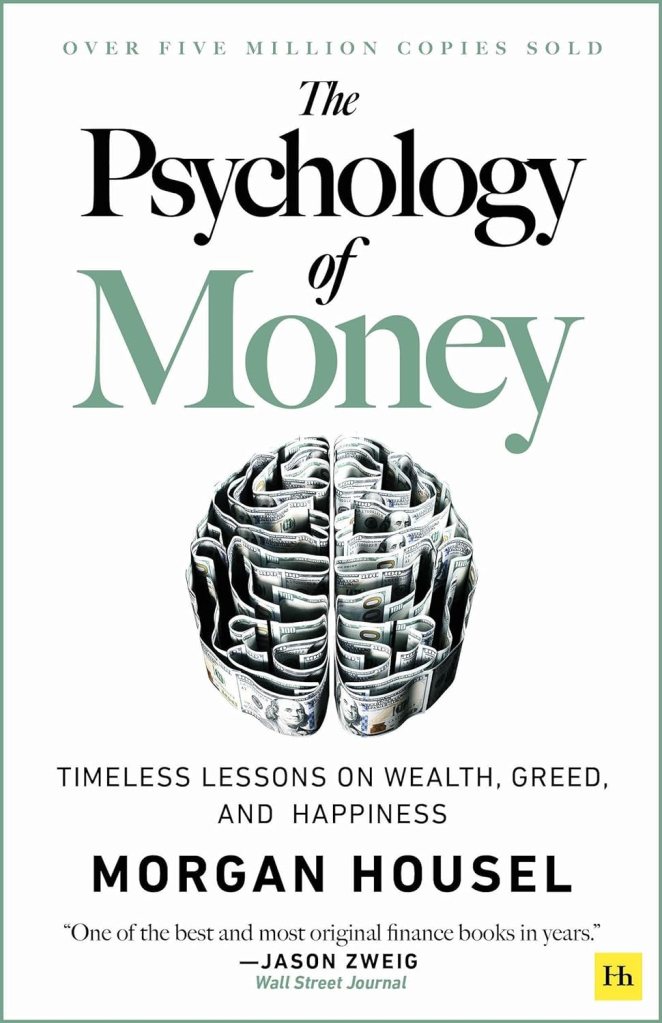
Morgan Housel’s Psychology of Money is not much like other personal finance books. Rather than making recommendations about exactly what to do and how to do it, Housel tells stories about how people’s different attitudes toward money serve them well or poorly. His stance is that most people already know what they should do, so he doesn’t need to explain that, but instead needs to explain why people so often don’t do what they know they should (e.g. save more). The book is not only pleasant to read, but at least for me exerts a calming effect I definitely do not normally associate with the finance genre, as if the subtext of “just be chill, be patient, follow the plan and everything will be alright” is continually seeping into my brain. Some highlights:

The idea of retirement is fairly new. Labor force participation for men over 65 is only about 20% today, but was well over 50% prior to the introduction of Social Security. Even once it started, Social Security paid in real terms about a quarter of what it does today. Plus pensions weren’t as common as people think; as of 1975 only a quarter of those over 65 had pensions, and most of those didn’t pay much. The 401k didn’t exist until 1978; the Roth IRA until 1998. “It should surprise no one that many of us are bad at saving and investing for retirement. We’re not crazy. We’re all just newbies.”

If you are disappointed whenever the price of your stocks goes down, you are in for a bad time, though you will do well if you can just ignore it:

“Netflix stock returned more than 35,000% from 2002 to 2018, but traded below its previous all-time high on 94% of days. Monster Beverage returned 319,000% from 1995 to 2018- among the highest returns in history- but traded below its previous high 95% of the time during that period…. this is the price of market returns.”

Housel isn’t very prescriptive because he recognizes how much people differ: “I can’t tell you what to do with your money, because I don’t know you. I don’t know what you want. I don’t know when you want it. I don’t know why you want it.”

At the end explains what he does with his own money: “Effectively all of our net worth is a house, a checking account, and some Vanguard index funds.” He convincingly argues that his way isn’t for everyone; he paid off his house early but “I don’t try to defend this decision to those pointing out its flaws, or to those who would never do the same. On paper it’s defenseless. But it works for us. We like it. That’s what matters.”

The closest he gets to specific recommendation is “for most investors, dollar-cost averaging into a low-cost index fund will provide the highest odds of long-term success.” There are lots of more general recommendations about good mindsets to take, for instance:

The few people who know the details of our finances ask, ‘What are you saving for? A house? A boat? A new car?’ No, none of those. I’m saving for a world where curveballs are more common than we expect.

Overall this is an easy book to recommend- it is both pleasant and easy to read, and gives good advice. My main complaint is that it is short on the nuts and bolts of how you actually do this stuff; for someone who doesn’t already know, it would pair well with a book that is stronger on that front, like I Will Teach You to Be Rich.

Future Consumption Has Never Been Cheaper

Economics as a discipline really likes to boil things down to their essentials. There are plenty of examples. How many goods can one consume? Just two, bread and not bread. How can you spend your time? You can labor or leisure. How do you spend your money? Consume or save. It’s this last one that I want to emphasize here.

First, all income ultimately ends up being spent on consumption. Saving today is just the decision to consume in the future. And if not by you, then by your heirs. One determinant of inter-temporal consumption decisions is the real rate of return. That is, how many apples can you eat in the future by forgoing an apple eaten today? The bigger that number is, the more attractive the decision to save.

Further, since most saving is not in the form of cash and is instead invested in productive assets, we can also characterize the intertemporal consumption problem as the current budget allocation decision to consume or invest. The more attractive capital becomes, the more one is willing to invest rather than consume. The relative attractiveness between consumption and investment informs the consumption decision.

How attractive is investment? I’ll illustrate in two graphs. First, if the price of investment goods falls relative to consumption goods, then individuals will invest more. The graph below charts the price ratio of investment goods to consumption goods. Relative to consumption, the price of investment has fallen since 1980. Saving for the future has never been cheaper!

Of course, as in a price taker story, I am assuming that individuals don’t affect this price ratio. Truly, prices are endogenous to consumption/investment decisions. For all we know, it may be that the prices of investment goods are falling because demand for investment goods has fallen. But that doesn’t appear to be the case.

Continue reading →