“Roaring Kitty” Returns to Social Media, and Reignites Stock Frenzy

Back in early 2021, when we were still locked down, bored and restless, and trillions of pandemic stimulus dollars were pouring into our bank accounts to fund speculative investments, Keith Gill took to social media to argue that the stock of videogame retailer GameStop (GME) was deeply undervalued. He appeared on YouTube as “Roaring Kitty,” and on Reddit under an unsavory moniker.  He rallied an army of retail investors on Reddit to buy up shares of GME, which was heavily shorted by big Wall Street firms. As hoped by the Redditors, this led to a “short squeeze,” where the shorts were forced to buy shares to cover, which drive GME price to the stratosphere.  We discussed this phase of the drama here.

The drama continued as the jubilant retailers sucked so much money from short-selling hedge fund Melvin Capital that it ultimately shut down; the Robin Hood brokerage firm widely used by Redditors suspended trading  in GME for a crucial couple of days, leading to suspicions it caved to pressures from the Wall Street firms and threw the retail investors under the bus; and key parties, including Roaring Kitty himself, were called before a Congressional committee to explain themselves. The story of Roaring Kitty and the meme stock craze was turned into a movie last year called “Dumb Money.”

Keith Gill largely vanished from messaging boards in early 2021. But he came roaring back on Sunday (May 11), posting on X a sketch of a man leaning forward in a chair, a meme among gamers that things are getting serious:

It seems that the Kitty has not lost his magic.  That X post has garnered over 20 million views, and apparently triggered a new surge in GME stock (and in other heavily shorted stocks as well, which is a significant knock-on effect). Here is a five-year chart of GME, showing the craziness in early 2021, which then died down over the next couple of years:

GME stock had finally approached something approximating fundamental fair value, with occasional ups and downs, then Roaring Kitty posted his sketch, and, blam, the next day, the stock nearly doubled:

Keith Gill has followed up with tweets of video clips with a fight theme, including Peaky Blinders, Gangs of New York, Snatch, Tombstone, X-Men Origins: Wolverine, V is for Vendetta and The Good the Bad and the Ugly ; get that testosterone out there roiling (typical meme stock Redditors are youngish males).

As of Tuesday morning, GME had nearly doubled again, up to $57. (I am reasonably sure it will plunge again within the next few months, but I am not into shorting, and the options pricing structure does not make it easy to set up a favorable bearish trade here).

This response is not like the world-shaking short squeeze of 2021, but it still shows an impressive power of social media influencers and memes to move markets.

My Frozen Assets at BlockFi, Part3: I Finally Recovered 27% of My Original Funds.

Well, it’s finally over. As noted in previous blog posts, back when interest rates were essentially zero, I started an account with cryptocurrency investing firm BlockFi. They paid me a hefty 9% per year for lending out my crypto coin to “trusted institutional counterparties”, backed by large collateral. However, when  Sam Bankman-Fried’s FTX exchange went belly up, it took BlockFi with it. (Bankman-Fried, the former rock-star white knight of the crypto world, is now in prison for fraud).  My funds at BlockFi disappeared into the black hole of bankruptcy proceedings for about a year and a half.

Last month, a judge finally allowed a settlement for clients to withdraw their assets from their interest-bearing accounts. There were two wrinkles. First, you get far less than 100% of your funds. Most of my money got chewed up in the corporate bankruptcy itself, and then was eaten by the law firm (Kroll) processing the bankruptcy and the client reimbursement process. So,  I’m only getting about 27% percent of my money back.

As an aside, Kroll got hacked about a year ago, leaking the names and email addresses of us BlockFi clients, and so some scammer sent out a very well-crafted email that a number of people, including me (briefly) were taken in by, as I wrote earlier.  if you responded to that scam email, you ended up connecting your wallet to a scam application, which could then suck everything out of your wallet. Fortunately, I had almost nothing in my wallet for the short time I had it connected, but other victims lost considerable sums. I guess the reason why criminals continue to run crypto scams is because they are profitable, like the legendary bank robber Willie Sutton who robbed banks because “that’s where the money is.”

The other wrinkle In the BlockFi reimbursement is that they will only reimburse you with the actual cryptocurrency coin that you held, not with its dollar value. So, I had to set up a cryptocurrency wallet (I used Trust wallet) to receive my crypto, which was all in the form of the stablecoin USDC.

I had to do considerable background work to make this happen. In order to test that that wallet worked to receive USDC, I had to also set up a cryptocurrency exchange account, which I did with Coinbase (which seemed to be the most solid crypto exchange). I had to connect that account with my bank, put some money into the Coinbase exchange, buy some USDC, and send it to my crypto wallet to make sure that it all worked.


As of a week ago, after some fairly intrusive ID verification, the reimbursement machinery did finally deposit the measly remnants of my USDC into my wallet. OK, I thought, I’ll just transfer that to my Coinbase exchange account, turn the USDC into cash and be done with it all.


But not so fast… Because USDC is transferred over the Ethereum network, I had to have enough ETH coin in my Trust wallet to pay for the transfer. The network transfer cost, called the gas fee, was about eight dollars at midday, going down to about three dollars by 10 o’clock at night.

So, I had to go into my Coinbase account, convert some USDC there into ETH (incurring a $1.49 fee for that), and then send some ETH to my Wallet, incurring yet another a transfer fee there. Then I could use that ETH in my wallet to pay for the transfer of the USDC to my Coinbase exchange. Then at long last I was able to convert my USDC to cash and transfer it to my bank account, to finally put this whole BlockFi drama to rest.

Looking on the bright side of all this uproar, I now have a functioning cryptocurrency exchange account and wallet, and am familiar with elementary crypto operations. This might prove handy if I ever want to dabble more in this area or if some other need arises. For now, however, I have had enough of crypto.

ADDENDUM: Finally got all my BlockFi funds back as of November, 2024. BlockFi was able to claw back its assets from FTX, and fully reimburse its customers. Yay! This post describes the process:

https://economistwritingeveryday.com/2024/11/26/my-frozen-assets-at-blockfi-part-4-full-recovery-of-my-funds/

Recovering My Frozen Assets at BlockFi, Part1. How Sam Bankman-Fried’s Fraud Cost Me.

Back in 2021, interest rates had been so low for so long that that seemed to be the new normal. Yields on stable assets like money market funds were around 0.3% (essentially zero, and well below inflation), as I recall. As a yield addict, I scratched around for a way to earn higher interest, while sticking with an asset where (unlike bonds) the dollar value would stay fairly stable.

It was an era of crypto flourishing, and so I latched onto the notion of decentralized finance (DeFi) lending. I found what seemed to be a reputable, honest company called BlockFi, where I could buy stablecoin (constant dollar value) crypto assets which would sit on their platform. They would lend them out into the crypto world, and pay me something like 9 % interest. That was really, really good money back then, compared to 0.3%.

On this blog, I chronicled some of my steps in this journal. First, in signing up for BlockFi, I had to allow the intermediary company Plaid complete access to my bank account. Seriously, I had to give them my username and password, so they could log in as me, and not only be able to withdraw all my funds, but see all my banking transactions and history. That felt really violating, so I ended up setting up a small auxiliary bank account for Plaid to use and snoop to their heart’s content.

I did get up and running with BlockFi, and put in some funds and enjoyed the income, as I happily proclaimed (12/14/2021) on this blog, “ Earning Steady 9% Interest in My New Crypto Account “.

BlockFi assured me that they only loaned my assets out to “Trusted institutional counterparties” with a generous margin of collateral. What could possibly go wrong?

What went wrong is that BlockFi as a company got into some close relationship with Sam Bankman-Fried’s company, FTX.  Back in 2021-2022, twenty-something billionaire Sam Bankman-Fried (“SBF”) was the whiz kid, the visionary genius, the white knight savior of the crypto universe. In several cases, when some crypto enterprise was tottering, he would step in and invest funds to stabilize things. This reminded some of the role that J. P. Morgan had played in staving off the financial panics of 1893 and 1907. SBF was feted and lauded and quoted endlessly.

For reasons I never understood, BlockFi as a company was having a hard time turning a profit, so I think the plan was for FTX to acquire them. That process was partway along, when the great expose’ of SBF as a self-serving fraudster occurred at the end of 2022. He effectively gambled with his customers’ money. This would have made him even richer if his bets had paid off, but they went sour, which brought everything crashing down.

FTX quickly declared bankruptcy, which forced BlockFi to go BK as well. SBF was eventually locked up, but so were the funds I had put into BlockFi. The amount was not enough to threaten my lifestyle, but it was enough to be quite annoying.

Sam’s parents are both law professors at Stanford who are now resisting returning to FTX’s creditors the  $32 million (!!!) in assets (cash and real estate) that SBF had given them out of FTX’s operations. Some of that $32 million they are hoarding is mine, since BlockFi needs to recover its claims against FTX in order to make BlockFi clients whole. Sam’s mother has denounced the legal judgment against her son as “as “McCarthyite” and a “relentless pursuit of total destruction,” which is enabled by “a credulous public.” One wonders what little Sammy imbibed in the way of practical ethics in that household of idealistic Stanford law professors – the “effective altruism” that the Bankman-Fried family touts is perhaps a gratifying concept, until it actually costs you something you don’t want to part with. But I digress.

BlockFi Assets Begin to Thaw

I got emails from BlockFi every few months, assuring customers that they would do what they could to return our assets. Their bankruptcy proceedings kept things locked, but now they are starting to return some money. A judge ruled in early 2023 that assets held by users in their BlockFi “wallet” belonged to the users and could be withdrawn. However, assets in the interest-bearing account (which is where my stablecoin was) technically still belong to the bankrupt company’s estate, and were not necessarily available for withdrawal. But now, following another legal agreement,  BlockFi is returning funds from the interest accounts. The problem is that you will only get some fraction of what you put in. Some YouTube commenters have complained they only got 10-25% of their assets, and no one seems to know if they will ever get more. Ouch.

I got an email from BlockFi saying that I have assets to claim, but I need to set up an actual independent crypto wallet to receive them. BlockFi will only transfer the actual coin, not the dollar values. So, I am in the middle of this process. It’s one thing to open a wallet, where you can transfer crypto coins in and out. It is another to exchange or monetize your coin; for that you seem to need an exchange.

I have chosen to go with Coinbase. It is not the cheapest alternative, but it seems to be the most solid U.S. based crypto exchange. I have opened a Coinbase account now. As with BlockFi, I had to go through Plaid (ugh) for the connection to my bank account.

Next thing I need to do is to open a Coinbase wallet, and try to connect with BlockFi, and see what I get back. I will post later on what happens there.

Update: I got scammed in this process, see here. My bad for clicking on a link in an email, instead of going to the official website for the link…

Borrowing, Beef, and Break-even

Interest rates communicate the value of resources over time. For example, if you take out a loan, then the interest rate tells you how much you must to pay in order to keep that money over the life of the loan. The interest rate also reflects how much the lender will be compensated in exchange for parting with their funds. On the consumer side, the interest rate reflects the price that the borrower is willing to pay in order to avoid delaying a purchase.

When a business borrows, the interest rate reflects the minimal amount of value that they would need to create in order to make an accounting profit. For example, if a business borrows $100 for one year at an interest rate of 5%, then they need to earn $105 by the time that they repay the loan in order to break even with zero profit. The business would need to earn more than 5% in order to earn a profit on their borrowing and investment venture.

The longer the business takes to repay their loan, the more interest that accrues. And, the higher the interest rate, the more they need to earn in order to repay their loan.

This logic applies to all production because all production takes time. If production takes very little time, then the impact of the interest cost is miniscule. But, if production takes longer, then interest rates become increasingly relevant. These kinds of products include trees, cheese, wine, livestock, etc. Anything that ages, ferments, or has a lengthy production process will be more sensitive to the cost of borrowing.

How?

The growth pattern for most (all?) goods looks similar. Below-left is a growth chart for dairy cows . Notice that calves grow quickly at first, and their growth slows over time. For the sake of argument, let’s say that the change in value of a cow mimics the change in weight (Yes, I know that dairy and beef cows are different, but the principle is the same).  Below-right is the monthly percent change. Even at an age of 25 months a cow is still growing in value at 2.4% per month or 33% per year.

Of course, there is a risk that some cows don’t survive to slaughter, lowering the expected growth rate. Since most cattle are slaughtered between 18 and 24 months of age, their growth rate at the time of slaughter is 4.4%-2.7% per month. As the interest rate at which farmers borrow rises, the optimal age at slaughter falls. Otherwise, the spread between the growth rate and the interest rate could go negative. Even so, what an investment! If you can borrow at, say, 8% per year, then you’ll make money hand-over-fist on the spread.

Except… Cows cost money to raise, and most of that cost is feed. According to the production indicators and estimated returns published by the USDA, the cost of feed in February of 2023 was $158.11 per hundred pounds of beef. The selling price of beef was $161.07. That leaves $2.96 or a profit of 1.87% earned over the course of 1.5-1.75 years. That investment is starting to look a lot less good, especially since it doesn’t include the cost of maintaining facilities, insurance, etc. It’s no wonder that farmers and ranchers are serious about their subsidies. Clearly, with such tight margins, farmers and ranchers are going to look good and hard at the interest rates that they pay on their debt. And, they do have debt.

However, the recent increase in beef prices is not caused by higher interest rates.

That 1.87% profit margin is at prices and costs from February 2023. Since 2020, the price of cattle feed ingredients (grain, bean, and oil) peaked in the summer of 2022 and are still substantially more expensive than pre-Covid (see below). That means that cows getting slaughtered right now were raised on more expensive feed. This February 2024, the cost of feed per 100lb. of cattle was $191.80. But the cattle selling price was only $180.75. That’s a $11.05 loss for cattle raising. Wholesale prices of cattle might be up recently, but the cost of feed is up by more. It’s not the cattle farmers who are benefiting from the high beef prices. In fact, they’re getting squeezed hard.

There is good news. The cost of feed ingredients has been falling recently, which means that beef farmers should begin to see some relief if the recent trend continues. For Consumers, the price of beef is already down from its 2023 peak.

Business Development Companies: My Favorite Class of High Yield Investments

It is easy to find securities which pay over 10% yield. It is not so easy to find securities which pay over 10% yield AND which maintain their share price over time. Many funds, especially closed-end funds, follow the “melting ice cube model” – they pay high current yields by slowly liquidating the fund assets, since the generous distributions are not matched by actual money-making by the fund’s investments. Oh, and the fund managers charge a nice fee for slowly giving you back your money. The result is that over longish time periods (e.g. five years) the stock price and the dividends decline.

I have been burned numerous times by such “high yield traps” in my longtime exploration of high yielding securities. A glorious exception has been business development companies (BDCs). These companies operate much like banks, lending out money and collecting interest on those loans. They lend to smaller, shakier enterprises that cannot get loans from banks. BDCs get to charge these (desperate?) clients very high interest rates, often around 6-7% over SOFR, which is the replacement for the old LIBOR benchmark, and which is very close to the current Fed funds rate. So back when regular short-term rates were near zero, BDCs were charging around 6%, and now (with Fed funds at 5.3%) they lend out money at around 11%. BDC’s leverage up by about 1:1 by issuing bonds, which boosts net income; this cash inflow is offset by really big management fees. The net result for us equity shareholders is that BDCs are paying out around 10-12% per year in dividends. That varies, of course, from one BDC to the next.

(If you just look at the usual “Forward Yield” value in your brokerage account or Yahoo Finance, it might only show like 9% or so. The reason is that BDCs, in good times like now, often pay out significant “special” dividends, which supplement the regular dividends; but only the regular dividends show up in the standard yield reporting).

One of the largest and oldest BDCs is Ares Capital Corporation, ARCC. If you just look at share price, ARCC does not look too inspiring. In the past five years, its price is up only about 9%, which is way less that the S&P 500 standard fund SPY. (But at least it is not down, like the generic bond fund AGG).

But when you look at total returns, which includes reinvested dividends, ARCC actually beats out SPY (85.7 % vs. 83.9% total returns), which is a noteworthy feat. Another large BDC, HTGC (green line in the plot below) did even better, with roughly 1.8 times the yield of SPY:

The current yield of ARCC 9.3%. This is on the low side for BDCs; ARCC is regarded as very secure, and so its price gets bid up. The yield of HTGC is 10.6%, while relative newcomer TRIN is paying 14%.

Lending to small, sometimes starting-up companies sounds risky, but the risk is mitigated by being at the tip top of the company’s capital stack. The loans are typically secured first-lien, which means in event of bankruptcy, they would get paid off before anything else. If the client company goes totally belly-up, the recovery on these loans is historically about 80%. In practice, a good BDC will often work with the client to come to some arrangement where the recovery is close to 100%. (For unsecured bonds, recoveries in bankruptcy are about 40%, while preferred stockholders get a few crumbs like shares in the reorganized post-bankruptcy enterprise, and common shareholders get zip). If you invest in a small cap stock fund like the Russell 2000, you are owning common stock in some of the companies that BDCs lend to. As such, you are actually in a much riskier position than owning shares in a BDC. Just saying.

Sound interesting? My short list of BDC favorites includes ARCC, HTGC, TRIN, TSLX, and BXSL. For one-stop shopping there are funds which hold a basket of BDCs. BIZD is the venerable big gorilla in this category. It blindly holds the largest BDCs by market cap. A newer, much smaller ETF is PBDC, which uses active, hopefully smart management. Since inception about 18 months ago, PBDC has beat out BIZD by about 12% in total returns, which more than compensates for its higher management fees (0.75% for PBDC versus 0.4% for BIZD).

Disclaimer: As usual, nothing here represents advice to buy or sell any security.

A Contrarian View from Apollo: No Rate Cuts in 2024

The mainstream view for the last 18 months has been that Fed rates cuts are always right around the corner. Markets are acting like the cutting cycle has already begun.

Apollo Global Management is a well-regarded alternative investment firm. (Disclosure: I own some APO stock). Their Chief Economist, Torsten Sløk, recently published his outlook, which differs sharply from the mainstream view. He notes that by various measures, the economy is heating up (or at least staying hot), and inflation has started to creep back up, not down. In his words:

The market came into 2023 expecting a recession.

The market went into 2024 expecting six Fed cuts.

The reality is that the US economy is simply not slowing down, and the Fed pivot has provided a strong tailwind to growth since December.

As a result, the Fed will not cut rates this year, and rates are going to stay higher for longer.

How do we come to this conclusion?

1) The economy is not slowing down, it is reaccelerating. Growth expectations for 2024 saw a big jump following the Fed pivot in December and the associated easing in financial conditions. Growth expectations for the US continue to be revised higher, see the first chart below.

2) Underlying measures of trend inflation are moving higher, see the second chart.

3) Supercore inflation, a measure of inflation preferred by Fed Chair Powell, is trending higher, see the third chart.

4) Following the Fed pivot in December, the labor market remains tight, jobless claims are very low, and wage inflation is sticky between 4% and 5%, see the fourth chart.

5) Surveys of small businesses show that more small businesses are planning to raise selling prices, see the fifth chart.

6) Manufacturing surveys show a higher trend in prices paid, another leading indicator of inflation, see the sixth chart.

7) ISM services prices paid is also trending higher, see the seventh chart.

8) Surveys of small businesses show that more small businesses are planning to raise worker compensation, see the eighth chart.

9) Asking rents are rising, and more cities are seeing rising rents, and home prices are rising, see the ninth, tenth, and eleventh charts.

10) Financial conditions continue to ease following the Fed pivot in December with record-high IG issuance, high HY issuance, IPO activity rising, M&A activity rising, and tight credit spreads and the stock market reaching new all-time highs. With financial conditions easing significantly, it is not surprising that we saw strong nonfarm payrolls and inflation in January, and we should expect the strength to continue, see the twelfth chart.

The bottom line is that the Fed will spend most of 2024 fighting inflation. As a result, yield levels in fixed income will stay high.

[END OF EXCERPT]

The big question, of course, is whether these recent signs of increased inflation are just blips of  noise, or the start of a new trend. Time will tell if Sløk’s contrarian view is correct, but I have to respect his intestinal fortitude in putting it right  out there, without any weaselly qualifications. He refers to many charts which are in his original article. I will reproduce four of these charts below:

The Best Personal Finance Books

Last week Scott offered a very negative review of one popular personal finance book, Rich Dad Poor Dad. My own take on the book is less negative, but I still wouldn’t recommend it to most people. That still leaves the question of which personal finance books are worthwhile. I gave my answer back in 2020 in a post on my personal blog. You can read the full reviews there, but I’ll give my short answers here:

I Will Teach You to Be Rich

Despite the title, the book is really about the basics of how to get out of debt, save for retirement, and manage credit. The material is stuff most people will figure out on their own by their 30’s or 40’s, but it’s a nice presentation all in one place and can save people from learning lessons the hard way. Perfect for a college student, someone at their first real job, or someone older who feels like they missed the memo on how all this works. His big idea is that once you set and meet good savings goals, you don’t need to feel guilty about the things you do spend money on.

The Millionaire Next Door

This book is built around surveying millionaires and finding the commonalities in what they did to get wealthy. The core idea is that Americans with millions saved tend to have moderately high incomes but very high savings rates. Even someone with a normal income can become a millionaire- income is different from wealth. The key is to live frugally and let the compound returns on your savings work for you. The original version of the book is inspiring, but has out of date numbers; the author’s daughter recently updated it (The Next Millionaire Next Door) with more current numbers.

There are many more books about how to invest, but for broad takes on personal finance overall these are the best two I have found, and the ones I recommend to students. Still interested to hear your thoughts on more recommendations.

Stock Options Tutorial 3. Selling Options to Generate Extra Income

In the first installment of this series on stock options, I focused on buying options, as a means to economically participate in the movement of a stock price up or down. If you guess correctly that say Apple stock will go up by 10% in the next two months, you can make much more money with less capital at risk by buying a call option than by buying Apple stock itself. Or if you guess correctly that Apple stock will go down by 10% in the next two months, you can make more money, with less risk, by buying a put option on Apple, then by selling the stock short.

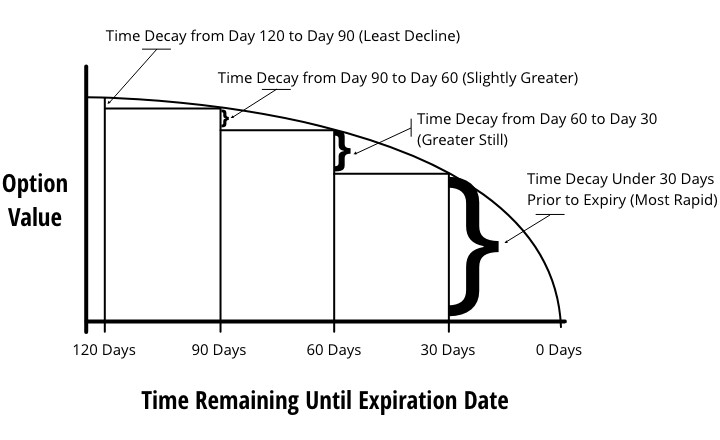
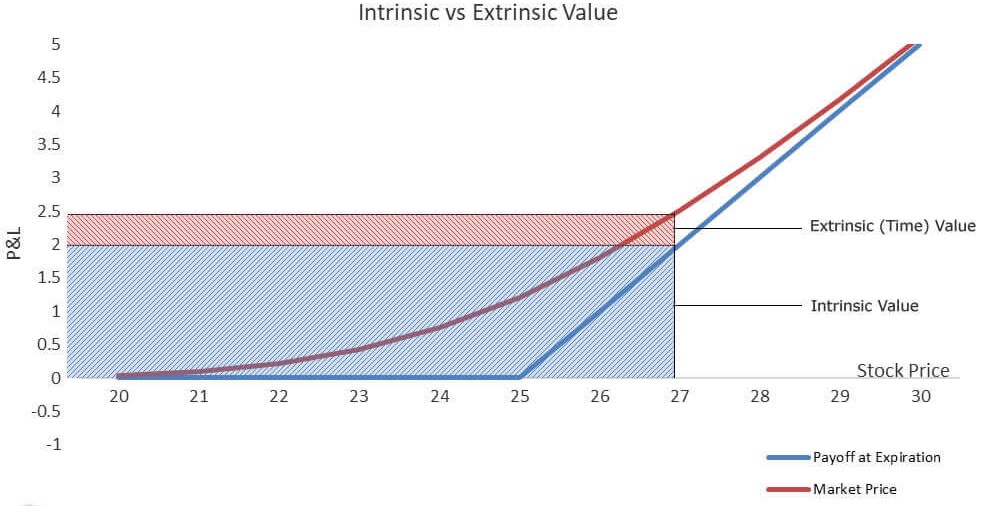
In part two of the series, I discussed how options are priced, noting the difference between intrinsic value, and the time-dependent extrinsic value.

Here in part three, I will discuss the merits of selling, rather than buying options. This is the way I usually employ them, and this is what I would suggest to others who want to dip their toes in this pond.

Just to revisit a point made in the first article, I see two distinct approaches to trading options. Professional option traders typically make hundreds of smallish trades a year, with the expectation that most of them will lose some money, but that some will make big money. A key to success here is limiting the size of the losses on your losing trades. It helps to have nerves of steel. Some people have the temperament to enjoy this process, but I do not.

Selling Out of the Money Calls

Instead if spending my days hunched over a screen managing lots of trades, I would rather set up a few trades which may run over the course of 6 to 12 months, where I am fairly OK with any possible outcome from the trades. A typical example is if I bought a stock at say $100 a share, and it has gone up to $110 a share, and I will be OK with getting $120 a share for it; in this case I might sell a six-month call option on it for five dollars, at a strike price of $115. The strike price here is $5 “out of the money”, i.e., $5 above the current market price.

There are basically two possible outcomes here. If the price of the stock goes above $115, the person who bought the call option will likely exercise it and force me to sell him or her the stock for a price of $115. Between that, and the five dollars I got for selling the option period, I will have my total take of $120.

On the other hand, if the stock price languishes below $115, I will get to keep the stock, plus the five dollars I got for selling the option. That is not a ton of money, but it is 4.3% of $115. If at the end of the first six-month period I turned around and sold another, similar six-month call option which had the same outcome, now I have squeezed an 8.6% income out of holding the stock. If the stock itself pays say a 4% dividend, now I am making 12.6% a year. Considering the broader stock market only goes up an average of around 10% a year, this is pretty good money.

At this point, you should be asking yourself, if making money selling options is so easy, I have I heard of this before? What’s the catch?

The big catch is that by selling this call, I have forfeited the chance to participate in any further upside of the stock price, beyond my $120 ($155 + $5). If at the end of six months, the stock has soared to $140 a share, but I must sell it for a net take of $120, I am relatively worse off by selling the call. I have still made some money ($20) versus my original purchase price. However, if I had simply held the stock without selling a call option, I would have been ahead by $40 instead of $20. And now if I want to stay in the game with this stock, I have to turn around and buy it back for $140. This decision can involve irksome soul-searching and regrets.

There are two techniques are used to reduce these potential regrets. One is to only sell calls on say half of my holdings of a particular stock. That way, if the stock rockets up, I have the consolation of making the full profit on half my shares.


The other technique is to try to identify stocks that trade in a range. For instance, the price of oil tends to load up and down between about seven day and $90 a barrel, barring some geopolitical upset. and the price of major oil companies, like Chevron or ExxonMobil, likewise trade up and down within a certain range. If you sell calls on these companies when they are near the top of their range, it is less likely that the share price will exceed the strike price of your option. Or, if it does, and you have to sell your shares, there is a good chance that if you just wait a few months, you will be able to buy them back cheaper. On the other hand, a stock like Microsoft tends to just go up and up and up, so it would not be a good target for selling calls.

Some Personal Examples

From memory, I will recount two cases from my own trading, with the two different outcomes noted above. ExxonMobil stock has been largely priced between $95 and $115 per share, depending mainly on the price of oil. In early 2024, with the price of XOM around 117, I sold a call contract with a strike price of 120 and an expiration date in January, 2024. I think I got around $9 per share for selling this option. The next twelve months went by, and the price of XOM never got above 120, so nobody exercised this call contract against me, and so I simply kept the $9, and kept my XOM shares. Since each contract covers 100 shares, I pocketed $9 x 100= $900 from this exercise, covering 100 shares (approx. $12,000 worth) of XOM stock.

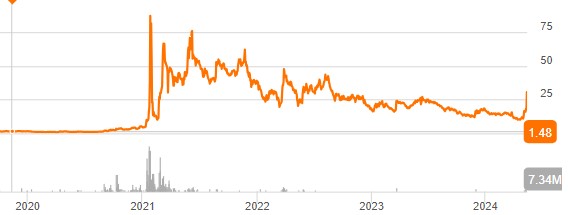
That was the good, here is a not so good: I bought some ARES (Ares Management Corporation) around February 2023 for (I think) around $80/share. For the next few months, the price wobbled between $75 and $90, while the broader S&P 500 stock index (lead by the big tech stocks) was rising smartly. I lost faith in ARES as a growth stock, but decided to at least squeeze some income out of it by selling a call option for about $10 at a strike price of $110 and a distant expiration of Dec 2024.

What then happened is ARES has taken off like a rocket, sitting today at $132/share. If it keeps up like this, it may be well over $150 by December, 2024. I will likely have to sell my 100 shares for $110 (the strike price), so I will get a total of $110 + $10 = $120 for my shares. That is far less than the current market value of these shares. I am not crying, though, since I have some more ARES shares that I did not sell calls on. Also, getting $120 for the shares I bought for $80 is OK with me. There is a saying on Wall Street about being too greedy, “Bulls make money, bears make money, pigs get slaughtered.”

Selling Puts

Briefly, selling out-of-the money puts is like selling calls, on the buy-side instead of the sell-side. It is a way to generate a little income, while garnering an advantageous purchase price, if things go as hoped. In my ARES example above, suppose my 100 shares get called away from me, when the market price is $150. I have various choices at that point. I could simply by a fresh 100 shares at $150, or I could get onto other investments. Or, if I were not happy about paying $150, I might sell a $140 put for say $6 per share. I would have to be OK with either of two outcomes: (1) either the price drops below $140 and the buyer of my put option forces me to buy it at $140 (in which case I need to have $140 x 100= $14,000 in cash available) , though net the stock will only cost me $140 – $6 = $134 ; or (2) the price stays above $140 and I simply pocket the $6 option premium.  And I have to be willing to live with the regret if ARES goes on to $180, in which case it would have been better to have simply bought shares at $150 instead of dinking around with options.

So, there is no one-size-fits-all approach. Again, I prefer to sell puts on companies that more trade in a range. For instance, gold tends to meander up and down – I have thought about it, but never got around to selling puts on gold companies at lows, and calls when they are high.

In Summary

I find judicious selling of calls and puts is a fairly tame way to make a little extra income on stocks. Also, it forces me to set some price targets for buying and selling. I have horrible selling discipline otherwise – I have a hard time making up my mind to buy a stock, but once I do, and once it goes up, I fall in love with it and don’t want to sell it (partly because lazy me doesn’t want to do the work to find a substitute). Selling calls is one way to force myself to set “OK” price targets for letting a stock go.

All that said, selling calls does forfeit participation in the full upside of a stock, and is probably not a good approach in general for growth-oriented tech stocks. Likewise, selling puts, instead of outright buying a stock, may lead to regrets if the stock price goes way up and gets away from you.

As usual, this discussion does not constitute advice to buy or sell any security.

Industries Without Investors

Venture-capital backed startups almost all cluster in the same handful of industries, mostly various types of software. This leaves a variety of large and economically important sectors with almost no venture-capital backed startups. That means those industries see fewer new companies and new ideas; they must rely on either growth from existing firms, which are unlikely to embrace disruptive innovation, or on startups that bootstrap and/or finance with debt, which tend to grow slowly.

Venture capital firm Fifty Years has done a nice job cataloging exactly which industries see the most, and least, investment relative to their size. Here is their picture of the US economy by industry market size:

Now their picture of which industries get the investment (though unfortunately, they aren’t very clear about their data source for it):

They use this to create an “Opportunity Ratio”- current market size divided by current startup funding:

They call the industries with the largest Opportunity Ratios the “Top Underfunded Opportunities”:

I don’t necessarily agree; some industries face shrinking demand, prohibitive regulation, or other fundamental issues making them bad candidates for investment. Conversely, investors haven’t just focused on software randomly or through imitation; they see that it is where the growth is.

Still, herding by investors is real, and I always like the strategy of finding a new game instead of trying to win at the most competitive games, so I do think there is something to the idea of investing in an unsexy industry like paper. Growing up in Maine and watching one paper mill after another close, I always wondered how they managed to lose money in a state that is 90% trees, and whether anyone could find a way to reverse the trend. Perhaps related technology like mass timber or biochar will be the way to take advantage of cheap lumber.

Thanks again to Fifty Years for releasing the data.

Stock Options Tutorial 2. How Options Are Priced

This continues our occasional series on stock options for amateurs.

I find options to be a nice tool in my investing arsenal. The previous post in this series was Stock Options Tutorial 1. Options Fundamentals.  That post dealt with buying options, to provide simple examples. For reasons to explained in a future post, I usually prefer to sell options. Anyway, here we will look briefly at how options are priced. It is important to get an intuitive understanding of this, in order to be comfortable actually using options in your account.

The current price of an option, if you wanted to buy or sell it, is called the premium. There are two components that go into the premium, the intrinsic value and the extrinsic (or “time”) value:

Source: OptionAlpha

Intrinsic Value of Options

The intrinsic value is easy to figure out, once you understand it. It is simply how much you would profit if you owned the option, and decided to exercise it right now. For instance, if you owned a call with a strike price of $50, but the stock price is $55, you could exercise the call and force whoever sold you the call to sell you the stock at a price of $50/share; you could turn around and immediately sell that share for $55, pocketing $5/share. We say that the option in this case is $5 in the money, and the intrinsic value is $5.

If the stock price were $60, it would be $10 in the money; you could pocket $10/share for exercising it. If the stock price were say $90, the option would be $40 in the money, and so on.

However, if the stock price were $50 (the $50 option is “at the money”) or lower (option is “out of the money”), you would get no benefit from being able to purchase this stock for $50, and so the intrinsic value of the option would be zero.

With a put (which is an option to sell a stock at a particular price), this is all reversed. If the stock is $5 lower than the option strike price, the option is $5 in the money and has a $5 intrinsic value, since if you own it, you could say buy the stock at $45, and force the put option seller to buy it from you at $50/share:

Source: OptionAlpha

Extrinsic (Time) Value of Options

Suppose the current price of a stock is $50. And suppose you suspect its price may be above $50, say $60 sometime in the next month, so you would like to have the option of buying it at $50 sometime in the future, and then selling it into the market at (say) $60, for a quick, guaranteed profit of $10. Sounds great, yes?

Since a $50 call is right at the money (since the stock price is also $50), the intrinsic value of a $50 call is zero. Does this mean you could go out and buy a $50 call option for nothing? No, because the seller of the option is taking a risk by providing you that option. If the stock really does go to $60, he could be out the $10. Therefore, he will demand a higher price than the intrinsic price, to make it worth his while. This extra premium over the intrinsic premium is the extrinsic premium, which varies greatly with the time till expiration of the option.

If you wanted the option of buying the stock at $50 sometime in the next week, the option seller would charge only a small amount; after all, what are the odds that the stock will rise a lot in one week? However, if you wanted to extend that option period out to one year, he will charge you a high extrinsic premium, since there is a bigger chance that the stock could soar will over $50 sometime in that long timeframe.

Another way of framing this is, if you buy a $50 call option today with an expiration date a year from now, you will pay a high extrinsic value. But as the months roll by, and it gets closer to the expiration date, this extrinsic value or time premium will shrink down ever more quickly towards zero:

Source: QuantStackExchange, on Seeking Alpha

Now, computing the actual amount of the extrinsic value is really gnarly. The Black-Scholes model provides a theoretical value under idealized conditions, but for us amateurs, we pretty much have to just take what the market gives us. In deciding whether to buy or sell an option, I look at what the current market pricing is for it.

It turns out that an option which is priced at the money has the highest extrinsic value. As you get further into or out of the money, the extrinsic component of the total premium for the option diminishes. Below is one final graphic which pulls all this together:

Source: OptionTradingTips

The call option strike price is $25. The blue line shows the intrinsic value (labeled as “payoff at expiration”) at each stock price – this is zero at or below $25, and increases 1:1 as the stock price climbs above $25. The red curve shows the full market price of the option, including the extrinsic (time) premium. The spacing between the red and the blue lines shows the amount of the extrinsic premium. That spacing is greatest when the stock price is equal to the $25 strike price. The shaded areas specify the intrinsic and extrinsic values at a stock price of $27.

And (not shown here) as time passed and the option got closer to expiry, the extrinsic value would shrink (decay), and the red curve would creep closer and closer to the blue curve.