Borrowing, Beef, and Break-even

Interest rates communicate the value of resources over time. For example, if you take out a loan, then the interest rate tells you how much you must to pay in order to keep that money over the life of the loan. The interest rate also reflects how much the lender will be compensated in exchange for parting with their funds. On the consumer side, the interest rate reflects the price that the borrower is willing to pay in order to avoid delaying a purchase.

When a business borrows, the interest rate reflects the minimal amount of value that they would need to create in order to make an accounting profit. For example, if a business borrows $100 for one year at an interest rate of 5%, then they need to earn $105 by the time that they repay the loan in order to break even with zero profit. The business would need to earn more than 5% in order to earn a profit on their borrowing and investment venture.

The longer the business takes to repay their loan, the more interest that accrues. And, the higher the interest rate, the more they need to earn in order to repay their loan.

This logic applies to all production because all production takes time. If production takes very little time, then the impact of the interest cost is miniscule. But, if production takes longer, then interest rates become increasingly relevant. These kinds of products include trees, cheese, wine, livestock, etc. Anything that ages, ferments, or has a lengthy production process will be more sensitive to the cost of borrowing.

How?

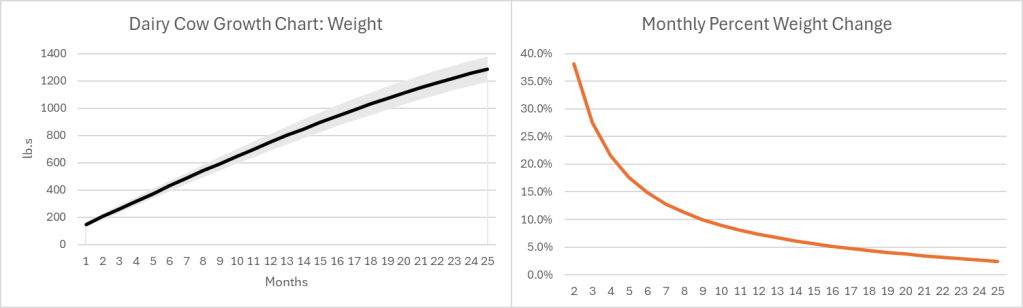
The growth pattern for most (all?) goods looks similar. Below-left is a growth chart for dairy cows . Notice that calves grow quickly at first, and their growth slows over time. For the sake of argument, let’s say that the change in value of a cow mimics the change in weight (Yes, I know that dairy and beef cows are different, but the principle is the same).  Below-right is the monthly percent change. Even at an age of 25 months a cow is still growing in value at 2.4% per month or 33% per year.

Of course, there is a risk that some cows don’t survive to slaughter, lowering the expected growth rate. Since most cattle are slaughtered between 18 and 24 months of age, their growth rate at the time of slaughter is 4.4%-2.7% per month. As the interest rate at which farmers borrow rises, the optimal age at slaughter falls. Otherwise, the spread between the growth rate and the interest rate could go negative. Even so, what an investment! If you can borrow at, say, 8% per year, then you’ll make money hand-over-fist on the spread.

Except… Cows cost money to raise, and most of that cost is feed. According to the production indicators and estimated returns published by the USDA, the cost of feed in February of 2023 was $158.11 per hundred pounds of beef. The selling price of beef was $161.07. That leaves $2.96 or a profit of 1.87% earned over the course of 1.5-1.75 years. That investment is starting to look a lot less good, especially since it doesn’t include the cost of maintaining facilities, insurance, etc. It’s no wonder that farmers and ranchers are serious about their subsidies. Clearly, with such tight margins, farmers and ranchers are going to look good and hard at the interest rates that they pay on their debt. And, they do have debt.

However, the recent increase in beef prices is not caused by higher interest rates.

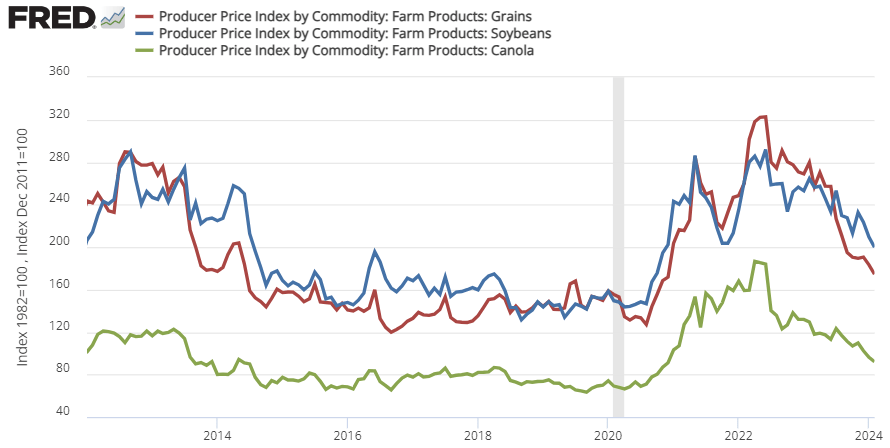
That 1.87% profit margin is at prices and costs from February 2023. Since 2020, the price of cattle feed ingredients (grain, bean, and oil) peaked in the summer of 2022 and are still substantially more expensive than pre-Covid (see below). That means that cows getting slaughtered right now were raised on more expensive feed. This February 2024, the cost of feed per 100lb. of cattle was $191.80. But the cattle selling price was only $180.75. That’s a $11.05 loss for cattle raising. Wholesale prices of cattle might be up recently, but the cost of feed is up by more. It’s not the cattle farmers who are benefiting from the high beef prices. In fact, they’re getting squeezed hard.

There is good news. The cost of feed ingredients has been falling recently, which means that beef farmers should begin to see some relief if the recent trend continues. For Consumers, the price of beef is already down from its 2023 peak.

Business Development Companies: My Favorite Class of High Yield Investments

It is easy to find securities which pay over 10% yield. It is not so easy to find securities which pay over 10% yield AND which maintain their share price over time. Many funds, especially closed-end funds, follow the “melting ice cube model” – they pay high current yields by slowly liquidating the fund assets, since the generous distributions are not matched by actual money-making by the fund’s investments. Oh, and the fund managers charge a nice fee for slowly giving you back your money. The result is that over longish time periods (e.g. five years) the stock price and the dividends decline.

I have been burned numerous times by such “high yield traps” in my longtime exploration of high yielding securities. A glorious exception has been business development companies (BDCs). These companies operate much like banks, lending out money and collecting interest on those loans. They lend to smaller, shakier enterprises that cannot get loans from banks. BDCs get to charge these (desperate?) clients very high interest rates, often around 6-7% over SOFR, which is the replacement for the old LIBOR benchmark, and which is very close to the current Fed funds rate. So back when regular short-term rates were near zero, BDCs were charging around 6%, and now (with Fed funds at 5.3%) they lend out money at around 11%. BDC’s leverage up by about 1:1 by issuing bonds, which boosts net income; this cash inflow is offset by really big management fees. The net result for us equity shareholders is that BDCs are paying out around 10-12% per year in dividends. That varies, of course, from one BDC to the next.

(If you just look at the usual “Forward Yield” value in your brokerage account or Yahoo Finance, it might only show like 9% or so. The reason is that BDCs, in good times like now, often pay out significant “special” dividends, which supplement the regular dividends; but only the regular dividends show up in the standard yield reporting).

One of the largest and oldest BDCs is Ares Capital Corporation, ARCC. If you just look at share price, ARCC does not look too inspiring. In the past five years, its price is up only about 9%, which is way less that the S&P 500 standard fund SPY. (But at least it is not down, like the generic bond fund AGG).

But when you look at total returns, which includes reinvested dividends, ARCC actually beats out SPY (85.7 % vs. 83.9% total returns), which is a noteworthy feat. Another large BDC, HTGC (green line in the plot below) did even better, with roughly 1.8 times the yield of SPY:

The current yield of ARCC 9.3%. This is on the low side for BDCs; ARCC is regarded as very secure, and so its price gets bid up. The yield of HTGC is 10.6%, while relative newcomer TRIN is paying 14%.

Lending to small, sometimes starting-up companies sounds risky, but the risk is mitigated by being at the tip top of the company’s capital stack. The loans are typically secured first-lien, which means in event of bankruptcy, they would get paid off before anything else. If the client company goes totally belly-up, the recovery on these loans is historically about 80%. In practice, a good BDC will often work with the client to come to some arrangement where the recovery is close to 100%. (For unsecured bonds, recoveries in bankruptcy are about 40%, while preferred stockholders get a few crumbs like shares in the reorganized post-bankruptcy enterprise, and common shareholders get zip). If you invest in a small cap stock fund like the Russell 2000, you are owning common stock in some of the companies that BDCs lend to. As such, you are actually in a much riskier position than owning shares in a BDC. Just saying.

Sound interesting? My short list of BDC favorites includes ARCC, HTGC, TRIN, TSLX, and BXSL. For one-stop shopping there are funds which hold a basket of BDCs. BIZD is the venerable big gorilla in this category. It blindly holds the largest BDCs by market cap. A newer, much smaller ETF is PBDC, which uses active, hopefully smart management. Since inception about 18 months ago, PBDC has beat out BIZD by about 12% in total returns, which more than compensates for its higher management fees (0.75% for PBDC versus 0.4% for BIZD).

Disclaimer: As usual, nothing here represents advice to buy or sell any security.

A Contrarian View from Apollo: No Rate Cuts in 2024

The mainstream view for the last 18 months has been that Fed rates cuts are always right around the corner. Markets are acting like the cutting cycle has already begun.

Apollo Global Management is a well-regarded alternative investment firm. (Disclosure: I own some APO stock). Their Chief Economist, Torsten Sløk, recently published his outlook, which differs sharply from the mainstream view. He notes that by various measures, the economy is heating up (or at least staying hot), and inflation has started to creep back up, not down. In his words:

The market came into 2023 expecting a recession.

The market went into 2024 expecting six Fed cuts.

The reality is that the US economy is simply not slowing down, and the Fed pivot has provided a strong tailwind to growth since December.

As a result, the Fed will not cut rates this year, and rates are going to stay higher for longer.

How do we come to this conclusion?

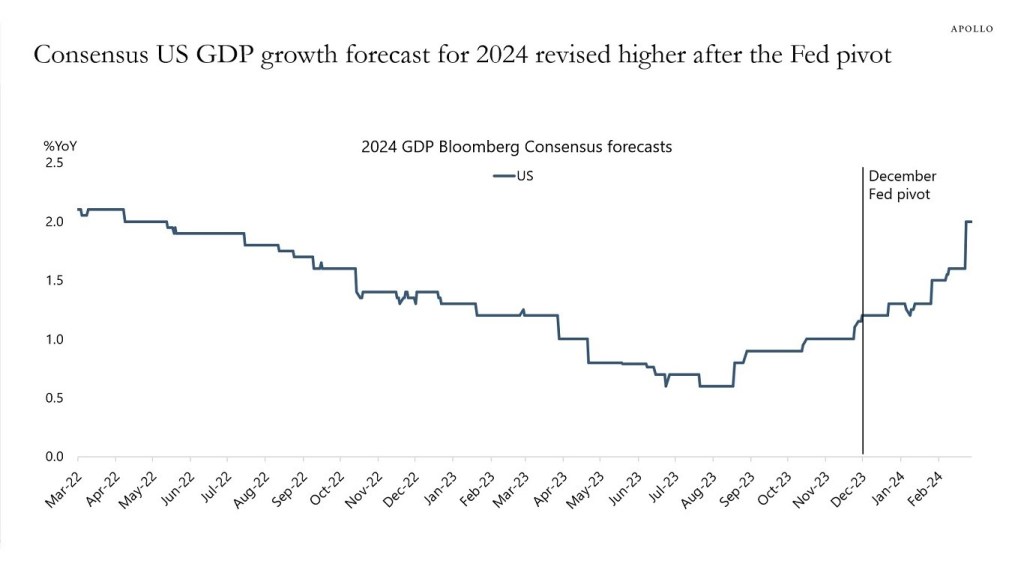
1) The economy is not slowing down, it is reaccelerating. Growth expectations for 2024 saw a big jump following the Fed pivot in December and the associated easing in financial conditions. Growth expectations for the US continue to be revised higher, see the first chart below.

2) Underlying measures of trend inflation are moving higher, see the second chart.

3) Supercore inflation, a measure of inflation preferred by Fed Chair Powell, is trending higher, see the third chart.

4) Following the Fed pivot in December, the labor market remains tight, jobless claims are very low, and wage inflation is sticky between 4% and 5%, see the fourth chart.

5) Surveys of small businesses show that more small businesses are planning to raise selling prices, see the fifth chart.

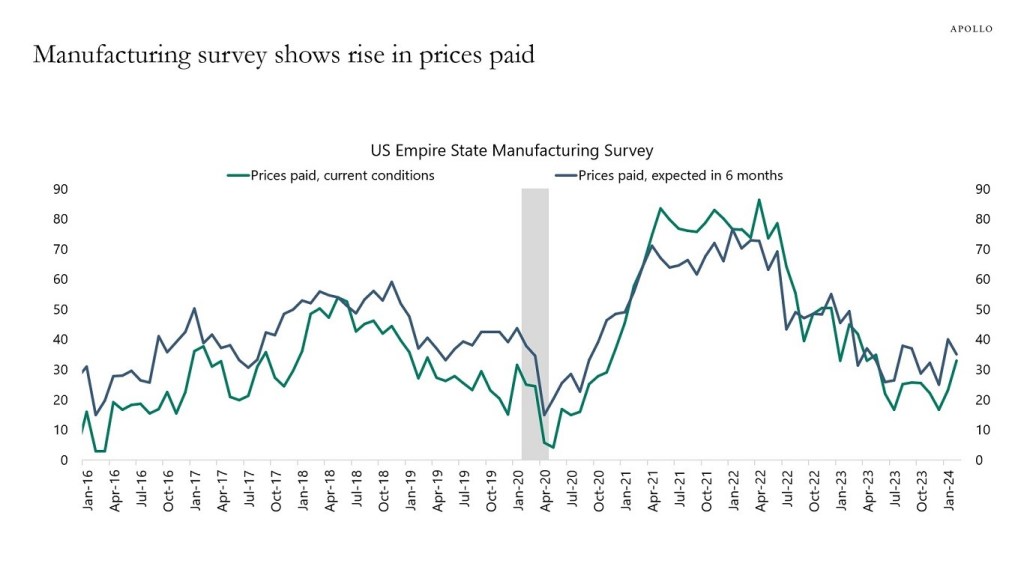
6) Manufacturing surveys show a higher trend in prices paid, another leading indicator of inflation, see the sixth chart.

7) ISM services prices paid is also trending higher, see the seventh chart.

8) Surveys of small businesses show that more small businesses are planning to raise worker compensation, see the eighth chart.

9) Asking rents are rising, and more cities are seeing rising rents, and home prices are rising, see the ninth, tenth, and eleventh charts.

10) Financial conditions continue to ease following the Fed pivot in December with record-high IG issuance, high HY issuance, IPO activity rising, M&A activity rising, and tight credit spreads and the stock market reaching new all-time highs. With financial conditions easing significantly, it is not surprising that we saw strong nonfarm payrolls and inflation in January, and we should expect the strength to continue, see the twelfth chart.

The bottom line is that the Fed will spend most of 2024 fighting inflation. As a result, yield levels in fixed income will stay high.

[END OF EXCERPT]

The big question, of course, is whether these recent signs of increased inflation are just blips of  noise, or the start of a new trend. Time will tell if Sløk’s contrarian view is correct, but I have to respect his intestinal fortitude in putting it right  out there, without any weaselly qualifications. He refers to many charts which are in his original article. I will reproduce four of these charts below:

The Best Personal Finance Books

Last week Scott offered a very negative review of one popular personal finance book, Rich Dad Poor Dad. My own take on the book is less negative, but I still wouldn’t recommend it to most people. That still leaves the question of which personal finance books are worthwhile. I gave my answer back in 2020 in a post on my personal blog. You can read the full reviews there, but I’ll give my short answers here:

I Will Teach You to Be Rich

Despite the title, the book is really about the basics of how to get out of debt, save for retirement, and manage credit. The material is stuff most people will figure out on their own by their 30’s or 40’s, but it’s a nice presentation all in one place and can save people from learning lessons the hard way. Perfect for a college student, someone at their first real job, or someone older who feels like they missed the memo on how all this works. His big idea is that once you set and meet good savings goals, you don’t need to feel guilty about the things you do spend money on.

The Millionaire Next Door

This book is built around surveying millionaires and finding the commonalities in what they did to get wealthy. The core idea is that Americans with millions saved tend to have moderately high incomes but very high savings rates. Even someone with a normal income can become a millionaire- income is different from wealth. The key is to live frugally and let the compound returns on your savings work for you. The original version of the book is inspiring, but has out of date numbers; the author’s daughter recently updated it (The Next Millionaire Next Door) with more current numbers.

There are many more books about how to invest, but for broad takes on personal finance overall these are the best two I have found, and the ones I recommend to students. Still interested to hear your thoughts on more recommendations.

Stock Options Tutorial 3. Selling Options to Generate Extra Income

In the first installment of this series on stock options, I focused on buying options, as a means to economically participate in the movement of a stock price up or down. If you guess correctly that say Apple stock will go up by 10% in the next two months, you can make much more money with less capital at risk by buying a call option than by buying Apple stock itself. Or if you guess correctly that Apple stock will go down by 10% in the next two months, you can make more money, with less risk, by buying a put option on Apple, then by selling the stock short.

In part two of the series, I discussed how options are priced, noting the difference between intrinsic value, and the time-dependent extrinsic value.

Here in part three, I will discuss the merits of selling, rather than buying options. This is the way I usually employ them, and this is what I would suggest to others who want to dip their toes in this pond.

Just to revisit a point made in the first article, I see two distinct approaches to trading options. Professional option traders typically make hundreds of smallish trades a year, with the expectation that most of them will lose some money, but that some will make big money. A key to success here is limiting the size of the losses on your losing trades. It helps to have nerves of steel. Some people have the temperament to enjoy this process, but I do not.

Selling Out of the Money Calls

Instead if spending my days hunched over a screen managing lots of trades, I would rather set up a few trades which may run over the course of 6 to 12 months, where I am fairly OK with any possible outcome from the trades. A typical example is if I bought a stock at say $100 a share, and it has gone up to $110 a share, and I will be OK with getting $120 a share for it; in this case I might sell a six-month call option on it for five dollars, at a strike price of $115. The strike price here is $5 “out of the money”, i.e., $5 above the current market price.

There are basically two possible outcomes here. If the price of the stock goes above $115, the person who bought the call option will likely exercise it and force me to sell him or her the stock for a price of $115. Between that, and the five dollars I got for selling the option period, I will have my total take of $120.

On the other hand, if the stock price languishes below $115, I will get to keep the stock, plus the five dollars I got for selling the option. That is not a ton of money, but it is 4.3% of $115. If at the end of the first six-month period I turned around and sold another, similar six-month call option which had the same outcome, now I have squeezed an 8.6% income out of holding the stock. If the stock itself pays say a 4% dividend, now I am making 12.6% a year. Considering the broader stock market only goes up an average of around 10% a year, this is pretty good money.

At this point, you should be asking yourself, if making money selling options is so easy, I have I heard of this before? What’s the catch?

The big catch is that by selling this call, I have forfeited the chance to participate in any further upside of the stock price, beyond my $120 ($155 + $5). If at the end of six months, the stock has soared to $140 a share, but I must sell it for a net take of $120, I am relatively worse off by selling the call. I have still made some money ($20) versus my original purchase price. However, if I had simply held the stock without selling a call option, I would have been ahead by $40 instead of $20. And now if I want to stay in the game with this stock, I have to turn around and buy it back for $140. This decision can involve irksome soul-searching and regrets.

There are two techniques are used to reduce these potential regrets. One is to only sell calls on say half of my holdings of a particular stock. That way, if the stock rockets up, I have the consolation of making the full profit on half my shares.


The other technique is to try to identify stocks that trade in a range. For instance, the price of oil tends to load up and down between about seven day and $90 a barrel, barring some geopolitical upset. and the price of major oil companies, like Chevron or ExxonMobil, likewise trade up and down within a certain range. If you sell calls on these companies when they are near the top of their range, it is less likely that the share price will exceed the strike price of your option. Or, if it does, and you have to sell your shares, there is a good chance that if you just wait a few months, you will be able to buy them back cheaper. On the other hand, a stock like Microsoft tends to just go up and up and up, so it would not be a good target for selling calls.

Some Personal Examples

From memory, I will recount two cases from my own trading, with the two different outcomes noted above. ExxonMobil stock has been largely priced between $95 and $115 per share, depending mainly on the price of oil. In early 2024, with the price of XOM around 117, I sold a call contract with a strike price of 120 and an expiration date in January, 2024. I think I got around $9 per share for selling this option. The next twelve months went by, and the price of XOM never got above 120, so nobody exercised this call contract against me, and so I simply kept the $9, and kept my XOM shares. Since each contract covers 100 shares, I pocketed $9 x 100= $900 from this exercise, covering 100 shares (approx. $12,000 worth) of XOM stock.

That was the good, here is a not so good: I bought some ARES (Ares Management Corporation) around February 2023 for (I think) around $80/share. For the next few months, the price wobbled between $75 and $90, while the broader S&P 500 stock index (lead by the big tech stocks) was rising smartly. I lost faith in ARES as a growth stock, but decided to at least squeeze some income out of it by selling a call option for about $10 at a strike price of $110 and a distant expiration of Dec 2024.

What then happened is ARES has taken off like a rocket, sitting today at $132/share. If it keeps up like this, it may be well over $150 by December, 2024. I will likely have to sell my 100 shares for $110 (the strike price), so I will get a total of $110 + $10 = $120 for my shares. That is far less than the current market value of these shares. I am not crying, though, since I have some more ARES shares that I did not sell calls on. Also, getting $120 for the shares I bought for $80 is OK with me. There is a saying on Wall Street about being too greedy, “Bulls make money, bears make money, pigs get slaughtered.”

Selling Puts

Briefly, selling out-of-the money puts is like selling calls, on the buy-side instead of the sell-side. It is a way to generate a little income, while garnering an advantageous purchase price, if things go as hoped. In my ARES example above, suppose my 100 shares get called away from me, when the market price is $150. I have various choices at that point. I could simply by a fresh 100 shares at $150, or I could get onto other investments. Or, if I were not happy about paying $150, I might sell a $140 put for say $6 per share. I would have to be OK with either of two outcomes: (1) either the price drops below $140 and the buyer of my put option forces me to buy it at $140 (in which case I need to have $140 x 100= $14,000 in cash available) , though net the stock will only cost me $140 – $6 = $134 ; or (2) the price stays above $140 and I simply pocket the $6 option premium.  And I have to be willing to live with the regret if ARES goes on to $180, in which case it would have been better to have simply bought shares at $150 instead of dinking around with options.

So, there is no one-size-fits-all approach. Again, I prefer to sell puts on companies that more trade in a range. For instance, gold tends to meander up and down – I have thought about it, but never got around to selling puts on gold companies at lows, and calls when they are high.

In Summary

I find judicious selling of calls and puts is a fairly tame way to make a little extra income on stocks. Also, it forces me to set some price targets for buying and selling. I have horrible selling discipline otherwise – I have a hard time making up my mind to buy a stock, but once I do, and once it goes up, I fall in love with it and don’t want to sell it (partly because lazy me doesn’t want to do the work to find a substitute). Selling calls is one way to force myself to set “OK” price targets for letting a stock go.

All that said, selling calls does forfeit participation in the full upside of a stock, and is probably not a good approach in general for growth-oriented tech stocks. Likewise, selling puts, instead of outright buying a stock, may lead to regrets if the stock price goes way up and gets away from you.

As usual, this discussion does not constitute advice to buy or sell any security.

Industries Without Investors

Venture-capital backed startups almost all cluster in the same handful of industries, mostly various types of software. This leaves a variety of large and economically important sectors with almost no venture-capital backed startups. That means those industries see fewer new companies and new ideas; they must rely on either growth from existing firms, which are unlikely to embrace disruptive innovation, or on startups that bootstrap and/or finance with debt, which tend to grow slowly.

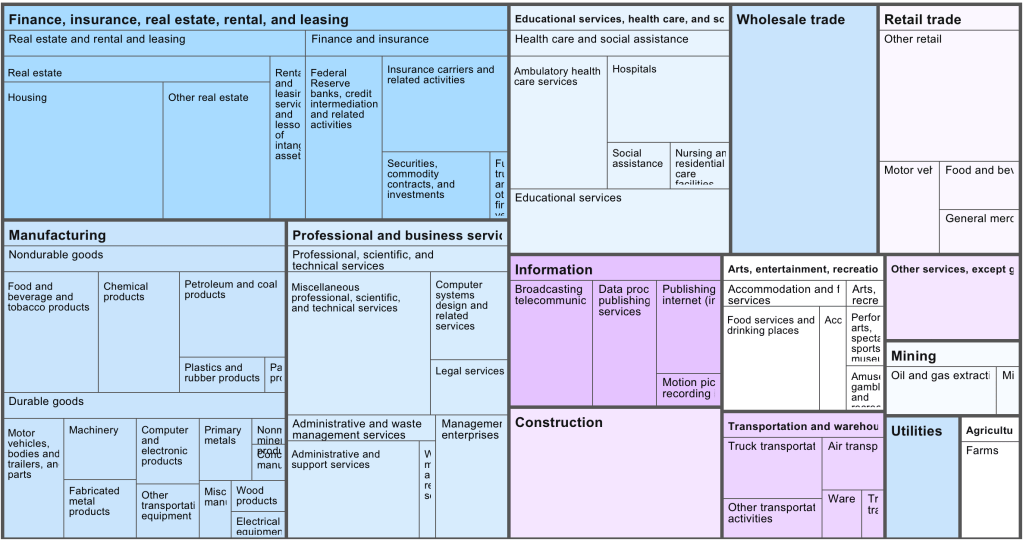
Venture capital firm Fifty Years has done a nice job cataloging exactly which industries see the most, and least, investment relative to their size. Here is their picture of the US economy by industry market size:

Now their picture of which industries get the investment (though unfortunately, they aren’t very clear about their data source for it):

They use this to create an “Opportunity Ratio”- current market size divided by current startup funding:

They call the industries with the largest Opportunity Ratios the “Top Underfunded Opportunities”:

I don’t necessarily agree; some industries face shrinking demand, prohibitive regulation, or other fundamental issues making them bad candidates for investment. Conversely, investors haven’t just focused on software randomly or through imitation; they see that it is where the growth is.

Still, herding by investors is real, and I always like the strategy of finding a new game instead of trying to win at the most competitive games, so I do think there is something to the idea of investing in an unsexy industry like paper. Growing up in Maine and watching one paper mill after another close, I always wondered how they managed to lose money in a state that is 90% trees, and whether anyone could find a way to reverse the trend. Perhaps related technology like mass timber or biochar will be the way to take advantage of cheap lumber.

Thanks again to Fifty Years for releasing the data.

Stock Options Tutorial 2. How Options Are Priced

This continues our occasional series on stock options for amateurs.

I find options to be a nice tool in my investing arsenal. The previous post in this series was Stock Options Tutorial 1. Options Fundamentals.  That post dealt with buying options, to provide simple examples. For reasons to explained in a future post, I usually prefer to sell options. Anyway, here we will look briefly at how options are priced. It is important to get an intuitive understanding of this, in order to be comfortable actually using options in your account.

The current price of an option, if you wanted to buy or sell it, is called the premium. There are two components that go into the premium, the intrinsic value and the extrinsic (or “time”) value:

Source: OptionAlpha

Intrinsic Value of Options

The intrinsic value is easy to figure out, once you understand it. It is simply how much you would profit if you owned the option, and decided to exercise it right now. For instance, if you owned a call with a strike price of $50, but the stock price is $55, you could exercise the call and force whoever sold you the call to sell you the stock at a price of $50/share; you could turn around and immediately sell that share for $55, pocketing $5/share. We say that the option in this case is $5 in the money, and the intrinsic value is $5.

If the stock price were $60, it would be $10 in the money; you could pocket $10/share for exercising it. If the stock price were say $90, the option would be $40 in the money, and so on.

However, if the stock price were $50 (the $50 option is “at the money”) or lower (option is “out of the money”), you would get no benefit from being able to purchase this stock for $50, and so the intrinsic value of the option would be zero.

With a put (which is an option to sell a stock at a particular price), this is all reversed. If the stock is $5 lower than the option strike price, the option is $5 in the money and has a $5 intrinsic value, since if you own it, you could say buy the stock at $45, and force the put option seller to buy it from you at $50/share:

Source: OptionAlpha

Extrinsic (Time) Value of Options

Suppose the current price of a stock is $50. And suppose you suspect its price may be above $50, say $60 sometime in the next month, so you would like to have the option of buying it at $50 sometime in the future, and then selling it into the market at (say) $60, for a quick, guaranteed profit of $10. Sounds great, yes?

Since a $50 call is right at the money (since the stock price is also $50), the intrinsic value of a $50 call is zero. Does this mean you could go out and buy a $50 call option for nothing? No, because the seller of the option is taking a risk by providing you that option. If the stock really does go to $60, he could be out the $10. Therefore, he will demand a higher price than the intrinsic price, to make it worth his while. This extra premium over the intrinsic premium is the extrinsic premium, which varies greatly with the time till expiration of the option.

If you wanted the option of buying the stock at $50 sometime in the next week, the option seller would charge only a small amount; after all, what are the odds that the stock will rise a lot in one week? However, if you wanted to extend that option period out to one year, he will charge you a high extrinsic premium, since there is a bigger chance that the stock could soar will over $50 sometime in that long timeframe.

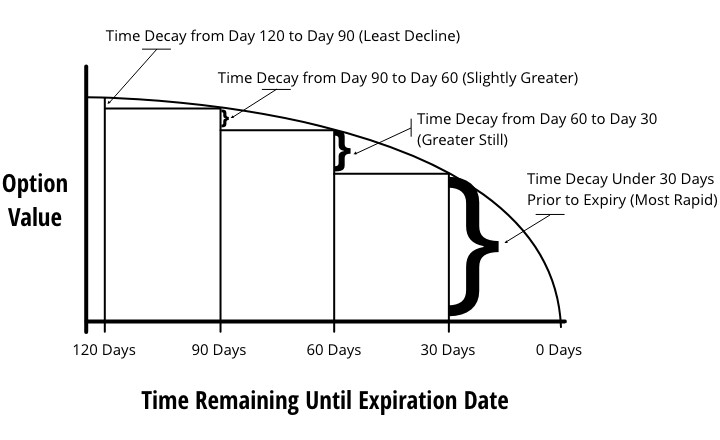
Another way of framing this is, if you buy a $50 call option today with an expiration date a year from now, you will pay a high extrinsic value. But as the months roll by, and it gets closer to the expiration date, this extrinsic value or time premium will shrink down ever more quickly towards zero:

Source: QuantStackExchange, on Seeking Alpha

Now, computing the actual amount of the extrinsic value is really gnarly. The Black-Scholes model provides a theoretical value under idealized conditions, but for us amateurs, we pretty much have to just take what the market gives us. In deciding whether to buy or sell an option, I look at what the current market pricing is for it.

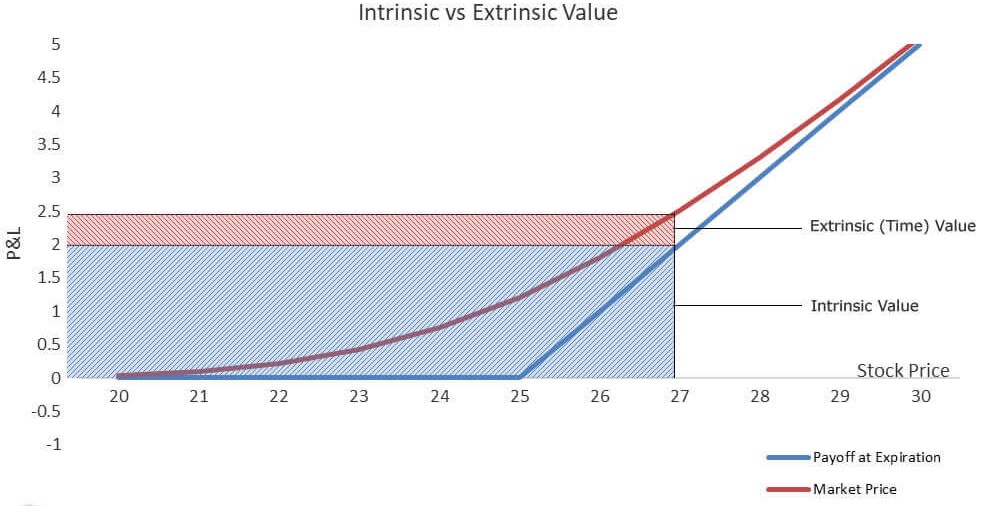
It turns out that an option which is priced at the money has the highest extrinsic value. As you get further into or out of the money, the extrinsic component of the total premium for the option diminishes. Below is one final graphic which pulls all this together:

Source: OptionTradingTips

The call option strike price is $25. The blue line shows the intrinsic value (labeled as “payoff at expiration”) at each stock price – this is zero at or below $25, and increases 1:1 as the stock price climbs above $25. The red curve shows the full market price of the option, including the extrinsic (time) premium. The spacing between the red and the blue lines shows the amount of the extrinsic premium. That spacing is greatest when the stock price is equal to the $25 strike price. The shaded areas specify the intrinsic and extrinsic values at a stock price of $27.

And (not shown here) as time passed and the option got closer to expiry, the extrinsic value would shrink (decay), and the red curve would creep closer and closer to the blue curve.

Saba Closed-End Funds ETF (CEFS): Have Finance Legend Boaz Weinstein Manage Your Closed End Fund Investments

Boaz Weinstein and the London Whale

Boaz Weinstein is a really smart guy. At age 16 the US Chess Federation conferred on him the second highest (“Life Master”) of the eight master ratings. As a junior in high school, he won a stock-picking contest sponsored by Newsday, beating out a field of about 5000 students. He started interning with Merrill Lynch at age 15, during summer breaks. He has the honor of being blacklisted at casinos for his ability to count cards. 

He entered into heavy duty financial trading right out of college, and quickly became a rock star. He joined international investment bank Deutsche Bank in 1998, and led their trading of then-esoteric credit default swaps (securities that payout when borrowers default). Within a few years his group was managing some $30 billion in positions, and typically netting hundreds of millions in profits per year. In 2001, Weinstein was named a managing director of the company, at the tender age of 27.

Weinstein left Deutsche Bank in 2009 and started his own credit-focused hedge fund, Saba Capital Management. One of its many coups was to identify some massive, seemingly irrational trades in 2012 that were skewing the credit default markets. Weinstein pounced early, and made bank by taking the opposite sides of these trades. He let other traders in on the secret, and they also took opposing positions.

(It turned out these huge trades were made by a trader in J. P. Morgan’s London trading office, Bruno Iksil, who was nick-named the London Whale. Morgan’s losses from Iksil’s trades mounted to some $6.2 billion.)

For what it’s worth, Weinstein is by all accounts a really nice guy. This is not necessarily typical for many high-powered Wall Street traders who have been as successful as he.

Weinstein and the Sprawling World of Closed End Funds

If you have a brokerage account, you can buy individual securities, like Microsoft common stock shares, or bonds issued by General Motors. Many investors would prefer not to have to do the work of screening and buying and holding hundreds of stocks or bonds. No problem, there exist many funds, which do all the work for you. For instance, the SPY fund holds shares of all 500 large-cap American companies that are in the S&P 500 index, so you can simply buy shares of the one fund, SPY. 

Without going too deeply into all this, there are three main types of funds held by retail investors. These are traditional open-end mutual funds, the more common exchange-traded funds (ETFs), and closed end funds (CEFs). CEFs come in many flavors, with some holding plain stocks, and others holding high-yield bonds or loans, or less-common assets like spicy CLO securities. A distinctive feature of CEFs is that the market price per share often differs from the net asset value (NAV) per share. A CEF may trade at a premium or a discount to NAV, and that premium or discount can vary widely with time and among otherwise-similar funds. This makes optimal investing in CEFs very complex, but potentially-rewarding: if you can keep rotating among CEF’s, buying ones that are heavily discounted, then selling them when the discount closes, you can in theory do much better than a simple buy and hold investor.

I played around in this area, but did not want to devote the time and attention to doing it well, considering I only wanted to devote 3-4% of my personal portfolio to CEFs. There are over 400 closed end funds out there. So, I looked into funds whose managers would (for a small fee) do that optimized buying and selling of CEFs for me.

It turns out that there are several such funds-of-CEF-funds. These include ETFs with the symbols YYY and PCEF, CEFS, and also the closed end funds FOF and RIV. YYY and PCEF tend to operate passively, using fairly mechanical rules. PCEF aims to simply replicate a broad-based index of the CEF universe, while YYY rebalances periodically to replicate an “intelligent” index which ranks CEFs by yield, discount to net asset value and liquidity. FOF holds and adjusts a basket of undervalued CEFs chosen by active managers, while RIV holds a diverse pot of high-yield securities, including CEFs. The consensus among most advisers I follow is that FOF is a decent buy when it is trading at a significant discount, but it makes no sense to buy it now, when it is at a relatively high premium; you would be better off just buying a basket of CEFs yourself.

I settled on using CEFS (Saba Closed-End Funds ETF)  for my closed end fund exposure. It is very actively co-managed by Saba Capital Management, which is headed by none other than Boaz Weinstein. I trust whatever team he puts together. Among other things, Saba will buy shares in a CEF that trades at a discount, then pressure that fund’s management to take actions to close the discount.

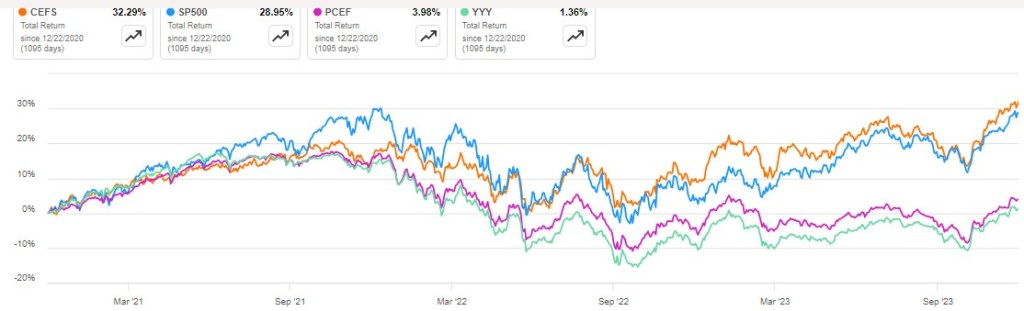
The results speak for themselves. Here is a plot of CEFS (orange line) versus SP500 index (blue), and two passively-managed ETFs that hold CEFs, PCEF (purple) and YYY (green) over the past three years:

The Y axis is total return (price action plus reinvestment of dividends). CEFS smoked the other two funds-of-funds, and even edged out the S&P in this time period.  It currently pays out a juicy 9% annualized distribution. Thank you, Mr. Weinstein, and Merry Christmas to all my fellow investors.

Boilerplate disclaimer: Nothing in this article should be regarded as advice to buy or sell any security.

Charlie Munger’s Rule for a Happy Life

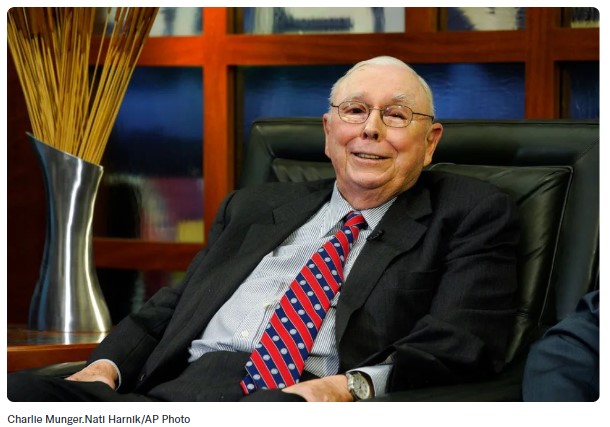
A big piece of news in the investment world has been the passing of Charlie Munger on Nov 28 at age 99. He was vice chair of Berkshire Hathaway, and Warren Buffett’s right-hand man there.

Munger grew up in Omaha, Nebraska, which is Warren Buffett’s hometown as well. They met at a dinner party there in 1959, and hit it off with one another personally.  Munger was a really smart guy. After joining the US Army Air Corps in1943, he scored highly on an intelligence test and was sent to study meteorology at Caltech. After the war he was accepted into Harvard Law School despite lacking a formal undergraduate degree, and graduated summa cum laude.

In his 50s, Munger lost his left eye after cataract surgery failed. A doctor warned he could lose his right eye too, so he began learning braille, but the condition improved.

He entered law practice, and eventually started his own firm, but he became more interested in investing. He racked up 19.8% annual returns investing on his own, between 1962 and 1975. Buffett convince Munger to give up law and join him as vice-chairman of Berkshire Hathaway in 1978.

Perhaps Buffett’s most famous investing saying is “It’s far better to buy a wonderful company at a fair price than a fair company at a wonderful price”. He credits this approach to Munger: “Charlie understood this early – I was a slow learner.”  Before being influenced here by Munger, Buffett had been more inclined to buy very low-priced shares in mediocre companies.  

Munger was heavily involved with Buffett’s decisions. “Berkshire Hathaway could not have been built to its present status without Charlie’s inspiration, wisdom and participation,” Buffett said following Munger’s death. That tribute is no overstatement: from the time Munger joined Berkshire Hathaway in 1978 till now, shares of the company soared 396,182% (i.e.,  $100 invested in Berkshire Hathaway in 1978 is worth $396,282 today). This performance dwarfs the 16,427% appreciation of the S&P 500 over the same time period. When he died, Munger was personally worth $2.6 billion.

(See more on Berkshire Hathaway’s formula for success at: Warren Buffett’s Secret Sauce: Investing the Insurance “Float” )

Quotations From Vice-Chairman Charlie

The internet is rife with sites displaying memorable or useful quotes from Charlie Munger. For example, “I never allow myself to have an opinion on anything that I don’t know the other side’s argument better than they do”;   and three rules for a career: “1) Don’t sell anything [to others] you wouldn’t buy yourself; 2) Don’t work for anyone you don’t respect and admire; and 3) Work only with people you enjoy.”

Some of these quote lists focus on sayings which provide guidance to individual investors, such as this from CNBC:

“I think you would understand any presentation using the word EBITDA, if every time you saw that word you just substituted the phrase,  ‘bull—- earnings.’ ″

The 2003 Berkshire shareholder meeting was one of the many occasions Munger called out what he saw as shady accounting practices, in this case EBITDA — a measure of corporate profitability short for earnings before interest, taxes, depreciation and amortization.

In short, Munger felt that companies often highlighted convoluted profitability metrics to obscure the fact that they were severely indebted or producing very little cash.

“There are two kinds of businesses: The first earns 12%, and you can take it out at the end of the year. The second earns 12%, but all the excess cash must be reinvested — there’s never any cash,” Munger said at the same meeting. “It reminds me of the guy who looks at all of his equipment and says, ‘There’s all of my profit.’ We hate that kind of business.”

To invest like Munger and Buffett, don’t fall for the flashiest numbers in the firms’ investor presentations. Instead, dig into a company’s fundamentals in their totality. The more a company or an investment advisor tries to win you over with esoteric terms, the more skeptical you should likely be.

As Buffett put it in his 2008 letter to shareholders: “Beware of geeks bearing formulas.”

Munger’s Secret to Happiness

Out of all these witty and helpful quotes, I’ll conclude by zeroing in on what Charlie Munger thought was the single most important factor in achieving personal happiness. He said it a number of different ways:

The secret to happiness is to lower your expectations. …that is what you compare your experience with. If your expectations and standards are very high and only allow yourself to be happy when things are exquisite, you’ll never be happy and grateful. There will always be some flaw. But compare your experience with lower expectations, especially something not as good, and you’ll find much in your experience of the world to love, cherish and enjoy, every single moment.

and

The world is not going to give you extra return just because you want it. You have to be very shrewd and hard working to get a little extra. It’s so much easier to reduce your wants. There are a lot of smart people and a lot of them cheat, so it’s not easy to win.

and finally:

A happy life is very simple. The first rule of a happy life is low expectations. That’s one you can easily arrange. And if you have unrealistic expectations, you’re going to be miserable all your life. I was good at having low expectations and that helped me. And also, when you [experience] reversals, if you just suck it in and cope, that helps if you don’t just stew yourself into a lot of misery.

Stock Options Tutorial 1. Options Fundamentals

Put simply, a stock option is a contract to buy (if it is a call option) or to sell (if it is a put option) a given stock at some particular price (“strike price”), by some particular expiration date.

Example: Buying Apple Call Option Instead of the Stock


In a little more detail: if you buy a call option on a stock, that gives you the right to buy that stock at the strike price (“call” the stock away from some current stockholder).
For most American stocks the option holder can exercise this right at any time, up till the end of the expiration day. (For so-called European options, you can only exercise the option on the expiration date itself.)
Let’s jump into an example. As of late morning 11/27/2023 when I am writing this, the price of Apple stock is $190 per share.  Suppose I have a strong conviction that within the next month or so, Apple will go up by 10 dollars (5%) to $200/share.

One thing I can do is plunk down 100 x $190= $19,000 to buy 100 shares of Apple, and wait. If Apple does indeed reach my target price of $200 in some reasonable timeframe, and I sell it there, I will make a profit of 100 shares x $10 / share = $1000 on my initial investment of $19,000. That represents a 5.3% return on my investment.


But suppose because of some unexpected factor (Taiwan invasion?), that the price of Apple plunges by say 30% to $133/share, and remains there for the indefinite future. If I want to get my money out of this affair and move on, I would face a huge loss of 100 shares x (190-133)= $5,700 dollars on my large $19,000 investment.

Instead of buying the stock outright, I could buy a call option. There are a number of specific strategies and choices here, but to keep it simple, I could buy an Apple call option with a strike price of 190 (the current price of Apple) and an expiration date of say December 29, 2023. At the moment, that call option would cost me $3.80 per share, or $380 dollars for a standard options contract that involves 100 shares.


If Apple stock hits my price target of $200 sometime in the next month, I could exercise this option and purchase 100 Apple shares for $19,000 dollars, (100 x $ 190 strike price) and immediately sell them into the market 100 x $200/share = $20,000 dollars. That would give me a net profit of: (profit on stock buy & sell) minus (cost of call option) =  100 x ( ($200 – $190 ) – $3.80 ) = $620. That is a return of 163% on my $380 investment. Woo hoo!
(If I did not want to actually exercise the call, I could have sold it back into the options marketplace; the value of the call would have risen by somewhat less than $10 dollars since the time I bought it, so I could take my profit that way, without going through the cycle of actually buying the shares and immediately selling them.)

If Apple stock fails to rise by more than the $3.80 dollars a share that I paid for the call option, I will lose money on this trade. If Apple stays at or below 190, this call option expires valueless, and I will have lost 100% of my option purchase price. (If say two weeks goes by and the share price is hovering just below 190, this call option might still be worth something like $1.90/share, and I might choose to sell it and bail on this trade, to recover half of my $3.80 instead of risking the loss of all of it; there are many, many ways to trade options).

Now, in the event that Apple shares plunge by 30% and stay low indefinitely, I would only lose the $380 that the options cost me, instead of the $5,700 dollars I would lose if I had bought the stock outright.

This example demonstrates some of the benefits of buying stock options: You can make a huge return on your invested/risked capital if your stock price thesis plays out, and you can be shielded from any losses other than the cost of the option. The big weakness of this approach is that your hoped-for stock move must occur within a limited timeframe, before the expiration date, or else you can lose 100% of your investment. Folks who trade options for a living make lots and lots of small trades, knowing that they will lose on a significant percentage of these trades, hoping that their wins will outweigh their losses.

Buying Put Options for Hedging and Speculation

This has been a somewhat long-winded explanation of one way of utilizing options, namely, buying calls. Buying a put option, on the other hand, gives you the right to require that someone will buy a stock from you at the strike price (here, you are “putting” the stock to the person who sold you the option).

Puts are often used as for protective hedging. Suppose I own 100 shares of Apple stock that is currently valued at 190 dollars a share, and I want to protect against the effects of a possible plunging share price. As an example, I might buy a March 15, 2024 put with a strike price of 175, for $2.80. If Apple price falls, I would absorb the first 15 dollars per share of the losses, from 190 to the strike price of 175. However, that put would protect me against any further losses, since no matter how low the share price goes, I could sell my shares at $175. (Again, instead of actually selling my shares, I might sell the puts back into the market, since their value would have increased as Apple share price fell).
Buying puts in this manner is like buying insurance on your portfolio: it costs you a little bit per month, but prevents catastrophic losses.

Buying puts can also be used for speculative trading. Suppose I was convinced that Apple stock might fall well below $175 in the next three months. Without owning Apple shares, I might buy that March 2024 175 put for $2.80 per share, or $280 for a 100-share contract. If Apple share price went anywhere below (175 – 2.80 = 172.20), I would make money on this trade. If the price went back down to its recent low of 167, my net profit would be around 100 x (172.2 – 167) = $520. This would be nearly doubling the $280 I put into buying the puts. But again, if Apple price failed to fall as hoped, I might lose all of my $280 option purchase price.

Where to Find Options Prices

There are lots of YouTube tutorials on trading stock options. Here is quick ten-minute intro: Stock Options Explained, by The Plain Bagel. If you want to check out the prices of options, they are shown on websites like Yahoo Finance, Seeking Alpha (need to give email to sign in; you can ignore all the ads to make you purchase premium), and your own broker’s software.

I usually prefer to sell options, rather than buy them, but that is another post for another time. As usual, this discussion does not constitute advice to buy or sell any security.