Knowing When To Sell: Portfolio Review

90 plus per cent of people, they spend all their time on the buy decision and then they figure it out as they go along on when to sell and we say that’s crazy. You need to establish sell criteria, even if it’s just rebalance, even if it’s a trailing stop, whatever it may be on all your public market positions, because otherwise it gets emotional and that creates huge problems.

Meb Faber

Last week I explained why I buy individual stocks. This week I’ll share how I think about when to sell individual stocks, as I go through my portfolio and decide what to hold and what to sell. This is the first time I’m doing this exercise, though I should have done it long ago; until now I’ve unfortunately been on the wrong side of the above Meb Faber quote.

I actually think that most people are correct not to put much thought into what to sell, because I still agree with Buffett and most economists that most people should just buy and hold diversified index funds. Thinking about selling too much might lead people to sell everything whenever they get worried, sit in cash, and miss out on years of gains. But the important truth in Faber’s point is that if you are buying stocks or active funds for any reason other than “its a great company/idea that I’d like to hold indefinitely”, it makes sense to put as much thought into when/whether to sell as when/whether to buy.

People buy stocks all the time based on short-term arguments like “this banking crisis is overblown”, or “I think the Fed is about to cut rates”, or “this IPO is going to pop”, or “I think the company will beat earnings expectations this quarter”. These might be good or bad arguments to buy but they are all arguments about why it makes sense to hold a certain stock for weeks or months, not for years or indefinitely.

But people often buy a stock for short-term reasons like these, then hold on to it long term- either out of inertia, or because they grow attached to it, or because it lost money and they want to hold until it “makes it back” (sunk cost fallacy). None of these reasons really make sense; they might work out because buying and holding often does, but at that point you might as well be in index funds. If you’re going to be actively trading based on ideas, it makes sense to sell once you know whether your idea worked or not (e.g., did the company you thought would beat earnings actually do it) to free up capital for the next idea (unless you genuinely have a good new idea about the same stock, or you think it makes sense to hold onto it a full year to hit long-term capital gains tax). Its also always fair to fight status quo bias and ask “would I buy this today if I didn’t already own it?” (especially if its in a non-taxable account).

Maybe this is obvious to you all, and writing it out it sounds obvious to me, but until now I haven’t actually done this. For instance, I bought Coinbase stock at their IPO because I thought it would trade up given the then-ongoing crypto / meme stock mania. I was correct in that the $250 IPO started trading over $300 immediately; but then I just held on for years while it fell, fell, fell to below $100. The key difference I’m trying to get at here is the one between ideas and execution: its not that I thought Coinbase had such good fundamentals that it was a good long term buy at $250 and my idea was wrong; instead I had a correct short-term idea of what would happen after the IPO, but incorrectly executed it as if it were a long-term idea (mostly through inertia, not paying attention, and not putting in an immediate limit sell order at a target price after buying).

So if you buy stocks for short- or medium-term reasons, it makes sense to periodically think about which to sell. I’ll show how I I think about this by going through some examples from my own current portfolio below (after the jump because I think the general point above is much more important that my thinking on any specific stock, which by the way is definitely not investment advice):

Continue reading

80% Efficient Markets: Why I Buy Individual Stocks

The conventional wisdom among economists is that large, liquid asset markets like the US stock market are incredibly informationally efficient. The Efficient Market Hypothesis (EMH) means that these markets near-instantly incorporate all publicly available information, making future prices essentially impossible to predict (a random walk with drift). As a result, economists’ investment advice is that you shouldn’t try to beat the market, because its impossible except through luck; instead you should aim to tie the market by owning most all of it via diversified low-fee index funds (e.g. SPY or VT).

This idea usually sounds crazy when people first hear it, but it works surprisingly well. You’d think that at least half of participants would beat the market average each year, but active strategies can generate such high fees that its actually much less than that. Further, people who beat the market one year aren’t more likely than average to beat it the next, suggesting that their winning year was luck rather than skill. Even Warren Buffet, who economists will sometimes concede is an exception to this rule, thinks that it is best for the vast majority of people to behave as if the EMH is true:

In 2008, Warren Buffett issued a challenge to the hedge fund industry, which in his view charged exorbitant fees that the funds’ performances couldn’t justify. Protégé Partners LLC accepted, and the two parties placed a million-dollar bet.

Buffett has won the bet, Ted Seides wrote in a Bloomberg op-ed in May. The Protégé co-founder, who left in the fund in 2015, conceded defeat ahead of the contest’s scheduled wrap-up on December 31, 2017, writing, “for all intents and purposes, the game is over. I lost.”

Buffett’s ultimately successful contention was that, including fees, costs and expenses, an S&P 500 index fund would outperform a hand-picked portfolio of hedge funds over 10 years. The bet pit two basic investing philosophies against each other: passive and active investing.

This has been the approach I’ve taken for most of my life, but over the last 3 years I’ve gone from ~99% believing in efficient markets to perhaps ~80%. Missing on crypto felt forgivable, since it was so new and unusual; I recognized that in the early days of a small, illiquid market the EMH might not apply, I just misjudged what counted as “early days” (I figured that by 2011 “everyone” knew about it because Bitcoin had been discussed on Econtalk; its up ~1000x since).

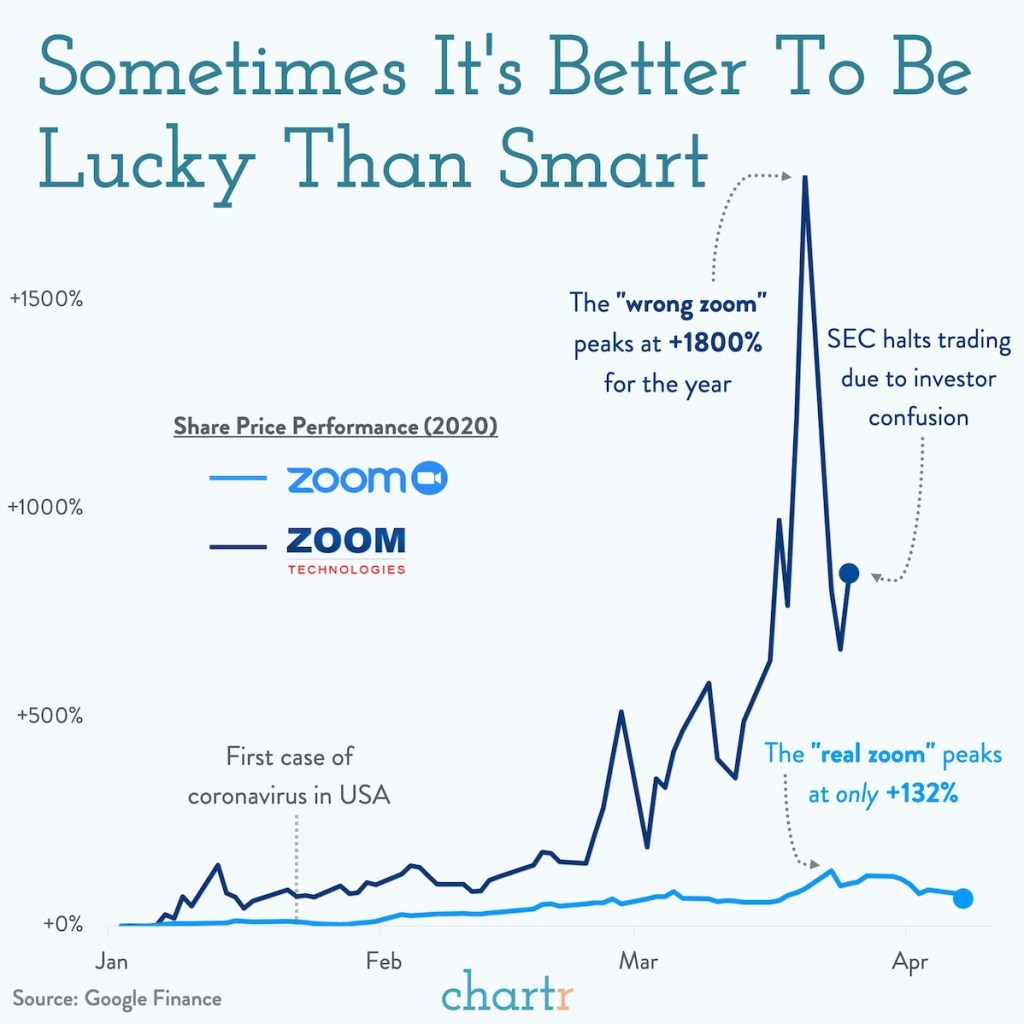
But with the Covid era the anomalies just kept piling up. All through February 2020, the smart people on Twitter were increasingly convincing me that this would be a huge pandemic; the main thing reassuring me was that stocks were up. But by late February they finally started crashing; instead of trusting the markets, I apparently should have trusted my own judgement and bought puts. Then investors starting buying the “wrong” Zoom instead of the one whose business benefitted from Covid:

Then we saw “meme stock mania” with many stocks spiking for reasons clearly unconnected with their fundamental value. Many at Wall Street Bets were clear that they were buying not because of business fundamentals, or even because they thought the price would go up, but because they liked the company, or wanted to be part of a movement, or wanted to send a message, or “own the shorts”.

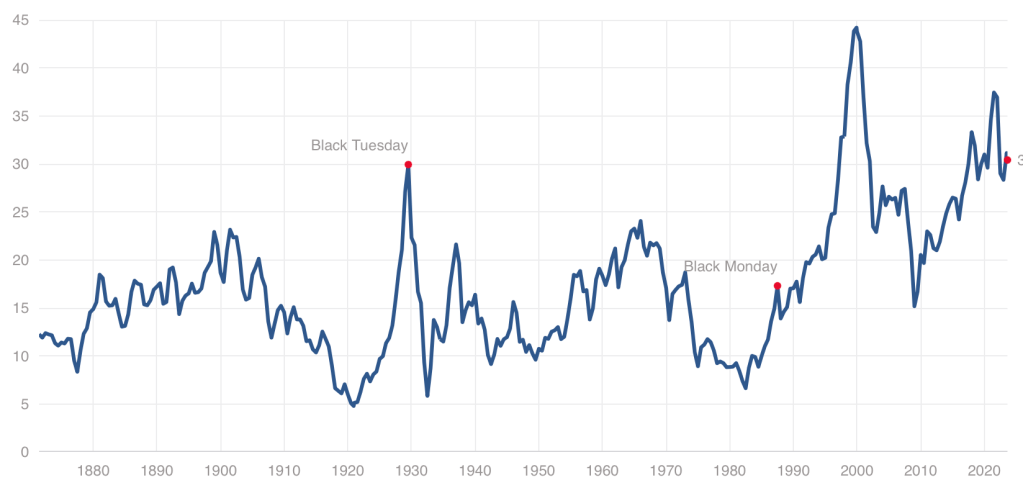
Anecdotes got me to start taking some of the anti-EMH economics literature more seriously. For instance, Robert Shiller’s work showing that while it might be near-impossible to predict what a single stock will do tomorrow better than chance, predicting what the overall market will do over the longer run is often possible.

By revealed preference, is still mostly buy the EMH. About 80% of my net worth (not counting my home) is in diversified low-fee index funds. But that means 20% isn’t; its in individual stocks or actively traded ETFs with more-than-minimal fees. Why do this? I see 4 reasons buying individual stocks isn’t crazy:

  1. Free trading: Buying a bunch of individual stocks used to incur huge fees. Now, many brokerages offer free trading. Even if the EMH is true, buying a bunch of individual stocks won’t lose me money on average, just time.
  2. Still diversified: Buying into active funds instead of passive ones does tend to mean higher fees, and that is a real concern, but they do still tend to be quite diversified. Even buying individual stocks can leave you plenty diversified if you buy enough of them. Right now I hold about 45, with none representing more than 0.5% of my portfolio; one of them going bankrupt causes no problems. If anything I’m starting to feel over-diversified, and that I should concentrate more on my highest-conviction bets.
  3. Learning: Given the above, even if the EMH is 100% true, my monetary losses due to fees and under-diversification will be tiny. The more significant cost is to my time- time spent paying attention to markets and trading. This is a real cost, enough that I think anyone who finds this stuff boring or unpleasant really should take the conventional econ advice of putting their money in a diversified low-fee index fund and forgetting about it. But I’m starting to find financial markets interesting, and I think keeping up with markets is a great way to learn about the real economy- they always suggest questions about why some companies, sectors, factors, or countries are outperforming others. In some EMH models, the return to trading isn’t zero, but instead is just high enough to compensate traders for their time. In this case, people who find markets interesting have a comparative advantage in trading.
  4. Outperforming Through New Information: All but the strongest version of the EMH suggests that those with “private information” can outperform the market. Reading about the very top hedge funds I think they really are good rather than lucky, and the reason is that they have information that others don’t. Sometimes this is better models but often it is simply better data; Jim Simons got historical data on markets at a frequency that no one else had, and analyzed it with supercomputers no one else had. That’s a genuine information advantage, and I don’t think it’s a coincidence that he wound up with tens of billions of dollars. This should be incredibly encouraging to academics. We can’t all be Jim Simons (who was a math professor and codebreaker before starting Renaissance Technologies; Ed Thorpe was another math prof who got rich in markets), but discovering and creating private information is exactly what we do all day as researchers. My hard drive and my head are full of “private information” that others can’t trade on; of course right now most of it is about things like “how certificate of need laws affect self-employment” that have no obvious connection to asset prices, and there is a lot more competition from people trying to figure out markets than from people trying to figure out health economics. But discovering new information that no one else knows is not only possible, it is almost routine for academics, and its not crazy to think this can lead to outperforming the market.

Overall I think economists have gone a bit too far talking themselves and others out of the idea that they could possibly beat the market. I’ll discuss some more specific ideas in the next few weeks, but for now I leave you with 3 big ideas: you can’t win if you don’t try; winning is in fact possible; and if you are smart about it (avoid leverage, options, concentration) then defeat is not that costly.

Disclaimer: This is not investment advice. I say this both as a legal CYA, and because I don’t (yet?) have the track record to back up my big talk

Chapman University Economic Forecast Update 2023

I watched the Chapman Economic Forecast Update for 2023 live on June 22 (you can watch the whole thing free here). Go to their website for free videos and links. They have an excellent track record for being correct.

This time, Dr. Jim Doti believes we are headed for a recession by the third quarter of 2023 or at least what he conservatively calls a “slowdown”. He hates to make dramatic predictions or deliver bad news, but he saw the inflation brewing back in 2021, and I remember him correctly predicting what was to come.

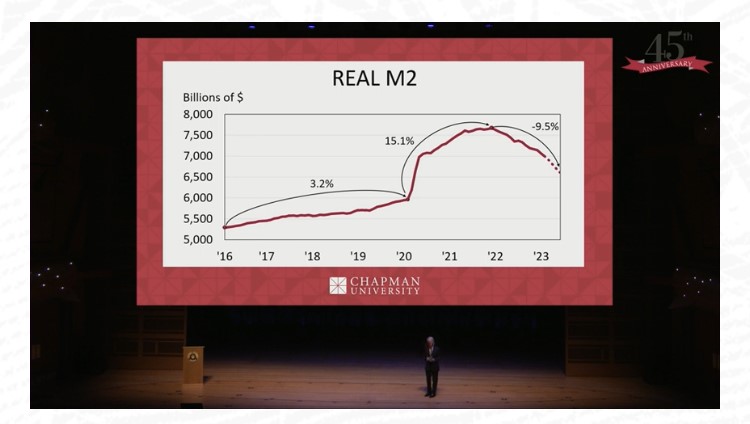
For one thing, the dramatic growth in the money supply at the beginning of the pandemic has been corrected into a sharp contraction of the money supply.

People have been joking about how the recession isn’t happening.

We’ll see who’s laughing in 2024.

The middle segment of the forecast, which I recommend watching, is about investing. Fadel Lawandy cautions that stocks are not a good bet right now, with a likely recession looming.

The third segment is focused on the economy of California. I didn’t finish that part, since I don’t live there anymore.

A Surprisingly Good Year for Homebuilders

The Federal Reserve has been increasing interest rates at the fastest pace since the 1980’s, from near-zero rates in March of last year to over 5% today. This has led to rapid slowdowns in interest-rate sensitive sectors like housing, cars, and startups. Because most people finance their home buying, higher interest rates mean higher monthly payments for a house at a given price. Since many people were already buying houses near the highest monthly payment banks would allow them to, higher interest rates mean they need to buy cheaper houses or just stay out of the market and rent. This is especially true as the interest expense on mortgages has tripled in two years:

Source: Jeff Weniger

You’d think this would be bad news for homebuilders, and for most of 2022 markets agreed: homebuilder stocks fell 36% from the beginning of 2022 to September 2022 after the Fed started raising rates in March. But homebuilder stocks have recovered since September, with some major names like D.R. Horton and Lennar hitting all time highs. Why?

I bought homebuilder stocks in January but I have to say even I wasn’t expecting such a fast recovery (if I had, I would have bought a lot more). I was buying because they were cheap on a price to earnings basis and temporarily out of fashion; I love stocks that are priced like they’re in a secular decline to bankruptcy when its clear they are actually just having a bad cycle and will recover when it turns. But I thought I’d have to wait years for falling interest rates and a recovering housing market for this to happen. Instead these are up 20-100% in 6 months. Why?

The big thing I missed was that high interest rates have hit their competition harder, reducing supply as well as demand. Who is the competition for homebuilders? Existing homeowners. Homeowners with the “golden handcuffs” of a 3% mortgage who don’t want to move if it means switching to a 7% mortgage. I’m seeing this personally in Rhode Island- I’d kind of like a house with a bigger yard on a quieter street, but there are only 5 houses for sale in my whole school district. Between that and interest rates, we’re staying put. But for people who really need to move, new homes are making up a record proportion of the available inventory:

Source: Jeff Weniger

This situation seems likely to persist for at least months, and possibly years. The Fed paused its rate hikes yesterday for the first time since last March, but indicated that more hikes may lie ahead. I’m tempted to take the win and sell homebuilder stocks, but they still have price to earnings ratios under 10, and the “golden handcuffs” on their competition seem likely to stay on for at least another year.

Analysts’ Systematic Bias Makes Companies “Beating Estimates” Fairly Meaningless

A corporate tale

Once upon a time I was enrolled in a project economics training workshop at a certain unnamed (but generally honest) S&P 500 company, taught by a finance guy from corporate. We got on the subject of making assumptions. The planner knew he was among fact-friendly engineers, not corporate toadies, so he unguardedly told us a story. He was part of a team of young up and coming managers who (as often happened at that stage in their career track) were thrown together in a planning role. They were tasked with coming up with a plan for the upcoming year for I think some large division of the company. They worked hard and put their most realistic assumptions into the plan, and found that, as a result of market shifts beyond our control, next year’s earnings were going to decline slightly.

When they presented this result to management, they were told, “No, go back and bring us a plan for how we are going to grow earnings by [say] 8% next year.” The quick-witted young planners got the message and went back and tweaked their assumptions until they got earnings to grow the required amount. They weren’t exactly lying, but they all knew their “plan” was not straight down the middle realistic. However, the managers were happy, and that was what mattered. Such is the corporate mindset. If analysts or planners want to succeed in their careers, they have to produce what is desired by the layers above.

Earnings “beats” are often pointless

According to FactSet, with the vast majority of S&P 500 companies having reported their first quarter (Q1 2023) earnings, 78% of them reported actual earnings per share (EPS) above the mean average of analysts’ estimates. So nearly 80% of companies “beat estimates”. Woo hoo! What a great quarter for earnings!

But… the actual S&P 500 earnings declined by  2.1% from the previous (actual) earnings. Hmm, maybe not such a great quarter after all. And this is on top of a decline in the previous quarter, as well. But nobody talks about that.

This is another example of the systematic bias in “earnings estimates”, which makes the quarterly hurrahs over “beating” estimates somewhat silly. We have complained about this earlier. Here is the problem: most published analysts are employed by investment banks or similar “sell-side” institutions which are always courting the favor of large companies, since they want the companies to do business with them. What sorts of earnings estimates do the corporate brass want to see?

Well, for earnings that are due to be reported a year or more in the future, they want to see high estimates, which would justify high stock prices now. And for earnings that are due to be reported in a few weeks, the managers want to see low estimates, which they can then (tah-dah!) “beat.” And so, we see a reliable pattern of analysts starting with unrealistically high estimates, and then ratcheting down, down, down in the year before the actual reporting date.

Bring on the charts

A recent article by Seeking Alpha author Lance Roberts illustrates some of these trends. I pulled a couple of his charts here. First, here is a plot showing the decline in Q1 2023 estimates over the past 18 months or so, as analysts do their usual dance:

The blue line in the figure below shows the percentage of S&P 500 companies which “beat” their final (lowered) estimates. If the estimates were fair and unbiased, we would expect this number to be around 50%. In fact, in the past decade it has been around 70%, and growing with time.

Earnings beats or misses do get headlines and contribute to near-term stock price moves, but from a fundamental point of view there is more sizzle than steak here.

Historical Price to Earnings Ratios By Industry

Getting long-run historical PE ratios of US stocks by industry seems like the kind of thing that should be easy, but is not. At least, I searched for an hour on Google, ChatGPT, and Bing AI to no avail.

I eventually got monthly median PEs for the Fama French 49 industries back to 1970 from a proprietary database. I share two key stats here: the average of median monthly industry PE 1970-2022, and the most recent data point from late 2022.

IndustryLong Run MeanEnd 2022
AERO12.1419.49
AGRIC10.759.64
AUTOS9.6517.52
BANKS10.3810.46
BEER15.2335.70
BLDMT12.0015.41
BOOKS12.9517.60
BOXES12.1810.69
BUSSV12.0713.03
CHEMS12.4019.26
CHIPS10.4817.47
CLTHS11.4510.94
CNSTR8.984.58
COAL8.042.92
DRUGS1.148.01
ELCEQ10.7817.85
FABPR10.2819.40
FIN11.1612.97
FOOD14.3025.03
FUN9.1021.06
GOLD3.18-5.95
GUNS11.505.05
HARDW7.9619.16
HLTH11.916.09
HSHLD12.6020.15
INSUR10.9516.33
LABEQ13.4625.18
MACH12.5120.27
MEALS13.8319.19
MEDEQ6.8127.64
MINES8.0616.27
OIL6.969.00
OTHER12.2027.68
PAPER12.5016.69
PERSV12.86-0.65
RLEST8.13-0.30
RTAIL12.268.58
RUBBR12.1112.81
SHIPS9.7917.42
SMOKE11.7417.79
SODA12.3832.09
SOFTW8.21-2.85
STEEL8.184.30
TELCM6.759.58
TOYS9.18-1.32
TRANS11.2513.11
TXTLS9.43-49.00
UTIL12.3417.41
WHLSL11.0813.13
Mean Industry Median10.5212.73

One obvious idea for what to do with this is to invest in industries that are well below their historical price, and avoid industries that are above it (not investment advice). Looking just at current PEs is ok, but a stock with a PE of 8 isn’t necessarily a good value if its in an industry that typically has PEs of 6.

By this metric, what looks overvalued? Money-losing industries (negative current earnings): Gold, Personal Services, Real Estate, Software, Toys, and Textiles. Making money but valuations 19+ above historical average: Medical Equipment, Beer, Soda. Most undervalued relative to history: Guns, Health, Coal, Construction, Steel, Retail (all 3+ below the historical average).

Of course, I don’t recommend blindly investing in these “undervalued” industries- not just for legal reasons, but because sometimes the market prices them low for a reason- that earnings are expected to fall. The industry may be in secular decline due to new types of competition (coal, steel, retail). Or investors may expect it to get hit with a big cyclical decline in an upcoming recession or rotation from the Covid goods/manufacturing economy back to services (guns, construction, steel, retail). Health services (as opposed to drugs and medical equipment) stands out here as the sector where I don’t see what is driving it to trade at barely half of its usual PE.

I’d still like to get data on long run market-cap weighted mean PE by industry, as opposed to the medians I show here. The best public page I found is Aswath Damodaran’s data page, which has a wide variety of statistics back to about 1999. Some of the current PEs he calculates are quite different from those in my source, another reason to tread carefully here. I’m not sure how much of this is mean vs median and how much is driven by different classification of which stocks fit in which industry category.

This gets at a big question for anyone trying to actually trade on this- do you buy single stocks, or industry ETFs? Industry ETFs make sense in principle (since we’re talking about industry level PEs overall) and also add built-in diversification. But the PE for the ETF’s basket of stocks likely differs from that of the industry as a whole. It would make more sense to compare the ETF’s current PE to its own historical PE, but most industry ETFs have very short track records (nothing close to the 53 years I show here). PE is also far from the only valuation metric worth considering.

All this gets complex fast but I hope the historical PE ratio by industry makes for a helpful start.

EWED Highlights: Investing

I noticed that finance and investing have become one of our recurring themes here, and so I recently added an investing category for our posts.

Posts from before last week weren’t tagged with it, but I’ll take the chance now to highlight some of our investing posts:

Alternative Investing Ideas:

Is Equity Crowdfunding Beating Adverse Selection?

Potent Portfolio Diversifier: Managed Futures Funds Go Up When Both Stocks and Bonds Go Down

Series 65 for Economists

Unfashionable Investing

50% Endowment Returns Driven by Private Equity Investments: How Rich Universities Get Richer (But You Can, Too)

Safer / Yield-Based Investing Ideas:

Tough Year for Investing (with one little-known, totally safe exception)

Get Easy Government-Guaranteed 4% Interest on Your Money with Treasury Bills

High Yield Investments, 1: Some Benefits of High Yield Stocks and Funds

High Yield Investing, 2: Types of Funds; Loan Funds; Preferred Stocks

Posts on Economic Conditions Affecting Financial Markets:

Work From Home Sours Financing for Office Buildings, Which Threatens Regional Banks

Bulls and Bears Spar Over Pace of Inflation Decline and Rate Cuts

A Cornucopia of Financial Data from J. P. Morgan, Relevant to Investors

Raging Inflation, Spiking Rates, Plunging Stocks, Oh, My!

QE, Stock Prices, and TINA

Crypto Posts:

Bitcoin’s Dramatic Comeback: Resurrection or Dead Cat Bounce?

The Great Crypto Market Meltdown of 2022

The NFT Market Is Mushrooming – Why??

Crypto Drama: $40 Billon Vaporized as Terra “Stablecoin” and Luna Implode; Bored Ape NFTs Break Ethereum

On Famous Investors:

Get rich or get famous? Edward Thorp vs Myron Scholes

Warren Buffett’s Secret Sauce: Investing the Insurance “Float”

Big Picture / Economics of Investing:

What kind of return do we want on our investment?

Though the Market Is a Winner, Most Stocks Are Losers

Minor Investment

Dow 1,000,000?

Avoiding Intertemporal Idiosyncratic Risk

Social Security: Not a Great/Terrible Investment

Drivers of Financial Bubbles: Addicts and Enablers

Why Short Selling Is a Good Thing for the Stock Market and Investors Large and Small

Carl Icahn Under Siege: The Predator Becomes the Prey

The term “investing legend” gets thrown around a lot, but in the case of Carl Icahn, it truly fits. He kicked off the modern era of corporate raiding by taking influential stakes in many companies and forcing changes to his personal advantage. In some cases (e.g., Trans World Airlines) this involved taking over and dismembering the firm, and selling off the pieces. He is considered by some measures to be the most successful “activist” investor ever. His personal wealth is (or was) on the order of $20 billion.

Icahn has rolled much of his personal holdings into a limited partnership called Icahn Enterprise L.P.  (IEP).  According to its blurb, “…Icahn Enterprises L.P., through its subsidiaries, operates in investment, energy, automotive, food packaging, real estate, home fashion, and pharma businesses in the United States and Internationally.” This partnership structure allows Icahn to cleverly avoid paying income taxes on the earnings from his enterprises. Another score for the old wolf.

This arrangement has also allowed us mere mortals to nibble on the crumbs from his table. IEP has paid a very large and growing dividend for more than ten years. Since 2019 it has paid $ 8.00 per year ($2.00 per quarter). This generous payout has made it popular among retail investors and has kept the price of IEP steady in the $50-$55 range for a number of years. This gives around a 15% yield.

It has always been understood that IEP does not actually generate enough cash to pay out $2.00 per quarter on every share, but since “Uncle Carl” owns some 82% of the shares and takes all his dividends in stock (again, to beat the taxman), it has all worked out. That is, until the past month, when IEP was the target of a “short attack” by the ominously-named Hindenburg Research. A short attack is when some outfit takes a short position in a stock, then publishes a report claiming all sorts of misrepresentation and malfeasance on the part of management, to scare the public into dumping the stock. The attacker pockets a tidy profit on their short position when the stock price tanks. Then on to the next victim.

Often, there is not much actual substance to a short attack, but in the case of IEP Hindenburg had something of a real case. Their claim is that the actual net asset value (NAV) of IEP is way, way below $50 / share, and even lower than the NAV officially reported by IEP. Hindenburg made lots and lots of other dire accusations, describing IEP’s operation as a giant Ponzi scheme. Ouch.  Also, it seems Icahn has actually lost his mojo in the past decade (he is 87), making several market bets that went sour and lost billions. Anyway, some of Icahn’s old victims are not sorry to see the former shark being mauled by tactics similar to those he once employed.

The IEP stock price quickly dropped from 50 to 30 when the short report came out, then rallied back to about 36 after Icahn gamely announced that the usual $2.00 dividend was still going to be paid (stock chart below). That is where I sold about half my IEP shares to de-risk my position (disclosure: I had bought a very small amount before the Hindenburg report).  The price then meandered around in the low 30’s for a couple of weeks, then started to slide down again.

Share price for Icahn Enterprises L.P. (IEP). Source: Seeking Alpha.

Icahn made numerous enemies in his career, including fellow corporate raider Bill Ackman. Icahn went very long on a company (Herbalife) that Ackman was heavily shorting, back in the day. One YouTube you can listen to a 2014 CNBC show where they had both called in, where they were hurling very personal insults at each other on the air.  Ackman recently piled onto the short thesis for IEP, tweeting that even after the recent fall in price, the shares were still overvalued by at least 50%. IEP shares promptly plunged another 14%, to under $20.  Icahn’s response: “Taking advice from Ackman concerning short selling is like taking advice from Napoleon or the German General Staff on how to invade Russia.”  Some things don’t change.

Music Rights Are Surprisingly Cheap and Easy to Buy

When music rights make the news, it’s generally because a superstar’s entire catalog is selling for hundreds of millions of dollars. That may be why I always assumed that buying music rights would be difficult and expensive- that you’d both have to know the right people to even hear about potential deals, and have to be quite rich to afford them.

But this week I found out about Royalty Exchange, a site that currently lists hundreds of music rights for sale. They certainly appear to make the process of finding and buying rights, and collecting royalties, easy (I haven’t bought any yet so can’t say for sure). They currently list songs and partial catalogs from all sorts of artists you’ve heard of:

When I say I find many listings to be surprisingly cheap, I mean this relative to the hundred million dollar deals you hear about. Of those that offer a list price (as opposed to simply asking for offers), the vast majority are over $10,000, and many are over $100,000. Overall I’d put it in the “luxury car” bucket- expensive enough that its a bad idea for a normal middle-class person to buy one, but cheap enough that they could if they really wanted to. It’s a bit of a better idea than a luxury car, since its more investment than consumption. But if I actually bought the Flogging Molly catalog like I want to, I’d be taking an unnecessary risk by putting a large proportion of my net worth in a single investment. Their music is great and I think it will maintain its popularity, but if I’m wrong and people stop listening to it I’d lose out. So, for most people it’s a bad idea in the same way that putting half your retirement account into a single company’s stock is bad idea. But I’m surprised its even possible.

Why are these rights so affordable? Sometimes, of course, its because the artist isn’t that popular. But why are the rights to songs and musicians that are household names affordable? It seems to mainly be because the rights have been sliced and diced so that you’re only buying a small piece of them. Consider Miley Cyrus above. First of all its only the rights to one of her songs (admittedly a hit song). Second, you’re only buying the rights for ten years (lifetime rights are sometimes available but naturally they cost more). Finally, you’re only buying some of the rights, in this case the right to get paid when someone publicly performs the song (but not when someone streams it or buys a copy):

Even given all that though, I’m surprised how cheap the rights are. I expected that people would overpay for them because they like an artist, or for the bragging rights. But the yields seem pretty reasonable, often over 10%. Yields could rise or fall over time as an artist becomes more or less popular, or as the economics of the music industry change, but current prices generally seem justified by the income stream. I look forward to having enough money that this could make sense as an investment for me; I expect I might in 10 or 20 years, but maybe some of you are already there.

The cheapest listing from an artist I’ve heard of, Busta Rhymes (only performance rights, only certain tracks)