The American Community Survey (ACS) collects information on how many times people have been married. Using the 2024 ACS, we can see how that changes across ages. Getting married is what we call an absorbing state. Once you get married once, you’ll never be married zero times again. So long as people get married across the age distribution, the proportion of never married people falls.
The same is true for getting married a 2nd time. Then, you’ll never have been married once ever again. While the proportion of people never married must shrink over time, the proportion of people married once can rise. If a few people get married a 2nd time, but an even bigger number of people get marred for the first time, then the group of people married only once can grow. The ACS stops measuring once someone has been married three times – then it’s “three or more” times. That’s the universal absorbing state. Those people never go into another category.
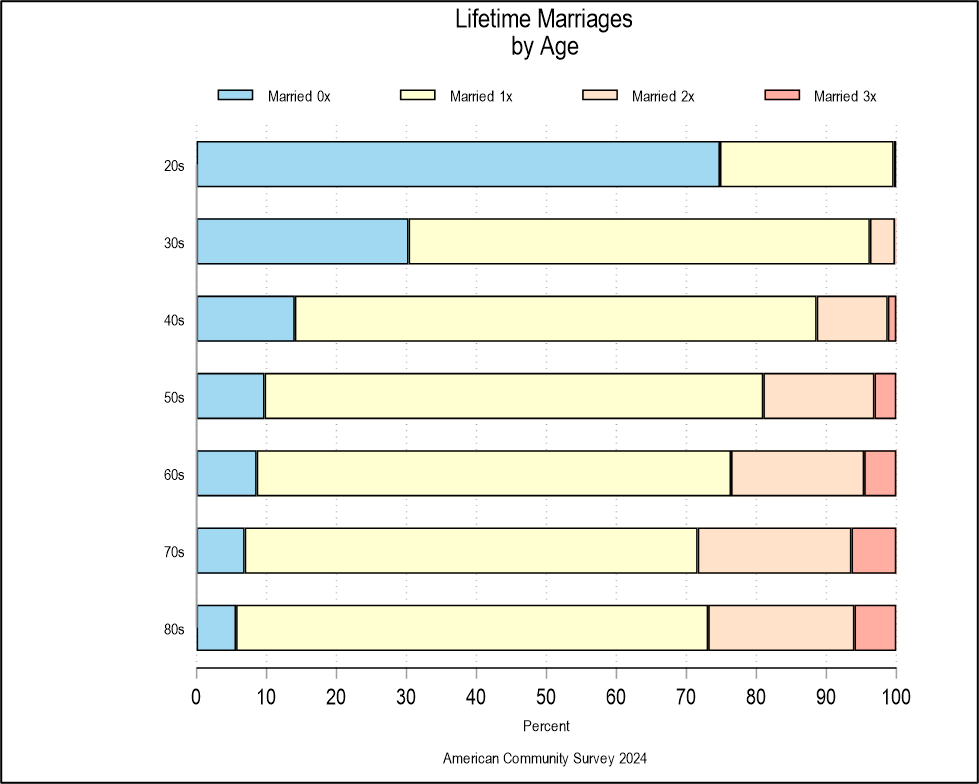
The chart shows the proportion of people by age and the number of times that they’ve been married. Importantly, this is the snapshot in 2024. So each age group is a cohort snapshot in time. That’s why the proportion of people in their 80s who’ve been married zero or one time is greater than people in their 70s. They’re a different cohort. When the now 80-year-olds were in their 70s, the sum of the yellow and blue bars were larger than for more recent 70-year-olds.
A favorite pass time of economists is to think about the theoretical mechanism by which social outcomes occur. We tend to enjoy the spit-balling and thinking about the potential causes. When a proposed mechanism turns out to be unimportant, the data should be a bit random looking.
For example, let’s consider people in 70 and older to be near the end of their life. So, that group of older people can give us a good idea of the terminal distribution of how many times people get married. About 6% of people never marry, 66% get married once, 21% get married twice, and 6% get married 3+ times.
Being married only once implies a certain amount of relational stability. Those people may have stayed married for a long time, or stayed unmarried for a long time, or both. Stability may not be the right word for when someone is unmarried, but it certainly avoids a degree of additional legal complication, for better or worse, that exists for married people.
With these ideas in the back of our heads, which college majors would you expect to have the more people with many versus fewer lifetime marriages? We know that there is some selection into college majors and reason to think that people differ post graduation, so we should be able to spitball about how college major is related to lifetime marriage frequency.
Below is the graph for the 25 most popular college majors held by people ages 70+. The trick is that any group can be sorted by number of marriages. And almost any result would look striking just due to differences caused by noise. But, if there is any pattern among types of college majors and marriage counts, then that implies that a relationship between major and marriage may exist.
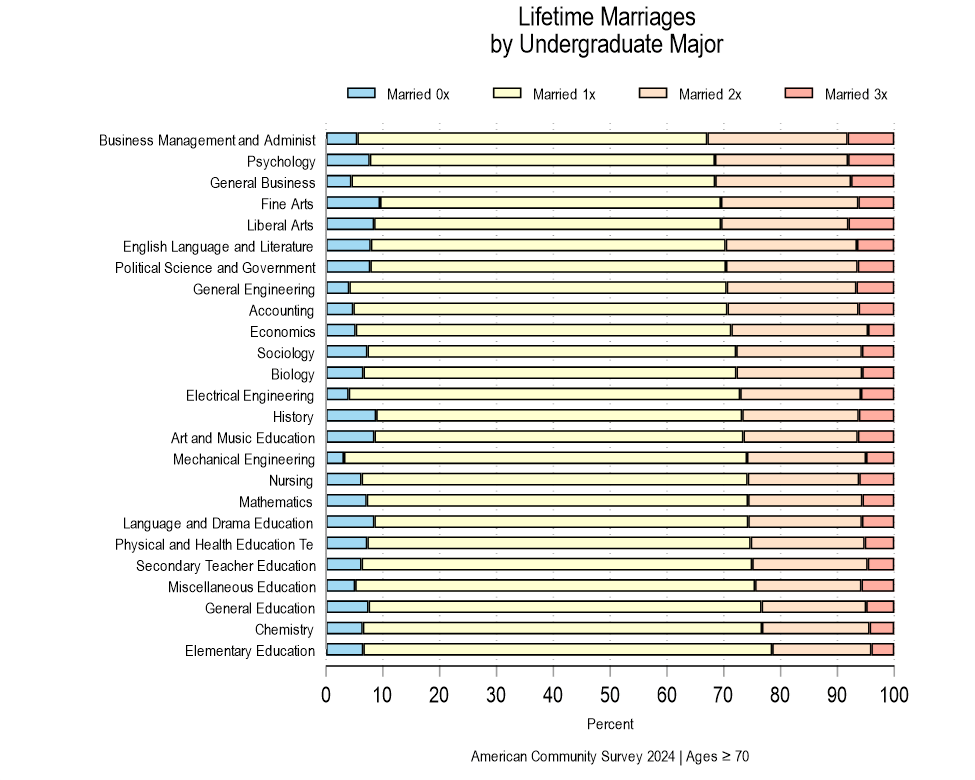
Most people have multiple consecutive spouses due to divorce rather than due to spousal death. So, generally, more marriages implies more divorces. So, which college majors tend to be more stable, either in or out of a marriage? The least stable majors are at the top, and most stable are at the bottom. The most stable majors are dominated by education degrees. The seven most stable majors are in some sort of education with elementary education leading the pack for fewest marriages.
Those differences don’t look large, but let’s think about pieces of the categories rather than the entire population. Look at the major with the most marriages, “Business Administration”. Among them 94.5% have had a first marriage. 32.9% of them have had a second marriage. Therefore 34.8% of people who have ever been married proceeded to have at least a 2nd marriage, if not a third. Since there are two business majors in the top 3, I’m willing to call that a thing.
The other college majors with more marriages are ones that I’d broadly characterize by people who have a lot of ‘feelings’. These include psychology, fine arts, liberal arts, and English. Art and Music Education majors are near the middle of the distribution, as if they are characterized by ‘feelings’ and whatever it is among education majors that makes them relatively stable partners or stable divorcees. Though, one commonality that all ‘arts’ majors share is that they have high rates of never married people. Majors in the middle of the y-axis exhibit less of a pattern.
Personally, I’m struck by how many people have had 3+ marriages. If you think that the number of 1-marriage people is high, then keep in mind that general pattern nationally is that high-education individuals tend to divorce at lower rates – and this sample is only among those with at least a bachelor’s degree.

