This book describes the development of intellectual life and related events in Scotland from about 1700 onward. Scotland in 1700 was a small, poor, largely agrarian independent nation, still characterized in large part by feudalism. In much of the country, clansmen in their kilts constantly robbed and fought each other. By 1800, it was an economically thriving section of the United Kingdom of Great Britain, and a huge contributor to modern thought on many levels. The subtitle on the front jacket of the book expansively portrays its contents as: “The True Story of How Western Europe’s Poorest Nation Created Our World & Everything in It”.
A key event which helped launch this flowering was an economic one. The 1690’s were an unusually cold decade, leading to famine and poverty in the more northern European countries like Scotland. Scottish trade and industry were constricted by the policies of England, their more powerful neighbor to the south. Other nations of Western Europe in the 1600’s had colonies in the Americas, which seemed to be a source of national wealth and influence. Scotland tried to found her own colony, called Darien, on the coast of the Isthmus of Panama. A huge fraction of the wealth of Scotland was invested in this venture. It failed, for various reasons, which was an economic disaster for the country.
This led to a willingness on the part of the Scottish elite to surrender their independence in return for the chance to participate in commerce on the same terms as the English and under the protection of the Royal Navy. An Act of Union between the two kingdoms was approved in 1707. This led to a rise in prosperity and helped set in motion various influences of modernization.
A lively intellectual life in the burgeoning cities of the Scottish lowlands put Scotland at the forefront of the 18th century enlightenment. The Scottish Enlightenment was more practical and aligned with common sense than was the Enlightenment of the French philosophes. David Hume and Adam Smith are just two of the significant Scottish thinkers of this era. The works of Hume and of Smith (e.g. The Wealth of Nations) are still required reading today in the fields of philosophy and of economics.
Scots likewise made great contributions to science and technology. Today we measure power in terms of “watts”, a tribute to James Watt, whose improvements to steam engines made them finally practical for widespread use. We drive on “macadam” roads, initially developed by John McAdam.
How theScots Invented the Modern World weaves all these themes together, going into enough detail with key actors to make them come alive as real persons. Since there are so many books and so little time, I rarely go back and reread a book. Also, I ruthlessly pruned my collection as part of our recent household interstate move. But I have found myself picking up this volume from time to time, and so it survived the cut. I recommend it as an entertaining and enlightening read.
The big news in our world is that the Nobel Prize was announced today for economists. (We call it “the Nobel Prize”.)
Paul Milgrom and Robert Wilson win for 2020. They are known for auction theory and design. Here is a popular introduction from the Nobel Committee.
This prize is special to me because auction design was one of the very first practical problems that presented me with a chance to put economic ideas into practice. As an undergraduate at Chapman University, I had the privilege to spend time talking with people like Vernon Smith and Dave Porter. Some people think of Vernon Smith as being someone who “does things in the lab”. The thing that he actually did was often auctions.
My master’s thesis at Chapman University was a project on auctions. A practical problem to motived our inquiry. Students at Chapman were upset about the way that the most convenient parking spots were allocated. Concerns about parking showed up in quantitative student satisfaction surveys.
We designed an auction to price and allocate the most coveted parking spots. In this scenario, multiple items are being sold because the parking lot has many spots. Hence the “multi-unit” in the title of our paper Information Effects in Uniform Price Multi‐Unit Dutch Auctions.
We had an important question, since we were actually going to run an auction that would affect people’s lives. How to we choose from among the different possible auction formats?
Paul Milgrom (with Robert J. Weber) provided guidance to us in their 1982 paper in Econometrica.
Among other things, in that paper, they compare the revenue properties of English auctions and Dutch auctions. In an English auction, the price starts low and bidders compete to out-bid each other until the price is so high that only one bidder remains. That is the popular conception of an auction. There is another mechanism class (Dutch) in which the price starts higher than anyone wants to pay and drops until a buyer jumps in. Once you start thinking about how many ways one could run an auction, then you need some way to decide between all the mechanisms.
Theory can help you predict who will be better off under different formats. And, in my case, needing to figure out the revenue properties of different auction formats can help you learn economic theory!
The presidential debate on September 29, 2020 was an embarrassment. I don’t remember what the candidates said because I just kept panicking thinking about the fact that other people could see what was happening. Didn’t some adult somewhere have a kill switch?
After an hour of listening, I expressed my sincere wish that this had never happened:
It’s not just true in America. Much of what passes for “debate” is just people firing off talking points at each other. Usually it’s not quite so obvious and awkward because there are not such clear rules being broken.
If there’s one thing that Americans agree on, it’s that you wait your turn in line. This is the most basic schoolyard etiquette. No matter how rich or famous you are, cutting in line is deeply resented. It felt like President Trump was not taking turns (so then it was strange for me to fact check this and see that Biden spoke only 2 minutes less total than President Trump).
If it were in my power to undo that night I would. However, a new podcast gave me some more to ponder about in terms of what Americans can be proud of. A lot of true news comes out about Americans making mistakes. That can be useful for others. Audrey Tang said of our misdeeds:
COWEN: … the United States, has made … many mistakes … What’s our deeper failing behind all those mistakes?
TANG: I don’t know. Isn’t America this grand experiment to keep making mistakes and correcting them in the open and share it with the world? That’s the American experiment.
Being open about our mistakes might be the next best thing to not making them in the first place.
Tang, a transgender Taiwanese computer policy expert, said something that I think Americans can be happy about.
Speaking of software, here’s a recent conversation with a 5 year old about what exactly is software and what does it mean to buy it. My son imagined that if I bought it in a store I must have picked something up off a shelf. (I could have explained that software is a nonrival good, but I think it’s too soon.)
Consider the AD-AS model which is often expressed in growth rates. Economists will often say that the short-run supply curve is flatter in the short-run and vertical in the long-run. In other words, aggregate demand policy can have SR output effects, and only has LR price effects. Sounds good.
But there is a lot of baggage hiding behind “can have effects”. Often we’ll say that lackadaisical businesses cause a flatter SRS and that businesses with rational expectations have a vertical one. Also sounds good.
What causes the steepness of the SR supply curve? I’m sure that there are multiple determinants in regard to expectations. Here’s what got me on this topic. David Andolfatto shared the below graph and asked “Does lowflation necessarily mean low growth?”.
Good question. My answer includes expectations concerning the monetary policy regime. Specifically, my answer was “It does in a regime of volatile and uncertain nominal income. Surprise AD growth pushes us up the SRAS.” Andolfatto called me out and in the right way, asking “What’s the evidences for this?”
I had no evidence. I had the AS-AD model in hand and some logic – but no evidence. My logic is as follows. In a monetary regime that includes a constant rate of AD growth, output and price growth are inversely correlated. If NGDP grows at 5% always, then inflation falls when output growth rises. In other words, AD is exactly what people expect – illustrated as a vertical SRAS curve.
However, expectations are different in a regime of erratic AD. Let’s say that the rate of AD growth is unknown, but that the variance is known. If this is the world that you live in, then you make hay when the sun shines. Businesses sell more in periods of higher income. And, because they’re marching up the marginal cost curve, prices also rise. Alternatively, it may be that output growth is inflexible and prices rise as a goods are rationed.
Regardless of the truth, the above explanation is just story-telling. I had no evidence. What would the evidence even be? Here’s what I settled on. First, let’s express the AS-AD model in quarterly growth rates. In order to get a handle on monetary regime AD variance, I calculated the standard deviation of the NGDP growth rate by Fed Chair. Presumably, the Fed chair has a decent amount to do with monetary policy and the rear that occupies that chair is an indicator of when a regime begins and ends. I calculated the correlation between the GDP deflator and RGDP growth rates by regime. Below is the scatter plot.
What does it tell us? It tells us that regimes of stable AD growth experience a negative correlation between inflation and output growth. It also tells us that a AD growth volatility is associated with a positive correlation between inflation and output growth. So, Does lowflation necessarily mean low growth? It does in a regime of volatile and uncertain nominal income.
(Of course this is all casual. It makes sense to me at first blush though. Having said that, the line of best fit also looks like it’s driven by the 2 extremely variable times: McCabe & Powell.)
Sometimes I remark to my students, “This is why economists don’t get invited to cocktail parties.” This post is about that.
From 2008 – 2011 I taught a course at Florida State called “Economics of Compassion”. It is a course co-designed with my mentor Mark Isaac. The class discusses historical and contemporary problems related to poverty, both at the domestic and international levels. Having heard about the course, the Social Justice Living Learning Community at Florida State wanted me to teach the course to their incoming freshman.
It was quite different from other courses they were taking that seemed to talk in terms of solutions without regard for scarcity. My role was to put parameters on their utopia and get the students to think carefully about a couple questions related to issues they care about:
Compared to what?
What happens next?
The students seemed to like the class, but, for a committed group of people who want to change the world it was also quite a downer. It was a downer for them the same way economics is a downer for people at cocktail parties.
We start with scarcity. Scarcity is a fact of life. There are never enough resources to satisfy everyone and there will always be unmet desires. For the economist, the notion of trade-offs — you must give up one thing to get another — flow from this scarcity. It means that anytime a solution to a problem is attempted you are always giving something up.
For example, the death of George Floyd this summer sparked conversation about how to reduce police violence. One approaching to curbing this important social problem is to eliminate or reform qualified immunity (QI). This is a legal doctrine intended to protect police and others from frivolous lawsuits. The problem is that QI has made accountability extremely difficult. The logic of reforming QI is that doing so will increase accountability, raise the cost of police violence, and therefore lead to less police violence. That’s good economics.
But, remember there are trade-offs. In a new world where police are opened up to lawsuits, local government might need to increase police compensation to retain or attract qualified men and women. Where does the money come from? Can you reduce the number of police and/or will you have to raise taxes? There are other trade-offs too. Will police become more reluctant to enter dangerous neighborhoods? After all, there is a greater chance that inserting themselves into a risky situation will lead to financial ruin.
Moving from heavy to light. If you haven’t seen Yoram Bauman’s comedic schtick on Principles of Economics Translated, take five minutes and check it out here. As he illustrates, “economic profit” depends on alternatives: A Snickers bar valued at one dollar with no alternative implies an economic profit of $1. However, if the alternative was M&Ms that you value at 70 cents then your economic profit is 30 cents … Your profit from pursuing one course action declines as the value of the alternative increases.
By accounting for trade-offs the net benefit of a course of action goes down. When we bring up trade-offs in conversation, economists effectively eat into people’s mental profits for some course of action.
Another thing to consider, when you’re intervening, that intervention can sometimes have dramatic side effects that you didn’t even think about. You cannot merely move people around as if they’re pieces on a chessboard (head nod to Adam Smith).
For example, it is possible that eliminating qualified immunity leads to less police violence but more neighborhood violence overall if police decide not to insert themselves into situations that could be more costly. Beyond this hypothetical example I have been using, there are loads of other unintended consequences economists talk about.
Thinking in this way is the bread and butter of economists. This is how we see the world. But, don’t try this in social settings. As EconTalk host Russ Roberts once commented (this podcast), a pleasant picnic veered into chilly company when he pointed out someone’s proposed minimum wage could have negative employment effects. The others at the picnic started to inch away from him on the picnic blanket. At parties, I’ve had people talk about the idea that a tax won’t effect them because it is only on sellers, homeowners, etc. I’ve had to ask myself, “Is it worth it to bring up that the tax is likely to be passed through?”
So while my last couple posts sing the praises of economics, I should let you know, at cocktail parties people don’t like to think about scarcity, tradeoffs, and unintended consequences. Economists like to think about the seen and unseen. Many others, especially in social settings, would rather the unseen remain unseen.
Last week I posted about Bart Wilson’s talk on his new book “The Property Species” and promised to share a class demonstration about the emergence of property rights in the classroom. But first let me tell you why I did this demonstration.
When I was a student I hated assignments that go through the motions of learning, but provide no learing. Building a paper maché volcano, while fun for some, teaches little about volcanic eruptions. Shaking and opening a soda bottle (pop?) is more instructive: it’s the fall in pressure as the bottle is opened that leads to the rapid release of the gas disolved in the liquid, the same thing happens to magma. And while being able to algebraically solve for the equilibrium price given supply and demand functions is a very necessary evil (to a point), it teaches little about the process of competition and price formation.
This is why I was reluctant to having my first Intro to Economics class write their own version of “I pencil”, quite a few years ago. Driving the point of how largely anonymous exchange and specialization, coordinated peacefully through property, prices, and profits and loss makes the modern world possible is very important. But how much can you really learn about this by watching and transcribing an episode of “How It’s Made”? For most students, not much at all. Partly in dread of reading and grading 80 versions of “I whiteboard marker”, or “I toothbrush”, and partly following my conscience I decided to throw in a twist.
The twist may seem evil and arbitrary at first. Students still had to choose a good and write their own version of “I _____” , but if two students wrote about the same good I would divide their grade by 2. If three students wrote about the same good I would divide their grade by 3 and so on. I did not give any additional prompts about how they should sort out potential conflicts or coordinate amongst themselves. These were just the rules of the assignment.
Without this seemingly arbitrary grading rule, goods to write about were not scarce. By changing the grading rules, goods to write about became scarce. While there are many more goods to write about than students, certain goods stand out in the mind, and extra effort must be devoted in thinking up a new good, and finding out if someone had already looked around their room and chosen the same good. Now students also had to coordinate amongst themselves or run the risk of a fairly severe penalty to their grade.
As expected, I have never had to enforce the the harsh grading penalties (anecdotal, I know). Students always find a way to coordinate and establish property rights over suddenly scarce goods. The point of the assignment was no longer about I pencil, but about the emergence of property rights and social coordination (and hopefully a little bit about I pencil as well). I didn’t act as a central authority that imposed and enforced property rights. I merely changed the incentives and constraints, hoping that the costs of coordinating and setting up agreements was smaller than the costs of not doing this.
When they turned in their assignment, we discussed how they had actually coordinated. Over the years I have seen multiple ingenious mechanisms. From class forums using the university platform, to a simple spreadsheet circulated amongst the students via email or WhatsApp. In the good old times before the pandemic they would sometimes meet after class and sort it out in person. Sometimes they created a common pool of goods and one of their classmates is chosen to distribute them among their peers. Leaders emerge to fill various roles from dispute resolution to registering claims. How this person is chosen also varies from class to class. Some students volunteer, others have it thrust upon themselves. The use of a homesteading rule is fairly common, first to choose gets the good in cases where there are multiple claims. In class we discuss why they use this rule, rather than last to choose gets the good, and the problems this alternative would entail.
I have only had one instance of a strong and contested dispute among “property owners”. That semester students had to not only write but present their work. Two groups (that semester “I _____” was a group assignment) wanted to do a good they thought would be amusing to present in class. I’ll leave it up to your imagination what good students in their late teens and early twenties might find to be amusing to present in class. The two groups of students underwent a rather complicated dispute resolution system with the rest of the class playing the role of arbiters of the multiple claims to the same good. Neither group wanted to budge, but one group ended up ceding the rights in the end.
What I like about this little classroom demonstration is that it makes it easier to teach the emergence of institutions as the products of human action but not human design. Order without design is a difficult concept to grasp, but maybe even more importantly it is a concept that is difficult to accept. But after this demonstration, not anymore, students experience the emergence of property rights. An added bonus is that in this case scarcity is clearly a product of the relation between their minds and how they relate to the world, not about objective quantities of goods.
I later learned of the fish game (I am not an experimentalist). But, no disrespect intended, it seems a little contrived. I still like my assignment better. While the goldfish game teaches the tragedy of the commons, the “I _____” assignment teaches how the tragedy can be solved without a centralized authority by having students solve if for themselves and come to grips with the real limitations and problems they faced, albeit on a much smaller scale. I am still hoping for an experimentalist that thinks something serious can be made out of my little classroom demonstration.
How much research do economists devote to the topics of gender, race and ethnicity, and inequality? In a recently published article in Econ Journal Watch, Arnold Kling and I looked at articles published in the American Economic Review as well as the conference papers of the American Economic Association on this topics. We find that economists devote a large amount of space to the topics combined in recent years: over 10% of published articles and over 20% of conference papers. We also find that the share of research on this topics, as measured in these two AEA outlets, has been increasing over time (we go back to 1991, when the current JEL Code system was introduced).
Of the three areas we looked at, papers on gender saw the clearest increase, rising as both a share of published articles and conference papers. Published AER articles addressing inequality have also been increasing over this time period, though AEA conference papers on inequality have been stable. Both published articles and conference papers on race and ethnicity have been stable over the period we studied as a share of the total, though the absolute number has increased.
What is the significance of our results? Our main motivation was to challenge other economists who suggest, in various ways, that economists ignore these topics or don’t study them enough (for examples see these popular writings on gender, race and ethnicity, and inequality). Our research clearly shows that economists devote a good deal of attention to these topics, and for many areas it has shown a clear increase.
It is still possible that economists don’t dedicate enough time to these topics. We make no strong claim in the paper about what the correct amount of time for each topic would be. However, we do note the opportunity cost that comes with an increasing focus on these topics.
More importantly, those who suggest in public venues that economists ignore these areas are doing a disservice to all the scholars that have devoted their careers to studying these important topics and publishing their results in one of the top journals in the discipline. We have much more to learn about gender, race and ethnicity, and inequality, but dismissing the research that has already been done is unfair to a discipline that has increasingly focused on these areas.
The sudden shutdown of much of the economy of the U.S. and of the world starting in February and March of 2020 led to deep concern, if not panic, in world financial markets. Millions of people were suddenly unemployed or furloughed, millions of small businesses faced bankruptcy, and stocks plunged some 30% in the fastest fall of global markets in history. Demand collapsed, and prices for nearly all financial assets fell. Trillions of dollars of financial transactions were in danger of unravelling.
The Federal Reserve immediately rode to the rescue, slashing interest rates and buying up all kinds of financial assets. These purchases of bonds and similar products injected cash into the markets to provide much-needed liquidity, and kept the system on track. In late March, the U.S. federal government authorized trillions of dollars of payments to individuals and businesses to stave off bankruptcy, and forbade foreclosures on mortgages, to keep people from losing their homes (at least in the near term). Banks and governments in other nations took similar measures. By May, it was clear that the worst scenarios had been averted, even though there will be significant lingering consequences of the Covid shutdowns.
The speed and scale of the Fed and government responses in March, 2020, may be attributed in part to learnings from the 2008-2009 Global Financial Crisis (GFC). In that crisis, the severity of the problem was not understood at first. There was naturally reluctance to take unprecedented actions to do what was perceived as bailing out of irresponsible banks and other companies. Over a period of many months, various measures were implemented to address some immediate needs, but then more and more problems kept cropping up. It was a macroeconomic game of whack-a-mole.
As a bit of a history lesson, here is a timeline of the main financial events of January-September, 2008. These descriptions are taken, with only minor editing, from an article by Kimberly Amadeo in The Balance.
Easy credit and expectations of always-increasing home prices led to a speculative run-up in housing in 2002-2006. Mortgages were given to people who really could not afford them, and billions of dollars of those unsound sub-prime mortgages were repackaged and sold into the broad financial system. That all began to unravel in 2006-2007. In response to a struggling housing market, the Federal Market Open Committee began lowering the fed funds rate. It dropped the rate to 3.5% on January 22, 2008, then to 3.0% a week later. Economic analysts thought lower rates would be enough to restore demand for homes.
February 2008: Bush Signs Tax Rebate as Home Sales Continue to Plummet
President Bush signed a tax rebate bill to help the struggling housing market. The bill increased limits for Federal Housing Administration loans and allowed Freddie Mac to repurchase jumbo loans.
February’s homes sales fell 24% year-over-year. It reached 5.03 million according to the National Association of Realtors. The median resale home price was $195,900, down 8.2% year-over-year. Foreclosures were up.
March 2008: Fed Begins Bailouts
The Fed Chair realized the Fed needed to take aggressive action. It had to prevent a more serious recession. Falling oil prices meant the Fed was not concerned about inflation. When inflation isn’t a concern, the Fed can use expansionary monetary policy. The Fed’s goal was to lower the LIBOR benchmark interest rate, and keep adjustable-rate mortgages affordable. In its role of “bank of last resort,” it became the only bank willing to lend.
It increased its Term Auction Facility program to $50 billion. It also initiated a series of term repurchase transactions. These were 28-day term repurchase agreements with primary dealers. The Fed’s goal was to pump $100 billion into the economy.
No one knew who had the bad debt or how much was out there. All buyers of debt instruments became afraid to buy and sell from each other. No one wanted to get caught with bad debt on their books. The Fed was trying to keep liquidity in the financial markets.
But the problem was not just one of liquidity, but also of solvency. Banks were playing a huge game of musical chairs, hoping that no one would get caught with more bad debt. The Fed tried to buy time by temporarily taking on the bad debt itself. It protected itself by only holding the debt for 28 days and only accepting AAA-rated debt.
March 14: The Federal Reserve held its first emergency weekend meeting in 30 years. On March 17, it announced it would guarantee Bear Stearns‘ bad loans. It wanted JP Morgan to purchase Bear and prevent bankruptcy. Bear Stearns’ had about $10 trillion in securities on its books. If it had gone under, these securities would have become worthless. That would have jeopardized the global financial system.
March 18: The Federal Open Market Committee (FOMC) lowered the fed funds rate by 0.75% to 2.25%. It had halved the interest rate in six months. That put downward pressure on the dollar, which increased oil prices.
That same day, federal regulators agreed to let Fannie Mae and Freddie Mac take on another $200 billion in subprime mortgage debt. The two government-sponsored enterprises would buy mortgages from banks. This process is known as buying on the secondary market. They then package these into mortgage-backed securities and resell them on Wall Street. All goes well if the mortgages are good, but if they turn south, then the two GSEs would be liable for the debt.
The Federal Housing Finance Board also took action. It authorized the regional Federal Home Loan Banks to take an extra $100 billion in subprime mortgage debt.The loans had to be guaranteed by Fannie and Freddie Mac.
Fed Chair Ben Bernanke and U.S. Treasury Secretary Hank Paulson thought this would take care of the problem. They underestimated how extensive the crisis had become. These bailouts only further destabilized the two mortgage giants.
April – June: Fed Lowers Rate and Buys More Toxic Bank Debt
April 30: The FOMC lowered the fed funds rate to 2%.
April 7 and April 21: The Fed added another $50 billion each through its Term Auction Facility.
May 20: The Fed auctioned another $150 billion through the Term Auction Facility.
By June 2, the Fed auctions totaled $1.2 trillion. In June, the Federal Reserve lent $225 billion through its Term Auction Facility. This temporary stop-gap measure of adding liquidity had become a permanent fixture.
July 11, 2008: IndyMac Bank Fails
July 11: The Office of Thrift Supervision closed IndyMac Bank. Los Angeles police warned angry IndyMac depositors to remain calm while they waited in line to withdraw funds from the failed bank. About 100 people worried they would lose their deposit. The Federal Deposit Insurance Corporation (FDIC) only insured amounts up to $100,000. This was later raised to $250,000.
July 23: Treasury Secretary Paulson made the Sunday talk show rounds. He explained the need for a bailout of Fannie Mae and Freddie Mac. The two agencies themselves held or guaranteed almost half of the $12 trillion of the nation’s mortgages.
Wall Street’s fears that these loans would default caused Fannie’s and Freddie’s shares to tumble. This made it more difficult for private companies to raise capital themselves. Paulson reassured talk show listeners that the banking system was solid, even though other banks might fail like IndyMac.
July 30: Congress passed the Housing and Economic Recovery Act. It gave the Treasury Department authority to guarantee as much as $25 billion in loans held by Fannie Mae and Freddie Mac.
September 7: Treasury Nationalizes Fannie and Freddie
The FHFA placed Fannie and Freddie under conservatorship. It allowed the government to run the two until they were strong enough to return to independent management.
The FHFA allowed Treasury to purchase preferred stock of the two to keep them afloat. They could also borrow from the Treasury. Last but not least, Treasury was allowed to purchase their mortgage-backed securities.
The Fannie and Freddie bailout initially cost taxpayers $187 billion. But over time, they two paid back all costs plus added $58 billion in profit to the general fund.
September 15, 2008: Lehman Brothers Bankruptcy Triggered Global Panic
Paulson urged Lehman Brothers to find a buyer. Only two banks were interested: Bank of America and British Barclays.
Bank of America didn’t want a loan. It wanted the government to cover $65 billion to $70 billion in anticipated losses. Paulson said no. The U.S. Treasury had no legal authority to invest capital in Lehman Brothers, as Congress hadn’t yet authorized the Troubled Asset Relief Program. Barclays announced its British regulators would not approve a Lehman Brothers deal.
Since Lehman Brothers was an investment bank, the government could not nationalize it like it did government enterprises Fannie Mae and Freddie Mac. For that same reason, no federal regulator, like the FDIC, could take it over. Moreover, the Fed couldn’t guarantee a loan as it did with Bear Stearns. Lehman Brothers didn’t have enough assets to secure one.
When Lehman’s declared bankruptcy, financial markets reeled. The Dow fell 504 points, its worst decline in seven years. U.S. Treasury bond prices rose as investors fled to their relative safety. Oil prices tanked.
Later that day, Bank of America announced it would purchase struggling Merrill Lynch for $50 billion.
September 16, 2008: Fed Buys AIG for $85 Billion
The American International Group Inc. turned to the Federal Reserve for emergency funding. The company had insured trillions of dollars of mortgages throughout the world. If it had fallen, so would the global banking system. Bernanke said that this bailout made him angrier than anything else. AIG took risks with cash from supposedly ultra-safe insurance policies. It used it to boost profits by offering unregulated credit default swaps.
October 8, 2008: The Federal lent another $37.8 billion to AIG subsidiaries in exchange for fixed-income securities.
November 10, 2008: The Fed restructured its aid package. It reduced its $85 billion loan to $60 billion. The $37.8 billion loan was repaid and terminated.The Treasury Department purchased $40 billion in AIG preferred shares. The funds allowed AIG to retire its credit default swaps rationally, stave off bankruptcy, and protect the government’s original investment.
September 17, 2008: Economy Almost Collapsed
Due to losses from Lehman’s bankruptcy, investors fled money market mutual funds. That’s where companies obtain their short-term cash.
September 16: The Reserve Primary Fund “broke the buck.” It didn’t have enough cash on hand to pay out all the redemptions that were occurring.
September 17: The attack spread. Investors withdrew a record $172 billion from their money market accounts. During a typical week, only about $7 billion is withdrawn. If it had continued, companies couldn’t get money to fund their day-to-day operations. In just a few weeks, shippers wouldn’t have had the cash to deliver food to grocery stores. We were that close to a complete collapse.
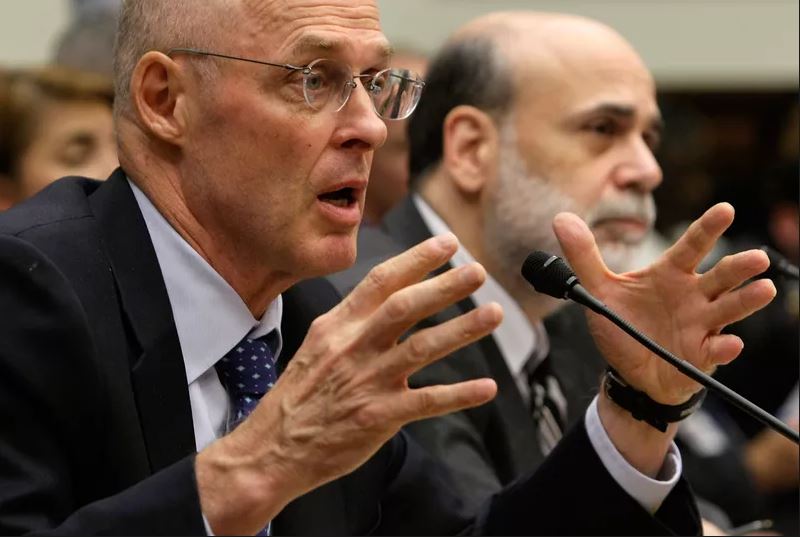
September 19, 2008: Paulson and Bernanke Meet with Congress
U.S. Treasury Secretary Henry Paulson (L) speaks as Federal Reserve Board Chairman Ben Bernanke (R) listens during a hearing before the House Financial Services Committee on Capitol Hill September 24, 2008 in Washington, DC. Photo: Alex Wong/Getty Images
September 19: Paulson and Bernanke met with Congressional leaders to explain the crisis. Republicans and Democrats alike were stunned by the somber warnings. They realized that credit markets were only a few days away from a meltdown.
The leaders were prepared to work together in a bipartisan fashion to craft a solution. But many rank-and-file members of Congress were not on board.
Bernanke announced the Fed would lend the money needed by banks and businesses to operate so they wouldn’t have to pull out the cash in money market funds. This, along with the announcement of the bailout package, calmed the markets enough keep the economy functioning.
September 20, 2008: Treasury Submits Legislation to Congress
On September 20, Paulson submitted a three-page document that asked Congress to approve a $700 billion bailout. Treasury would use the funds to buy up mortgage-backed securities that were in danger of defaulting. By doing so, Paulson wanted to take these debts off the books of banks, hedge funds, and pension funds that held them.
When asked what would happen if Congress didn’t approve the bailout, Paulson replied, “If it doesn’t pass, then heaven help us all.”
September 21, 2008: The End of the “Greed Is Good” Era
Goldman Sachs and Morgan Stanley, two of the most successful investment banks on Wall Street, applied to become regular commercial banks. They wanted the Fed’s protection.
September 26, 2008: WaMu Goes Bankrupt
Washington Mutual Bank went bankrupt when its panicked depositors withdrew $16.7 billion in 10 days. It had insufficient capital to run its business. The FDIC then took over. The bank was sold to J.P. Morgan for $1.9 billion.
September 29, 2008: Stock Market Crashes as Bailout Rejected
A trader gestures as he works on the floor of the New York Stock Exchange September 29, 2008 in New York City. U.S. stocks took a nosedive in reaction to the global credit crisis and as the U.S. House of Representatives rejected the $700 billion rescue package, 228-205. Photo by Spencer Platt/Getty Images
The stock market collapsed when the U.S. House of Representatives rejected the bailout bill. Opponents were rightly concerned that their constituents saw the bill as bailing out Wall Street at the expense of taxpayers. But they didn’t realize that the future of the global economy was at stake.
To restore financial stability, the Federal Reserve doubled its currency swaps with foreign central banks in Europe, England, and Japan to $620 billion. The governments of the world were forced to provide all the liquidity for frozen credit markets.
[Again, these descriptions are taken nearly verbatim from 2008 Financial Crisis Timeline, by Kimberly Amadeo. See her article for coverage of the rest of 2008, and the ending of the recession in 2009.]
How likely is it that an opinion critical of [topic] will get expressed by someone on the internet?
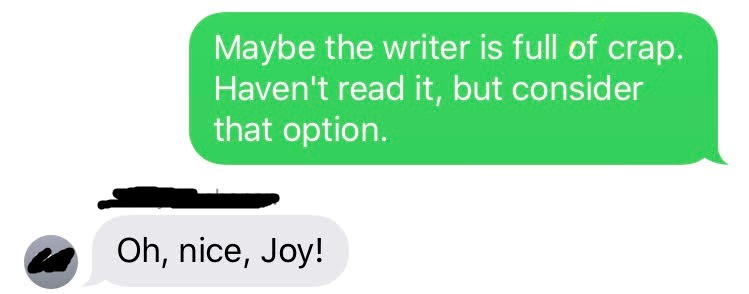
My good friend (call her Anne) texted me this week. Anne sent me a link to a blog that declared some of her preferred works of art (i.e. musicals) to be inferior. She loves art, so to be told that her tastes were not exceptionally good was disappointing.
In my reply I wanted to make sure that Anne wasn’t putting too much weight on this new evidence:
How should we incorporate blogs into our beliefs about reality? (I see the irony – I’m writing a blog right now.)
The non-technical summary: you should be skeptical of what you read online.
The technical summary: the fact that some writer said “H” on the internet, should make you only slightly more confident that “H” is true.
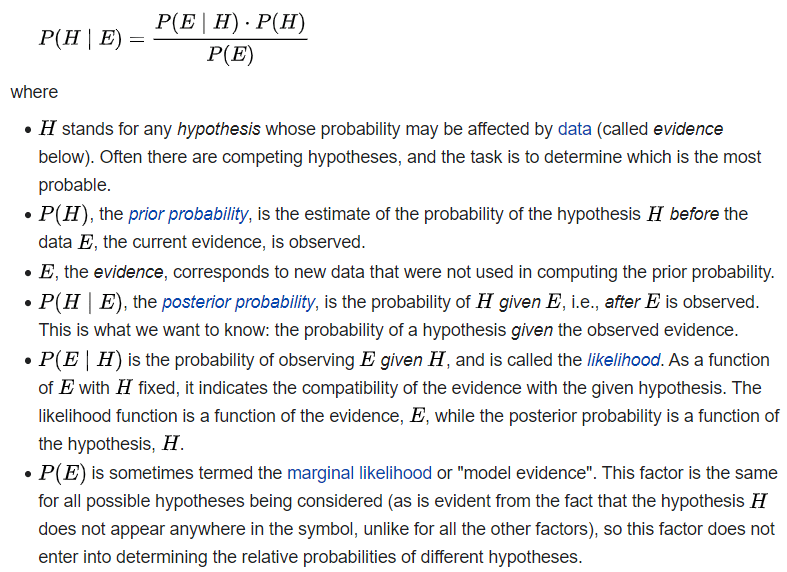
I can’t improve on the Wikipedia presentation of Bayes’ theorem, so I’ll just paste in:
Let’s consider the probability that it is true that Anne’s favorite musical is bad. We’ll call that hypothesis “H”. What’s the probability of H, given that one person wrote an article stating that the musical is bad?
The evidence, E, is the article.
Instead of just evaluating whether the article is convincing or not, Bayesian inference requires that we consider
Were we confident that H was true BEFORE seeing the article? Was there good data up until this point that convinced us H is true?
If H is true, what’s the probability of this article being written?
What’s the overall probability of this article being written, regardless of whether H is true?
The probability that musical is bad given that someone wrote an article saying so is :
P(H|E) = P(bad|article)
P(bad|article) = ( P(article|bad) x P(bad) )/ P(article)
The right side of the equation asks whether we are likely to see the article if the musical is bad. If the musical is actually bad, then we are likely to see it condemned in print. HOWEVER, if we had a prior belief that the musical is not bad, then the numerator gets smaller.
Finally, we consider the denominator, P(E) or the probability of seeing an article that is derogatory towards the musical. If that probability is high, then the probability of the musical actually being bad goes down.
Here’s how Anne should think:
P(bad|article) = ( likely that article will be written if bad x prior evidence suggests not bad) / snobby think pieces get written regardless
so
P(bad|article) = (big x small)/ big = small probability that Anne’s favorite musical is actually bad
You should be just the right amount of skeptical when it comes to internet content. Be Bayesian.
I’m going to occasionally make cartoons of actual things that people have said. The real world can be very entertaining. I was a graduate student at George Mason University, so I got to take a class from Bryan Caplan.
He broke up his 3-hour lectures with Caplan-jokes. I only remember one. Maybe it stuck with me because of the funny voices. He was talking about happiness and consumption in the context of microeconomics. He impersonated a German philosopher debating a British philosopher.
Do people do what makes them happy? What do we make, as economists, of people who claim that they want to write a novel but never do? If someone claims to prefer sad songs, can we really call them sad songs?
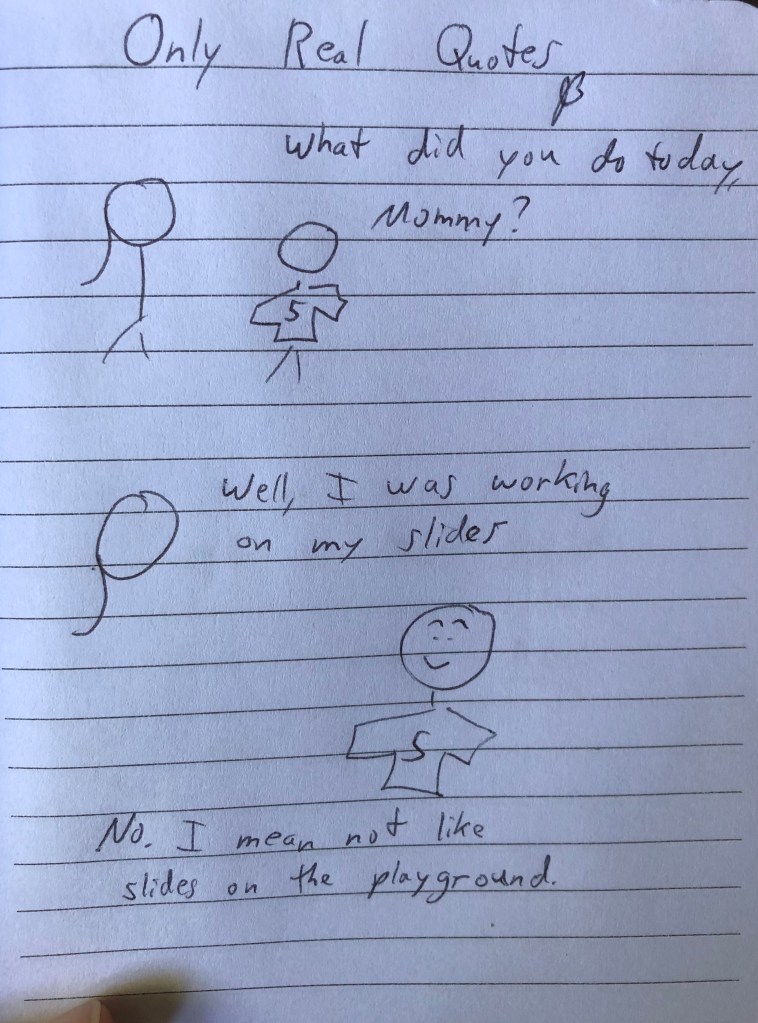
Next, here’s one from me and my son. I put his age on his cartoon shirt. I always ask him about the details of his day while I was away at work. He’s old enough to understand a little bit about how I spend my time, but sometimes I don’t get it right when I attempt two-way communication.