The tariffs still have me thinking about buying VIX calls and stock puts (especially when policy changes loom on certain dates like July 8th), and on the bigger question of finding the sort of investments that did well in the 1970’s, another decade of stagflation that was kicked off by a President who broke America’s commitment to an international monetary system that he thought no longer served us.
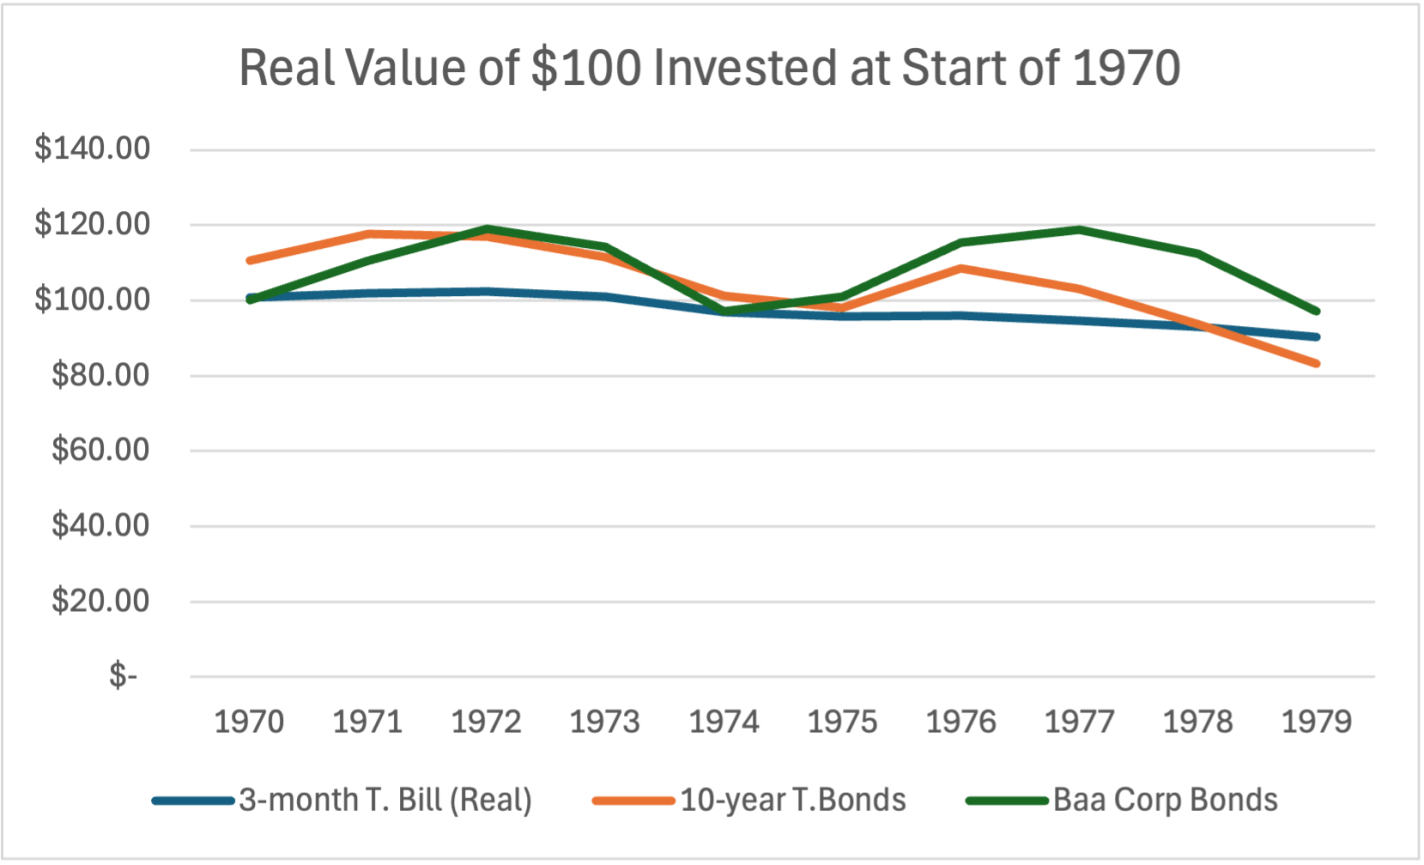
That’s how I concluded last week. So this week I’ll answer the question- what were the best investments of the 1970’s? When the dollar is losing value both at home and abroad, holding dollars or bonds that pay off in dollars does poorly:
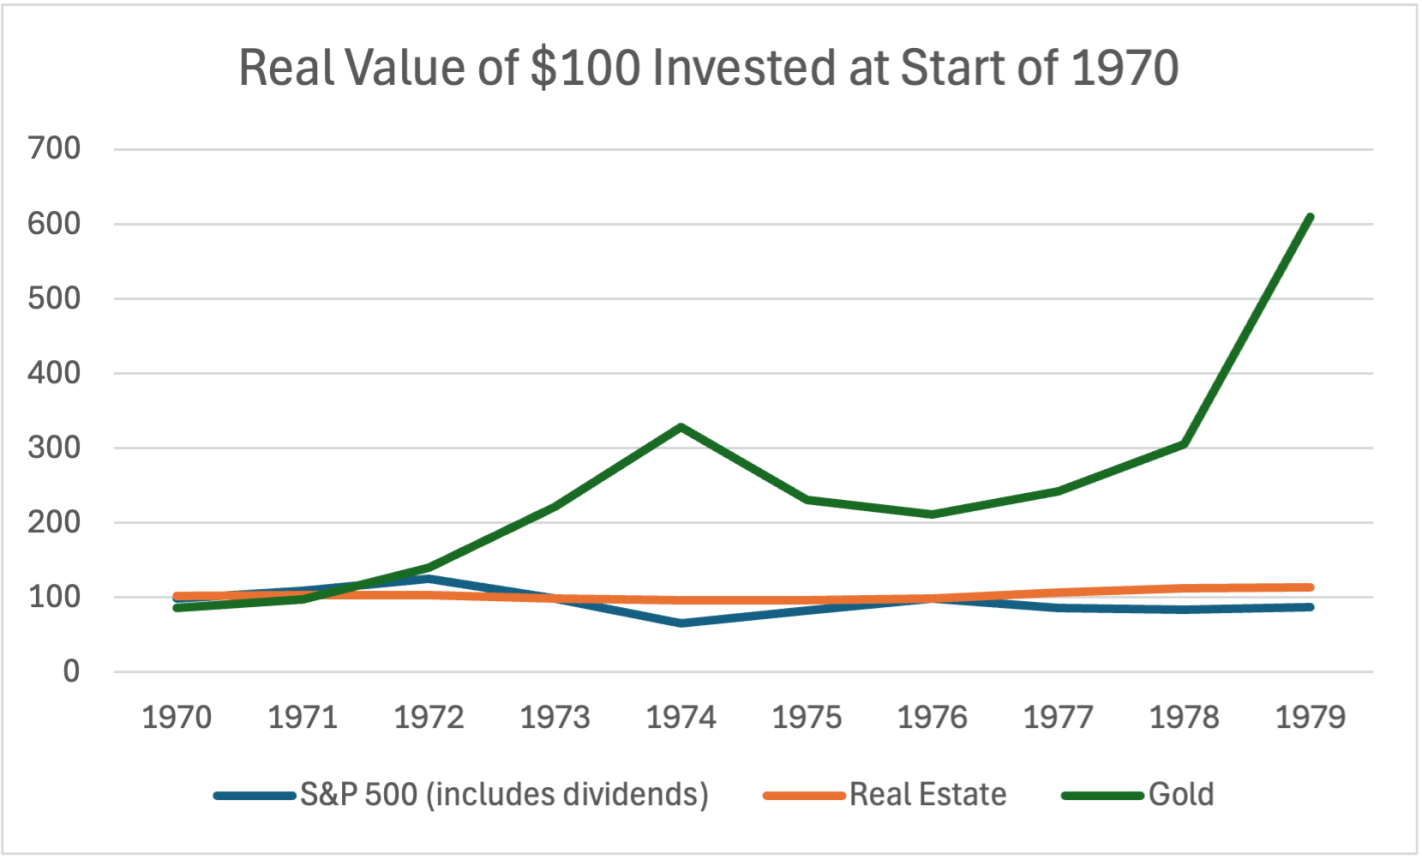
Stocks can do alright with moderate inflation, but US stocks lost value in the stagflation of the 1970’s. Foreign stocks and commodities generally performed better. Real estate held its value but didn’t produce significant returns; gold shone as the star of the decade:
Gold is easy to invest in now compared to the 1970s; you don’t have to mess with futures or physical bullion, there are low-fee ETFs like IAUM available at standard brokerages.
Of course, while history rhymes, it doesn’t repeat exactly; this time can and will be different. I doubt oil will spike the same way, since we have more alternatives now, and if it did spike it wouldn’t hurt the US in the same way now that we are net exporters. Inflation won’t be so bad if we keep an independent Federal Reserve, though that is now in doubt. At any time the President or Congress could reverse course and drop tariffs, sending markets soaring, especially if they pivot to tax cuts and deregulation in place of tariffs ahead of the midterms.
Things could always get dramatically better (AI-driven productivity boom) or worse (world war). But for now, “1970s lite” is my base case for the next few years.
Now, driven by that spending surge, inflation has also surged, and thus the Fed has been obliged to raise interest rates. And so now, in addition to the enormous current deficit spending, that tsunami of short-term debt from 2020-2021 is coming due, to be refinanced at much higher rates. This high interest expense will contribute further to the growing government debt.
Hedge fund manager Stanley Druckenmiller commented in an interview:
When rates were practically zero, every Tom, Dick and Harry in the U.S. refinanced their mortgage… corporations extended [their debt],” he said. “Unfortunately, we had one entity that did not: the U.S. Treasury….
Janet Yellen, I guess because political myopia or whatever, was issuing 2-years at 15 basis points[0.15%] when she could have issued 10-years at 70 basis points [0.70 %] or 30-years at 180 basis points [1.80%],” he said. “I literally think if you go back to Alexander Hamilton, it is the biggest blunder in the history of the Treasury. I have no idea why she has not been called out on this. She has no right to still be in that job.
Unsurprisingly, Yellen pushed back on this charge (unconvincingly). More recently, former Treasury official Amar Reganti has issued a more detailed defense. Here are some excerpts of his points:
( 1 ) …The Treasury’s functions are intimately tied to the dollar’s role as a reserve currency. It is simply not possible to have a reserve currency without a massive supply of short-duration fixed income securities that carry no credit risk.
( 2 ) …For the Treasury to transition the bulk of its issuance primarily to the long end of the yield curve would be self-defeating since it would most likely destabilise fixed income markets. Why? The demand for long end duration simply does not amount to trillions of dollars each year. This is a key reason why the Treasury decided not to issue ultralong bonds at the 50-year or 100-year maturities. Simply put, it did not expect deep continued investor demand at these points on the curve.
( 3 ) …The Treasury has well over $23tn of marketable debt. Typically, in a given year, anywhere from 28% to 40% of that debt comes due…so as not to disturb broader market functioning, it would take the Treasury years to noticeably shift its weighted average maturity even longer.
( 4 ) …The Treasury does not face rollover risk like private sector issuers.
Here is my reaction:
What Reganti says would be generally valid if the trillions of excess T-bond issuance in 2020-2021 were sold into the general public credit market. In that case, yes, it would have been bad to overwhelm the market with more long-term bonds than were desired. But that is simply not what happened. It was the Fed that vacuumed up nearly all those Treasuries, not the markets. The markets were desperate for cash, and hence the Fed was madly buying any and every kind of fixed income security, public and corporate and mortgage (even junk bonds that probably violated the Fed’s bylaws), and exchanging them mainly for cash. Sure, the markets wanted some short-term Treasuries as liquid, safe collateral, but again, most of what the Treasury issued ended up housed in the Fed’s digital vaults.
So, I remain unconvinced that the issuance of mainly long-term (say 10-year and some 30-year; no need to muddy the waters like Reganti did with harping on 50–100-year bonds) debt would have been a problem. So much fixed-income debt was vomited forth from the Treasury that even making a minor portion of it short-term would, I believe, have satisfied market needs. The Fed could have concentrated on buying and holding the longer-term bonds, and rolling them over eventually as needed, without disturbing the markets. That would have bought the country a decade or so of respite before the real interest rate effects of the pandemic debt issuance began to bite.
That extra $4 trillion or so that the feds dumped into our collective checking accounts in 2020-2021 – -where did it come from? Certainly not from taxes. It was created out of thin air, via a multi-step alchemy. The government does not have the authority to simply run the printing presses and crank out benjamins. The U.S. Treasury sells bonds to Somebody(ies), and that Somebody in turn gives the Treasury cash, which the Treasury then uses to fund government operations and giveaways. In 2020-2021, the Somebody who bought all those bonds was mainly the Federal Reserve, which does have the power to create unlimited amounts of cash, in exchange for government bonds or certain other investment-grade fixed income securities.
What is causing a bit of a kerfuffle recently is public assessment of what sorts of bonds that Janet Yellen’s Treasury issued back then. Interest rates were driven down to historic lows in that period, thanks to the Fed’s monster “quantitative easing” (QE) operations. The Fed was buying up fixed income hand over fist: government bonds, mortgage securities, even corporate junk bonds (which was probably illegal under the Fed’s charter, but desperate times…). This buying frenzy drove bond prices up and rates down.
All corporate CFOs with functioning neurons and with BB+ credit ratings refinanced their company debt in that timeframe: they called in as much of their old bonds as they could, and re-issued long-term debt at near-zero interest rates. Or they just issued 5, 10, 20 year low-interest bonds for the heck of it, raising big war-chests of essentially free cash to tide them through any potential hard times ahead. And of course, millions of American homeowners likewise refinanced their mortgages to take advantage of low rates.
What about the federal government? Was the Treasury, under Secretary Yellen, similarly clever? No, not really. Because there is little serious doubt that the U.S. government will be able to pay its debts (grandstanding government shutdowns aside), the government can always find takers for 20- and 30-year bonds, as well as shorter maturity securities. A mainstay of government financing is the 10-year bond. And in 2020-2021, the Fed would have consumed whatever kinds of bonds the Treasury wanted to sell, so the Treasury could have issued a boatload of long-term bonds.
It seems that the Treasury issued a lot of 2-year bonds, rather than longer-term bonds. If they had issued say ten-year bonds, the government would have had a decade of enjoying very low interest payments on that huge slug of pandemic-related debt. But now, all those 2-year bonds are being rolled over at much higher rates and thus much greater expense to the government. (Since the federal debt only grows, almost never shrinks, maturing earlier bonds are not simply paid down, but are paid by issuing yet more bonds).
Veteran hedge fund manager Stanley Druckenmiller (reported net worth: $6 billion) commented in an interview:
When rates were practically zero, every Tom, Dick and Harry in the U.S. refinanced their mortgage… corporations extended [their debt],” he said. “Unfortunately, we had one entity that did not: the U.S. Treasury….
Janet Yellen, I guess because political myopia or whatever, was issuing 2-years at 15 basis points[0.15%] when she could have issued 10-years at 70 basis points [0.70 %] or 30-years at 180 basis points [1.80%],” he said. “I literally think if you go back to Alexander Hamilton, it is the biggest blunder in the history of the Treasury. I have no idea why she has not been called out on this. She has no right to still be in that job.
Ouch.
Druckenmiller went on:
When the debt rolls over by 2033, interest expense is going to be 4.5% of GDP if rates are where they are now,” he warned. “By 2043—it sounds like a long time, but it is really not—interest expense as a percentage of GDP will be 7%. That is 144% of all current discretionary spending.
“Well, I disagree with that assessment,” Yellen said when asked to respond to the accusation during an interview on CNN Thursday night. She said the agency has been lengthening the average maturity of its bond portfolio and “in fact, at present, the duration of the portfolio is about the longest it has been in decades.”
According to Druckenmiller, this is not quite true. It does seem that of the federal bonds held by the public (including banks), the average maturity (recently as long as 74 months) has indeed been a bit longer than usual in the past several years. However, this ignores the huge amount of government bonds held at the Fed:
“The only debt that is relevant to the US taxpayer is consolidated US government debt,” Druckenmiller said. “I am surprised that the Treasury secretary has chosen to exclude $8 trillion on the Fed balance sheet that is paying overnight rates in the repo market. In determining policy, it makes no sense for Treasury to exclude it from their calculations.”
Druckenmiller makes an important point. However, how this plays out depends on how the Fed treats these bonds going forward. If the Fed keeps these bonds on its balance sheet, and buys the replacement bonds, there will be actually very little interest expense to the government going forward. The reason is that the Fed is required to remit 90% of its profits back to the Treasury, so the gazillions of interest payments on those bonds and their replacements will largely flow right back to Treasury. However, if the Fed continues with reducing its balance sheet, forcing the Treasury to go the open market to roll these bonds over, Druckenmiller’s dire warnings will prove correct.
Because of this enormous debt overhang and the ongoing need for the government to sell bonds, I do not expect interest rates to go down as low as 2021 or even 2019 levels, unless there is a financial catastrophe requiring the Fed to become a gigantic net buyer of bonds once again.
Bill Gross grew PIMCO into a trillion dollar company by trading bonds, earning the epithet “Bond King“. But in an interview with Odd Lots this week, he disclaims both bonds and his title. He wasn’t the king:
My reputation as a bond king was first of all made by Fortune. They printed a four page article with me standing on my head doing yoga, and I was supposedly the bond king, and that was good because it sold tickets. But I never really believed it. The minute you start believing it, you’re cooked.
Who is the real bond king? The Fed:
The bond kings and queens now are are at the Fed. They rule, they determine for the most part which way interest rates are going.
Who still isn’t the bond king? Any other trader, especially Jeff Gundlach:
To be a bond king or a queen, you need a kingdom, you need a kingdom. Okay, Pimco had two trillion dollars. Okay, DoubleLine’s got like fifty five billion. Come on, come on, that’s no kingdom. That’s like Latvia or Estonia whatever. Okay, and then then look at his record for the last five, six, seven years. How does sixtieth percentile smack of a bond king? It doesn’t.
Why he doesn’t believe in long-term bonds right now:
We have a deficit of close to two trillion. The outstanding treasury market is about 33 trillion… about thirty percent of the existing outstanding treasuries, so ten trillion have to be rolled over in the next twelve months, including the two trillion that’s new. So that’s that’s twelve trillion dollars. Where the treasuries that have to be financed over the next twelve months, and who’s going to buy them at these levels? Well, some people are buying them, but it just seems to be a lot of money. And when you when you add on to that, Powell is doing quantitative tightening, as you know, and that theoretically is a trillion dollars worth of added supply, I guess. And so it just seems like a very dangerous time based on supply, even if inflation does comedown.
By revealed preference I agree with Gross, in that I don’t own any long-term bonds. Their yields are way up from 2 years ago, making them somewhat tempting, but I can get higher yields on short-term bonds, some savings accounts, and some stocks. So I see no reason to go long term, especially given the factors Gross highlights. If he’s right, better long-term yields will be here in a year or two. If he turns out to be wrong, I think it would be because of a severe recession here or in another major economy, but I don’t expect that. So what is Gross buying instead of bonds? He likes the idea of real estate:
All all my buddies at the country club are in real estate, and they’ve never paid a tax in their life…. I’ve paid a lot of taxes.
He landed on Master Limited Partnerships, common in the energy sector, as an easier way to avoid taxes, and has 40% of his wealth there. Those are yielding more like 9% and have the tax benefits, though they are risker than treasury bonds. The rest of his portfolio he implies is in stocks, describing some merger arbitrage opportunities. I am a bit tempted by bonds because they’ve done so badly recently (and so have gotten much cheaper), but like Gross I think we’re still not to the bottom.
This post is to share some observations that may be helpful to readers who, like me, were rudely surprised by the simultaneous steep decline in both bonds and stocks in the past year.
Bonds and Stocks Are No Longer Inversely Correlated
Back in the day before routine, massive Federal Reserve interventions, say before the 2008 Great Recession, there was a more or less routine business cycle. In an expansionary phase, GDP would increase, there was greater demand for loans, company profits would rise and so would stock prices and interest rates. When interest rates go up, bond prices go down. When the cycle rotated to the recessionary downside, all this would reverse. Stocks would go down, interest rates would decline and investors would flee to bonds, raising their prices.
Thus, bonds served as a good portfolio diversifier, since their prices tended to move inversely to stocks. Hence, the traditional 60/40 portfolio: 60% stocks, 40% bonds, with periodic rebalancing between the two classes.
This approach still worked sort of OK from 2008-2021 or so. The Fed kept beating interest rates lower and lower, and so bond prices kept (fitfully) rising. But at last we hit the “zero bound”. Short- and long-term interest rates went to essentially zero in the U.S. (and actually slightly negative in some other developed countries). Rates had nowhere to go but up, and so bond prices had no place go but down, no matter how stocks performed.
Trillions of dollars of federal deficit spending to pay out various COVID-related benefits in 2020-2021, along with supply chain interruptions, ignited raging inflation in 2022, which the Fed belated addressed with a series of rapid rate hikes and reductions in its bond holdings. The end of easy (nearly no-interest) money and the prospect of a recession knocked stock prices down severely in 2022. However, the rise in both short term and long term interest rates also cratered bond prices. The traditional 60/40 portfolio was decimated. Thus, in an inflationary environment with active Fed intervention, bonds are much less useful as a portfolio diversifier.
Both the stock and bond markets seem to be now driven less by real-world considerations and more by expectations of Fed (and federal government) reactions to real-world occurrences. Pundits have noted the “bad news is good news” effect on stock prices: if GDP dips or unemployment rises (which used to be considered recessionary bad news), the markets cheer, assuming that if any real economic pain occurs, the federal government will flood us with benefits and the Fed will lower rates and buy bonds and otherwise facilitate the renewed deficit spending. (See The Kalecki Profit Equation: Why Government Deficit Spending (Typically) MUST Boost Corporate Earnings for an explanation of why deficit spending normally causes a rise in corporate profits, and hence in stock prices.)
In 2022, there was practically no place to hide from investment losses. Petroleum-related stocks furnished one of the few bright spots, but that was partly a function of economies recovering that year from COVID lockdowns. There is no particular reason to believe that petroleum stocks will rise in the next market downturn. Oil and gas stocks, along with gold and other commodities, might offer a certain degree of diversification, but none of these can be assumed to normally rise (or even stay steady) when the general stock market falls.
Managed Futures Funds as Portfolio Diversifiers
It turns out that there is one class of investable assets that does tend to rise during an extended market downturn, while typically rising slowly or at least staying level during stock bull markets. That is managed futures funds. These funds observe pricing trends across a wide range of commodities and currencies and bond markets, and buy or sell futures to try to profit. If they (or their algorithms) guess right, they make steady, small gains. If there is a new, strong trend that they can buy into, they can make a lot of money quickly. Such was the case for most of 2022. It was obvious that the Fed was going to raise rates heavily that year, which would drive up interest rates and the value of the dollar versus other currencies, and would crush bond prices. The managed futures funds shorted the Euro and bonds, and made a ton of money January-November last year. Investors who held these funds were glad they did. Charts to follow.
The first chart here shows the total returns for the S&P 500 stock index (blue) and a general bond fund, BND (purple), for the past three years, ending Feb 13, 2023. (Ignore the orange curve for the moment). This chart captures the short but very sharp drop in stock prices in early 2020, as COVID lockdowns hit, but government aid was promised. Bonds did not greatly rise as stocks fell then, although after a bit of wobble they stayed fairly steady in early 2020. However, when stocks slid down and down during most of 2022, bonds went right down with them (purple drawn-in arrow), giving no effective diversification. Both stocks and bonds rose in early 2023, showing what is now a positive correlation between these two asset classes.
The next chart (below) omits the bonds line, showing just the blue stocks curve and the orange curve, which is for a managed futures fund, DBMF. The drawn-in red arrows show how DBMF only dipped a little during the COVID crash in early 2020, and it rose greatly in 2022, as stocks (blue arrow) collapsed. This shows the power of managed futures for portfolio diversification.
There was a surprising break in futures trends in November, 2022, as markets suddenly started pricing in an early Fed pivot towards easing in 2023, and so interest rates rose, and bonds and the U.S. dollar tumbled. All the managed futures funds took a sharp hit Nov-Dec 2022; some of them recovered better than DBMF, which kept drifting down for the next few months. Without getting too deep in the weeds, DBMF is an exchange-traded fund (ETF) with favorable fees and taxation aspects for the average investor. However, its holdings are chosen by observing the recent (past few weeks) behavior of other, primary managed futures funds, and trying to match the average performance of these funds. Some of these other, similar funds are EBSIX, PQTNX, GIFMX and AMFNX. These are mutual funds, rather than ETFs, with somewhat higher fees and higher minimum purchases, depending on which “class” of these funds you go with (A, C, or I).
This average matching technique is good, because the performance of any single one of the major managed futures funds can be really good or really any particular year. Some of these individual funds have done consistently horribly, so you’d be in bad shape if you happened to pick one of those. But the average of all those funds, as quantified by a relevant index, does OK and so does DBMF. However, as observed by Seeking Alpha author Macrotips Trading, because of its backwards-looking matching methodology, DBMF can be appreciably slower than other funds to adjust its positions when trends change. KMLM is another managed futures ETF, which tends to be more volatile than DBMF; higher volatility may be desirable for this asset class.
One Fund to Rule Them All
A recommended application of these managed futures funds is to replace maybe a third of your 40% bond holdings with them. Back testing shows good results for say a 15 managed futures/25 bonds/ 60 stocks portfolio, which is periodically rebalanced.
What if there was a fund which combined stocks and managed futures under one wrapper? There is one I have found, called REMIX. It has an “institutional” class, BLNDX, with higher minimum purchase and slightly lower fees, which I have bought into. The chart below shows the past three years of performance for the hybrid REMIX (orange) compared to stocks (blue) and the managed futures-only fund DBMF. We can see that REMIX stayed fairly flat during the COVID blowout in 2020, and it rose along with stocks in 2021, and went roughly flat in 2022 instead of dropping with stocks (see thick drawn-in yellow arrows). The performance of REMIX is actually better than a plain average of stocks (blue curve) and DBMF (purple), so this is an attractive “all-weather” fund. A similar hybrid (multi-asset) fund is MAFCX, which has higher fees but perhaps slightly higher returns to date. MAFCX buys stock (S&P500) futures rather than the stocks themselves, which is a leveraged play – – so for $100 investment in MAFCX you get effectively $100 worth of managed futures plus $50 worth of stock investment.
Managed futures put in an outstanding performance in 2022 because there was a well-telegraphed trend (Fed raising interest rates) in place for many months, which allowed them to make easy profits at the same time that stocks were crashing. But we cannot assume that managed futures will always go up when stocks go down. That said, managed futures will likely be reasonable diversifiers, since they should at least stay roughly level when stocks go down. The trick is to not grow impatient and dump them if their prices stagnate during a long bull stock market phase. Holding them in the form of a multi-asset fund like REMIX may help investors hang in there, since it should go up in a bull market (due to its stock component), while offering protection in a bear.
For instance, below is a five-year chart of a managed futures fund ( EBSIX, purple line ), the S&P 500 stock index (blue line), and a multi-asset fund that combines stocks and managed futures ( MAFIX, orange line. This is the institutional version of MAFCX). The charting program did not account properly for the Dec 2022 dividend of MAFIX, so I extended its curve with a short red line at the right-hand side to show what it should look like if plotted on a consistent total return basis.
With perfect hindsight, I chose a managed futures fund (EBSIX) which has performed among the best over the years; many other such funds would have looked far worse. There was a period of nearly two years (mid-2020 -early 2022) when this fund lagged far behind stocks. It was only when the 2022 catastrophe arrived that the managed future fund EBSIX proved its worth and shot up. The multi-asset fund MAFIX, which is similar to REMIX but with higher fees, basically kept up with stocks in their bull phase, then held more or less steady for 2022, and ended much higher over five years than either SP500 or the plain EBSIX.
There’s still a few more days left in the year, but at this point it is safe to say, unfortunately, that it was a very bad year for investing. This Google chart shows most of the bad news. Note: nothing in this post is investment advice about the future, just a summary of the past.
The S&P 500, the typical benchmark for US equities, was down 20%. Bonds, usually a safe haven, were down over 14% as measured by the Vanguard Total Bond fund (more on bonds later).
Gold, the traditional hedge against bad times, was flat. I guess that’s not so bad. But gold is also traditionally considered a hedge against inflation, and inflation will probably end up being somewhere in the range of 5-7% this year (depending on your preferred index). So in real terms, even gold was down. And the supposed new hedge against fiat currency? Bitcoin is down 65% (crypto has other potential redeeming features, but inflation hedging was supposed to be one of them).
Did anything do well? Oil was basically flat too, starting and ending the year in the $75-80 range. Of course, oil companies did very well this year — Exxon is up over 70%, since prices were elevated for much of the year. But picking individual stocks is always fraught with danger. For example, you might think electric car companies would have done well in the past year, given the high gas prices for much of the year, yet Tesla was down over 70% (I won’t speculate here about why, but it may have other idiosyncratic explanations).
There is one boring, sleeper investment that would have earned you a decent return. Not a massive return, but one that will likely be slightly higher than the rate of price inflation (once we have complete inflation data). And the investment is totally safe, and by April you would have known exactly your rate of return for the full year: 8.5%.
That investment? Series I Savings Bonds, issued by the US Treasury. Series I Bonds pay a fixed rate of return for 6 months, which you know at the time you buy it. The interest rate rests every 6 months based on the rate of CPI inflation. If you invested in these bonds in January 2022, you would have earned 3.56% for 6 months, and then you would have earned 4.81% for the second half of 2022. And this was all known as early as April 2022 (though not officially confirmed by the Treasury until May).
While a lot of people were talking about the possibility of high inflation at the beginning of 2022, I don’t recall many people advising anyone to buy these bonds. It’s not a super well known investment, and not super exciting. Plus each investor is capped at $10,000 per year in most cases, so you couldn’t have moved all your money into I Bonds. Another restriction is that you lose some of the interest if you pull the money out before 5 years.
Still, this was one bright spot in an otherwise terrible year for most broad investment types.
It has been such a volatile couple of days in the markets that you hardly know where to focus. Friday’s inflation print was 8.6% (year/year), higher than expected and the highest in forty years, showing (yet again) that the Fed’s “transitory inflation” line was always just fantasy. Despite its glacial, foot-dragging pace of response to date, the Fed will need to raise short-rates (which they directly control) faster and farther than earlier planned. The Fed does not directly control long-term rates, but they influence them by buying and selling bonds on the open markets. For years, they have been buying bonds (driving interest rates lower), but they will have to stop that and maybe go the other way, being net sellers of bonds. This will make financing government deficits much more difficult.
Anyway, both short and long term rates have gone vertical in the past few days as markets price in all this, reaching levels not seen since the aftermath of the 2008 Global Financial Crisis:
Mortgage rates will likely march even further upward, increasing the monthly payments for most homeowners. At some point, this will deflate the housing market. Some of today’s eager new homebuyers who paid over asking price, assuming that housing only goes up, may be in for a rude awakening.
It seems like the only way to tamp down inflation is old-fashioned demand destruction. Stock market participants are starting to price in the dreaded R-word (recession). The plunging stock market has been in the news the last few days. Yes, it has dropped a lot, but shown on a five-year chart below it may not be so apocalyptic. It is dropping from ridiculously over-optimistic market highs at the end of 2021. We are still slightly above the pre-COVID peak:
If you are young and working, you should see lower prices as a buying opportunity. If you are making regular contributions to a savings plan in stocks (dollar cost averaging), your dollars are buying you more stocks. If you feel you must DO something, you could always rebalance your portfolio, shifting some funds into stocks from something else, to maintain a say 70/30 stock/bond portfolio. Peace…
Corporations raise money in various ways to invest in their operation. A company may sell common stock to the public; the shareholders are not guaranteed any particular return on their investment, but if the company does well, the share price and the dividends paid by the stock can be expected to go up.
Preferred stock falls in between common stock and bonds. Investors mainly buy preferred stock for its dividends. Typically, the price of the preferred stock doesn’t go up like common stock can, but the company cannot pay any dividends on the common unless all of the promised dividends on the preferred are paid up.
CORPORATE BONDS: INVESTMENT GRADE AND JUNK
Companies can sell bonds to raise money. Bonds are somewhat standardized securities, which are marketed to the broad investing community. The company is legally bound to pay the interest, and eventually the principal, of a bond. Bonds are senior to stocks in case of extracting value from a company that has gone bankrupt. Some bonds are more senior than others, depending on the “covenants” in the fine print of the bond description (debenture). For smaller, less stable companies, the only way they may get someone to buy their bonds is to agree to certain conditions that make it more likely the bond will be repaid. For instance, the company selling the bond might be restricted from issuing more than a certain amount of total debt relative to its earnings, or from taking on additional debt which might be senior to its existing debt.
Bonds are rated by agencies such as Moody’s and Standard and Poor’s. Large, stable companies get high ratings (e.g. AA), and can pay lower interest. You, the public, can buy into investment grade bonds through funds such as iShares iBoxx $ Investment Grade Corporate Bond ETF (LQD). This fund currently pays about 2.6%, but most of the returns in the past several years have been from an increase in the price of the fund shares. (For longer term bonds, the market price of a previously-issued bond increases as market interest falls, which it has in recent years).
The lowest investment grade is BBB. The bonds of shakier companies are rated at BB or lower, and have pay higher interest. This is called high yield debt or junk bonds. You can invest in junk bonds through funds such as JNK and HYG.
CORPORATE BANK LOANS
Companies also obtain loans from banks. Banks scrutinize the operations of the company to decide whether they want to risk their money in making a loan. Banks usually demand restrictions and guarantees to help ensure the loan will paid back. These restrictions are called covenants. Sometimes the payback of the loan is tied to a specified asset. For instance, if the income of a company falls below a certain level (which might imperil paying off the loan), the covenant may require the company to give ownership of some asset, like a building or a set of oil wells, to the bank, so the bank can sell it to pay back the loan immediately, before economic conditions worsen.
This graphic shows some of the conditions a company might have to sign to in order to get a loan from a bank:
Here is a summary of the differences between bonds and loans, courtesy of WallStreetMojo (slightly edited):
The main difference is that a bond is highly tradeable. If you purchase a bond, there is usually a market place where you can trade it. It means you can even sell the bond, rather than waiting for the end of the thirty years. In practice, people purchase bonds when they wish to increase their portfolio in that way. Loans tend to be the agreements between borrowers and the banks. Loans are generally non-tradeable, and the bank will be obliged to see out the entire term of the loan.
In the case of repayments, bonds tend to be only repaid in full at the maturity of the bond – e.g., 10, 20, or 30 years. With bank loans, both principal and interest are paid down during the repayment period at regular intervals (like a home mortgage).
Issuing bonds give the corporations significantly greater freedom to operate as they deem fit because it frees them from the restrictions that are often attached to the loans that are lent by the banks. Consider, for example, that lenders or the creditors often require corporates to agree to a variety of limitations, such as not to issue more debt or not to make corporate acquisitions until their loans are repaid entirely.
The rate of interest that the companies pay the bond investors is often less than the rate of interest that they would be required to pay to obtain the loan from the bank. Sometimes the interest on the loan is not a fixed percent, but “floats” with general short-term interest rates.
A bond that is traded in the market possesses a credit rating, which is issued by the credit rating agencies, which starts from investment grade to speculative grade, where investment-grade bonds are considered to be of low risk and usually have low yields. On the contrary, a loan don’t have any such concept; instead, the creditworthiness is checked by the creditor.
LEVERAGED LOANS
The rough equivalent of a junk bond in the world of corporate loans is called a “leveraged loan”. A leveraged loan is a type of loan that is extended to companies or individuals that already have considerable amounts of debt or poor credit history. Lenders consider leveraged loans to carry a higher risk of default, and so they demand higher interest on the loan. Leveraged loans and junk bonds play a key role in helping smaller or struggling companies achieve their financial goals. Leveraged loans are widely used to fund mergers and acquisitions.
Because the company itself is considered shaky, creditors typically require that the company offers some specific asset for collateral to “secure” the loan. Also, the loan is typically written to be “senior” to other debt, including bonds, in case of bankruptcy. Historically, the recovery rate for such senior secured loans has been about 80%, as compared to a recovery of about 40% for unsecured bonds, if the company goes bankrupt.
Typically, a bank would not want to take all the risk of such a loan upon itself. Therefore, for a leveraged loan, the bank arranges for a syndicate of multiple banks or other financial institutions to own pieces of the loan. You, too, can get a piece of this action by buying shares of the fund Invesco Senior Loan ETF (BKLN), which is currently yielding 3.2%.
S&P Global Market Intelligence offers a primer on leveraged loans, complete with tutorial videos. As shown below, the market for leveraged loans in the U.S. is now over $ 1 trillion: