This semester I am participating in a reading group with undergraduate students that focuses on the history and prospects for capitalism and socialism. Lately we have been reading Joseph Stiglitz, who has long argued that China’s transition to a market economy has gone much better than the former Soviet Union. Gradual transition is superior to “shock therapy,” according to Stiglitz.
There’s an extent to which this is true. If we just look at economic growth rates since, say, 1995, China has clearly outpaced Russia.
It’s hard to know exactly what year to start, since GDP figures for former planned economies immediately after transition aren’t reliable, but the start date is mostly irrelevant for everything I’ll say here (please play around with the start year in the charts to see if I’m cherry-picking years). 1995 seems a reasonable enough year to start for reliable post-transition starting point.
As we see above, while Russia has had a rough doubling of GDP per capita since 1995 (respectable, and yes, it’s all adjusted for inflation!), China has soared almost 600%. Wow! But this is something of a cheat. Despite all that growth, average income in China is still lower than Russia: only about 60% of Russia in 2020. China started from a much lower level, meaning that faster growth, while not guaranteed, is at least easier to achieve. In fact, if we go back to 1978, when China’s first reforms began, GDP per capita in the Former USSR was about 6 times as high as China (that’s according to the latest Maddison Project estimates, which will always be speculative for non-market economies, but are the best we have).
Furthermore, Russia hasn’t really transitioned to a democracy either. China clearly hasn’t, but no one doubts that. But despite having the outward symbols of democracy (elections, a legislature, etc.), Russia still scores low on most indexes of democracy and civil liberties. For example, Freedom House scores them at 19/100, a little better than China (9/100), but nothing like Western Europe.
So, did the quick transition to market economies fail? Not so fast. While it did fail in Russia, in most of Eastern Europe and the eastern part of the former USSR seems to have been a major success. Take a look at this chart, which shows the former Soviet Republics in and near Europe (I exclude Central Asian FSRs).
The Olympics have begun. Is there anything economists can say about what determines a country’s medal count? You might not think so, but the answer is a clear yes! In fact, I am going to say that both the average economist and the average political economist (in the sense of studying political economy) have something of value to say.
Why could they not? After all, investing efforts and resources in winning medals is a production decision just like using labor and capital to produce cars, computers or baby diapers. Indeed, many sports cost thousand of dollars in equipment alone each year – a cost to which we must add the training time, foregone wages, and coaching. Athletes also gain something from these efforts – higher incomes in after-career, prestige, monetary rewards per medal offered by the government. As such, we can set up a production function of a Cobb-Douglas shape
Where N is population, Y is total income (i.e., GDP), A is institutional quality and T is the number of medals being won. The subscript i and t depict the medals won at any country at any Olympic-event. This specification above is a twist (because I change the term A’s meaning as we will see below) on a paper in the Review of Economics and Statistics published in 2004 by Andrew Bernard and Meghan Busse.
The intuition is simple. First, we can assume that Olympic-level performance abilities requires a certain innate skill (e.g. height, leg length). The level required is an absolute level. To see this, think of a normal distribution for these innate skills and draw a line near the far-right tail of the distribution. Now, a country’s size is directly related to that right-tail. Indeed, a small country like Norway is unlikely to have many people who are above this absolute threshold. In contrast, a large country like Germany or the United States is more likely to have a great number of people competing. That is the logic for N being included.
What about Y? That’s because innate skill is not all that determines Olympic performance. Indeed, innate skills have to be developed. In fact, if you think about it, athletes are less artists who spend years perfecting their art. The only difference is that this art is immensely physical. The problem is that many of the costs of training for many activities (not all) are pretty even across all income levels. Indeed, many of the goods used to train (e.g., skis, hockey sticks and pucks, golfing equipment) are traded internationally so that their prices converge across countries. This tends to give an edge to countries with higher income levels as they can more easily afford to spend resources to training. This is why Norway, in spite of being quite small, is able to be so competitive – its quite-high level of income per capita make it easier to invest in developing sporting abilities and innate talent.
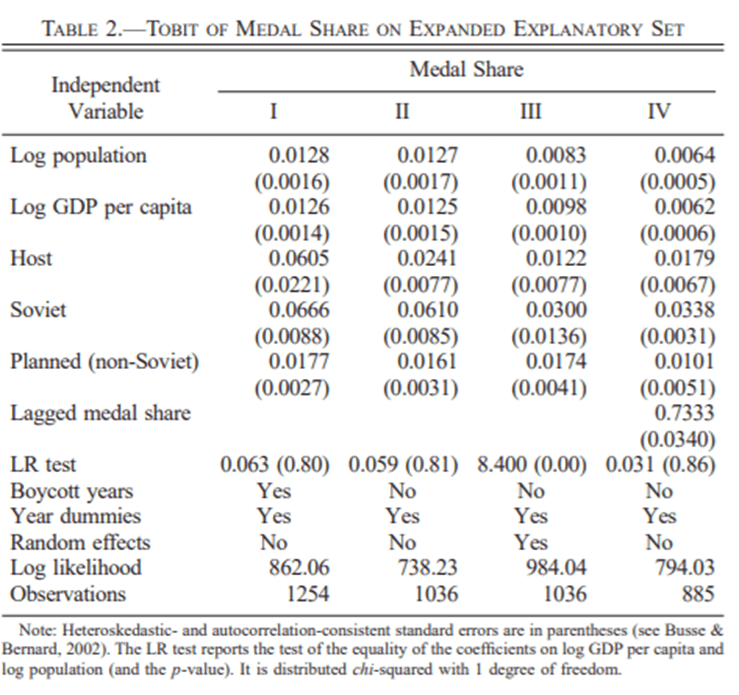
Bernard and Busse confirm this intuition and show that, yes, population and development levels are strong determinants of medal counts. The table below, taken from their article, shows this.
What about A? Normally, A is a scalar we use in a Cobb-Douglas function to illustrate the effect of technological progress. However, it is also frequently used in the economic growth literature as the stand-in for the quality of institutions. And if you look at Bernard and Musse’s article, you can see institutions. Do you notice the row for Soviet? Why would being a soviet country matter? The answer is that we know that the USSR and other communist countries invested considerable resources in winning medals as a propaganda tool for the regimes. The variable Soviet represents the role of institution.
And this is where the political economist has lots to say. Consider the decision to invest in developing your skills. It is an investment with a long maturity period. Athletes train for at least 5-10 years in order to even enter the Olympics. Some athletes have been training since they were young teenagers. Not only is it an investment with a long maturity period, but it pays little if you do not win a medal. I know a few former Olympic athletes from Canada who occupy positions whose prestige-level and income-level that are not statistically different from those of the average Canadian. It is only the athletes who won medals who get the advertising contracts, the sponsorships, the talking gigs, the conference tours, and the free gift bags (people tend to dismiss them, but they are often worth thousands of dollars). This long-maturity and high-variance in returns is a deterrent from investing in Olympics.