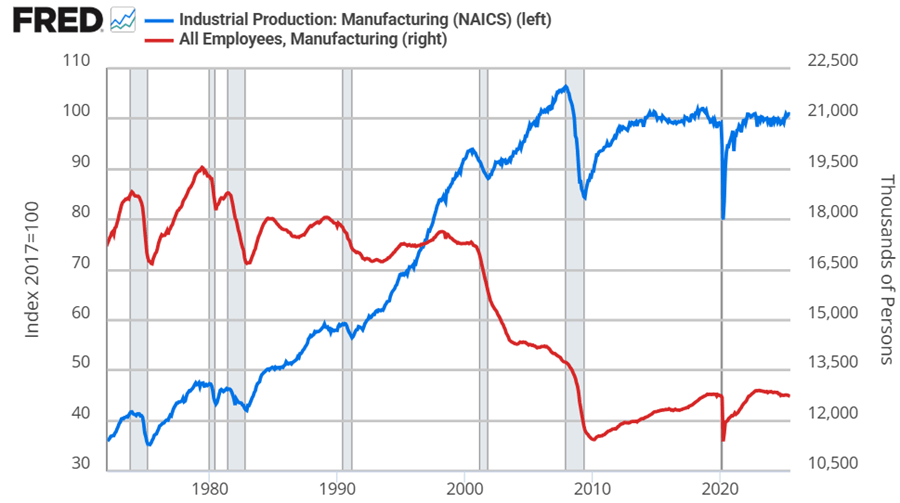
Did president Trump’s first term tariffs, enacted in 2018, increase manufacturing employment or even just manufacturing output? Let’s set the stage.
Manufacturing employment was at its peak in 1979 at 19.6 million. That number declined to 18m by the 1980s, 17.3m in the 1990s. By 2010, the statistics bottom out at 11.4m. Since then, there has been a rise and plateau to about 12.8m if we omit the pandemic.
Historically, economists weren’t too worried about the transition to services for a while. After all, despite falling employment in manufacturing, output continued to rise through 2007. But, after the financial crisis, output has been flat since 2014, again, if we omit the pandemic. Since manufacturing employment has since risen by 5% through 2025, that reflects falling productivity per worker. That’s not comforting to either economists or to people who want more things “Made in the USA”.
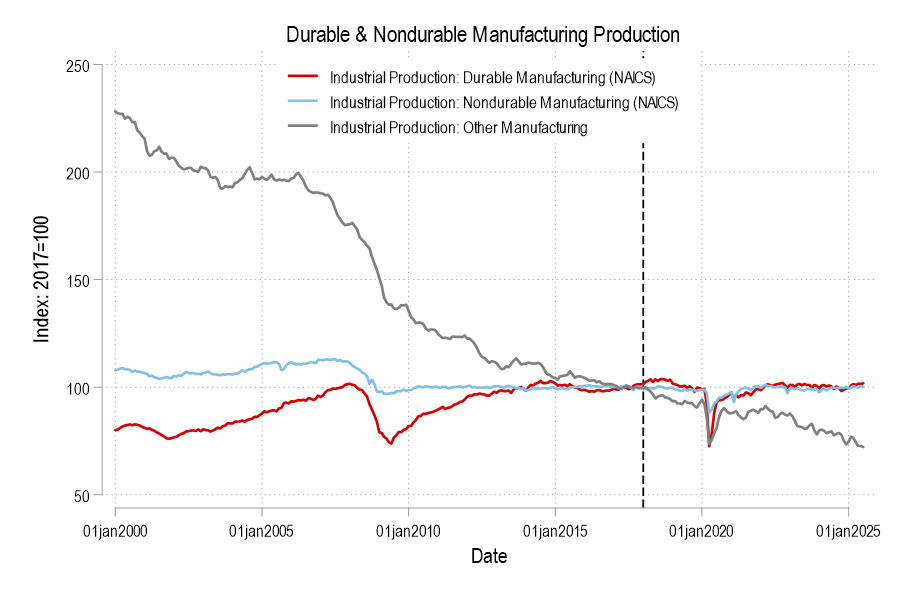
Looking at the graphs, there’s no long term bump from the 2018 tariffs in either employment or output. If you squint, then maybe you can argue that there was a year-long bump in both – but that’s really charitable. But let’s not commit the fallacy of composition. What about the categories of manufacturing? After all, the 2018 tariffs were targeted at solar panels, washing machines, and steel. Smaller or less exciting tariffs followed.
Breaking it down into the major manufacturing categories of durables, nondurables, and ‘other’ (which includes printed material and minimally processed wood products), only durable manufacturing output briefly got a bump in 2018. But we can break it down further.
Thousands of keyboards were likely drenched four days ago as coffee spewed from thousands of nostrils upon reading the headlines that President Trump fired the head of the Bureau of Labor Statistics because he (the prez) didn’t like the July 2025 job numbers that were reported. Apparently, the job stats were not as great as we had been led to expect for the new regime of tariffs and deportations. (Someone should inform the politicians that businessmen need predictability for making any expansionary plans). So, shoot the messenger, that will fix it.
The First Ire was apparently kindled especially by the truly massive downward revisions to the May (-125,000) and June (-133,000) job figures, which reduced the combined employment gain for those months by 258,000. That made for three anemic employment months in a row, which is a different picture that had been earlier portrayed. For those unfamiliar with past BLS reports, that could seem like manipulation or gross incompetence. For instance, whitehouse.gov published an article titled, “BLS Has Lengthy History of Inaccuracies, Incompetence”, excoriating the “Biden-appointed”, now-fired Erika McEntarfer who “consistently published overly optimistic jobs numbers — only for those numbers to be quietly revised later.”
But massive overestimations of jobs creation, followed a month or two or three later by massive downward revisions are pretty standard procedure for the BLS in recent years. Fellow blogger Jeremy Horpedahl has noted prior occurrences of this, e.g. here and here. There is no reason to suspect nefarious motives, though. The understaffed and overworked folks at BLS seem to be doing the best they can. It is just a fact that some key data simply is not available as early as other data. There are also rational adjustments, e.g. seasonal trends, that must first be estimated, and only later get revised.
Bloomberg explains some of the fine points of the recent revisions:
The downward revision to the prior two months was largely a result of seasonal adjustment for state and local government education, BLS said in earlier comments to Bloomberg. Those sectors substantially boosted June employment only to be largely revised away a month later.
But economists say the revisions also point to a more concerning, underlying issue of low response rates.
BLS surveys firms in the payrolls survey over the course of three months, gaining a more complete picture as more businesses respond. But a smaller share of firms are responding to the first poll. Initial collection rates have repeatedly slid below 60% in recent months — down from the roughly 70% or more that was the norm before the pandemic.
In addition to the rolling revisions to payrolls that BLS does, there’s also a larger annual revision that comes out each February to benchmark the figures to a more accurate, but less timely data source. BLS puts out a preliminary estimate of what that revision will be a few months in advance, and last year [2024], that projection was the largest since 2009.
Perhaps it would be wise for the BLS to hang a big “preliminary” label on any of the earlier results they publish, to minimize the howls when the big revisions hit later. Or perhaps some improvements could be made in pre-adjusting the adjustments, since revisions there do seem to swing things around outrageously. I expect forthcoming BLS reports to be the subject of derision from all sides. We all know which parties will scoff if the job report looks great or if it looks not great. Presumably the interim head of the Bureau, William Wiatrowski, is busy polishing his resume.
And POTUS should be careful what he wishes for – “great” job growth numbers would, ironically, strengthen the case for the Fed to delay the interest rate cuts he so desires.
Financial markets have sustained themselves for nearly two years now on the hope that within 1-2 quarters, the Fed will finally relent and start lowering interest rates. This hope gets dashed again and again by data showing stubbornly persistent high employment, high GDP growth, and high inflation, but the hope refuses to die.
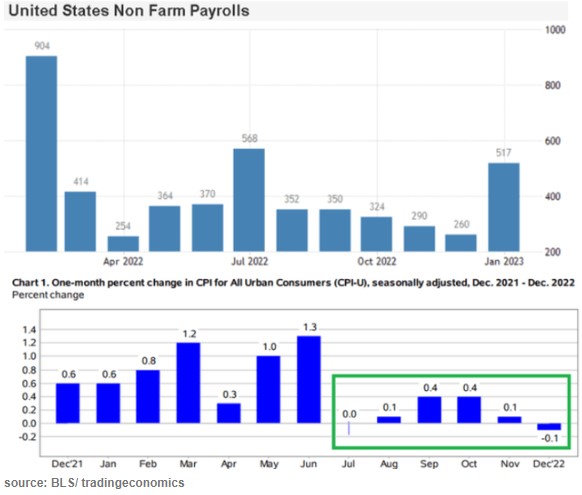
Long-term interest rates had been falling nicely for the last month, based on expectations of rate cuts in the fall. Then came Friday’s jobs report, and, blam, up went 10-year rates again. The Bureau of Labor Statistics (BLS) published its “Establishment” survey of data gleaned from employers. Non-farm payrolls rose by US 272k. This was appreciably higher than the 180k consensus expectation.
The plot below indicates that this number fits into a trend of essentially steady, fairly high employment gains (suggesting ongoing inflationary pressures):
There are fundamental reasons to take the BLS Establishment figures with a grain of salt. They have a history of significant revisions some months after first publication. Also, BLS uses a “birth/death” model for small businesses, which can account for some 50% (!) of the job gains they report. [1]
Another factor is that all of the net “jobs” created in recent quarters are reported to be part-time. According to Bret Jensen at Seeking Alpha, “Part-time jobs rose 286,000 during the quarter, while full-time jobs fell by just over 600,000. This is a continuation of a concerning trend where over the past year, roughly 1.5 million part-time positions were created while approximately one million full-time jobs were lost. This difference is that the BLS survey does not account for people working two or three jobs, which are now at a record as many Americans have struggled to maintain their standard of living during the inflationary environment of the past couple of years.”
It seems, then, that this week’s huge “jobs added” figure is not to be taken as indicating that the economy is overheated. However, it is still warm enough that rate cuts will be postponed yet again. A different BLS survey (“Household”) showed unemployment creeping up from 4.0% to 4.1%, which again suggests a more or less steady and fairly robust employment picture.
As far as drivers of inflation, I would look especially at wage growth. That is fitfully slowing, but not nearly enough to get us to the Fed’s 2% annual inflation target. My sense is that ongoing enormous federal deficit spending will keep pumping money into the economy fast enough to keep inflation high. High inflation will prevent significant interest rate cuts, assuming the Fed remains responsible. The interest payments on the federal debt will balloon due to the high rates, leading to even more deficit spending. If we actually get an economic downturn, leading to job insecurity and a willingness of workers to accept slower wage growth in the private sector, the federal spending floodgates will open even wider.
This makes hard assets like gold look attractive, to hedge against inflating U.S. dollars. This is one reason China has been quietly selling off its dollar hoard, and buying gold instead.
[1] For more in-depth treatments of employment statistics, see posts by fellow blogger Jeremy Horpedahl, e.g. here.
As noted earlier, the main driver in inflation since 2021 has not been supply chain issues, but ongoing wage increases in (mainly) the service industry, fueled by a tight labor market. Some headlines note recent decreases in job openings, etc., suggesting that the end of inflation is near. The point of this post is that measures of labor market tightness remain at very high levels, and so it will be a while yet before the Fed can claim victory over inflation and start meaningfully reducing interest rates.
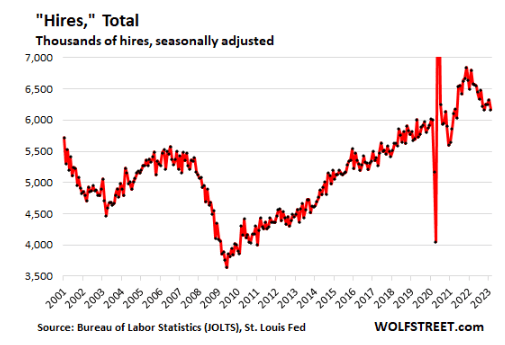
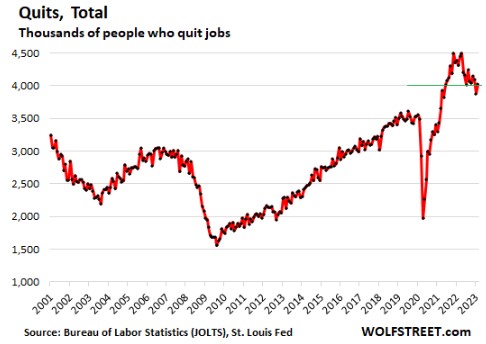
Below I will post a set of charts (courtesy of Seeking Alpha article by Wolf Richter) which make the following point: most measure of labor tightness remain at least as high as they were in late 2019, just before the pandemic hit. It is true that things have loosened up in the past few months, but that just means the labor market has gone from white-hot to merely red-hot. Let the data speak:
We hold that the current tightness of the labor market is largely a result of pandemic policies which incentivized a whole tranche of experienced workers to take early retirement and also put lots of cash in our pockets which we are spending generously on services . Those workers are not coming back, but at some point in the next 1-2 years the excess Covid cash will run out and we may finally get the long-expected recession. But if the government rushes in with enhanced unemployment benefits to ease the recession pain, we would expect inflation to remain well above the nominal 2% target
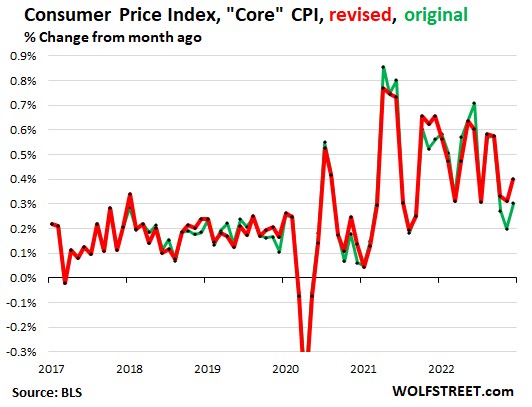
The stock market drools and rips higher at the slightest sign that inflation is abating, since that portends rate cuts instead of rate hikes by the Fed, and a return to the golden days of easy money. But what do the latest data show? Here I’ll show several charts to show what we know so far.
The last couple months’ data points in the lower chart show that inflation (as estimated by CPI) has essentially leveled out and may be starting to decline a little. That is fine but it still leaves inflation far above the Fed’s 2% target. Victor defines a Fed “pivot” not as actually cutting rates, but simply a halt to raising them. By that somewhat anemic definition, sure, a Fed pivot could well come in the next few months. But that leaves rates still very high by recent standards. The real question is when will inflation come down low enough to justify significant rate cuts. The Fed screwed up so abysmally last year with its ridiculous “this inflation is only transitory supply chain issues” that they really cannot afford to relent too soon, and let inflationary psychology take hold.
Side comment: the big “blowout” jobs number for January (last bar on the right, on the top chart above) caused a huge buzz. But there are strong reasons to discount it as an artifact of “ revisions, adjustments, control factors, and recoding “, per Jeffrey Snider.
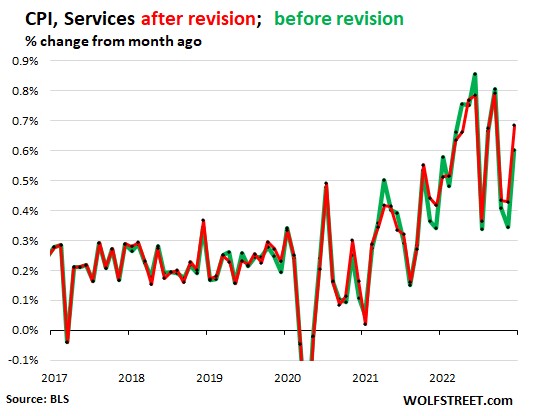
On the other side of the bull/bear divide, Wolf Richter published a glass-half-empty article noting how the Bureau of Labor Statistics recently revised its CPI numbers, and the changes shifted the numbers so as to undermine the argument that inflation has started to drop rapidly:
The chart above with revisions (red line) shows core CPI barely declining over the past 9 months or so, and no trend for an acceleration in that decline. The chart below shows CPI for Services (where we consumers spend most of our money, and which is closely correlated to wages) is holding nearly steady around a red-hot 0.55%/month or about 6.6% annualized. It could be longer than the market thinks before there are substantial rate cuts.
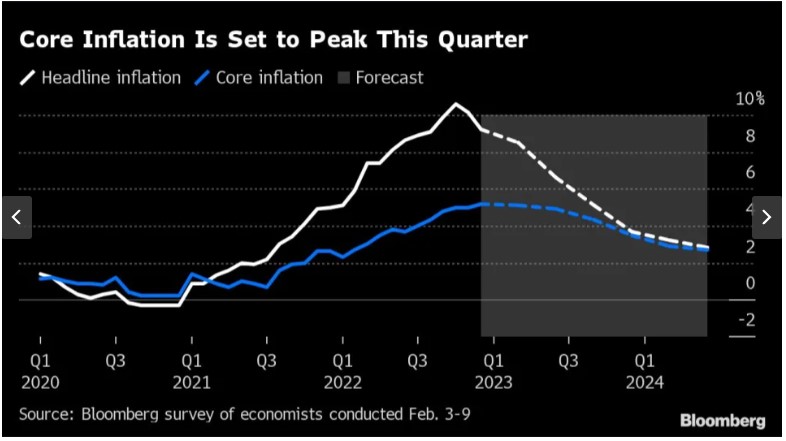
And from the Eurozone, there is this chart, courtesy of Bloomberg via Yahoo, depicting the results of polling economists as to the future course of inflation there:
The consensus view is that inflation in Europe will not approach the 2% target until well into 2024. The European Central Bank is expected to hike by 0.5% in March, followed by another 0.25% to reach 3.25%. (This is much lower than the Fed’s interest rates, but that is probably because the U.S. is still working off the orgy of COVID-related payments that dumped trillions in peoples’ pockets here in 2020-2021). Cuts by the ECB are not expected until the second quarter of 2024.
THIS JUST IN: The January CPI data just came out today (2/14), and pretty much matches up with the picture presented above. Inflation is falling, but ever so slowly, and so it becomes more likely that the Fed will keep its rates higher for longer:
“The Consumer Price Index (CPI) for January showed a 0.5% increase in prices over the past month, an acceleration from the prior reading, government data showed Tuesday. On an annual basis, CPI rose 6.4%, continuing a steady march down from a 9.1% peak last June. Economists had expected prices to climb 6.2% over the year and jump 0.5% month-over-month, per consensus estimates from Bloomberg. …
Core CPI, which strips out the volatile food and energy components of the report, climbed 5.6% year-over-year, more than expected, and 0.4% over the prior month. Forecasts called for a 5.5% annual increase and 0.4% monthly rise in the core CPI reading.”
(For another recent take on the inflation picture, see James Bailey’s The Murky Macro Picture, on this blog).
The good folks at Visual Capitalist have put together a big juicy infographic depicting employment trends over the next decade, based on projections from the Bureau of Labor Statistics. The vertical axis is % decadal growth for each category, the horizontal axis is 2020 median annual wage for that category, and the size of the bubble indicates the absolute numbers of change. The color of each bubble is keyed to “Occupational Group”, i.e., “Health related”, “Computer and mathematical”, etc.
Below I snipped part of the infographic which shows occupations which will be growing. The horizontal positioning (median annual wage) runs from $20,000 on the left to $120,000 on the far right; nurse practitioners fall in the $105,000-120,000 range. The fastest growing, percentagewise, are wind turbine service technicians (68%), followed by nurse practitioners and solar installers tied at about 52%. The biggest absolute numbers of job growth are in “Home health and personal care aides”, to tend aging baby boomers.
From the color coding, we can see at a glance that job growth is mainly in the Health Related and Computer and Mathematical categories, with a smattering of “Other”, including Animal Trainers (for dog obedience schools ??) and Crematory Operators, as those baby boomers age all the way out.
Some of the losing professions are shown below. Most of these are in the “Office and Admin Support” (purple) category and Production workers (including nuclear power reactor operators). Some “Other” categories will get hit hard, such as parking officers and door-to-door salesmen.
Most of these shrinking jobs are lower paid, while many of the growing jobs are better paid. Bottom line: advise your kids to consider careers like data security/analysis, or a health care specialty, including management.