GDP Forecasting: Models, Experts, or Markets?

The 2025 first quarter GDP data came in slightly bad: negative 0.3%. I think the number is a bit hard to interpret right now, but it’s hard to spin away a negative number. A big factor pulling down the accounting identify that we call GDP was a massive increase in imports, specifically imports of goods. It’s likely this is businesses trying to front-run the potential tariffs (and keep in mind this was pre-“Liberation Day,” so probably even more front running in April), so the long-run effect is harder to judge.

But aside from the interpretation of the GDP estimate, we can ask a related question: did anyone predict it correctly? I have written previously about two GDP forecasts from two different regional Federal Reserve banks. They were showing very different estimates for GDP!

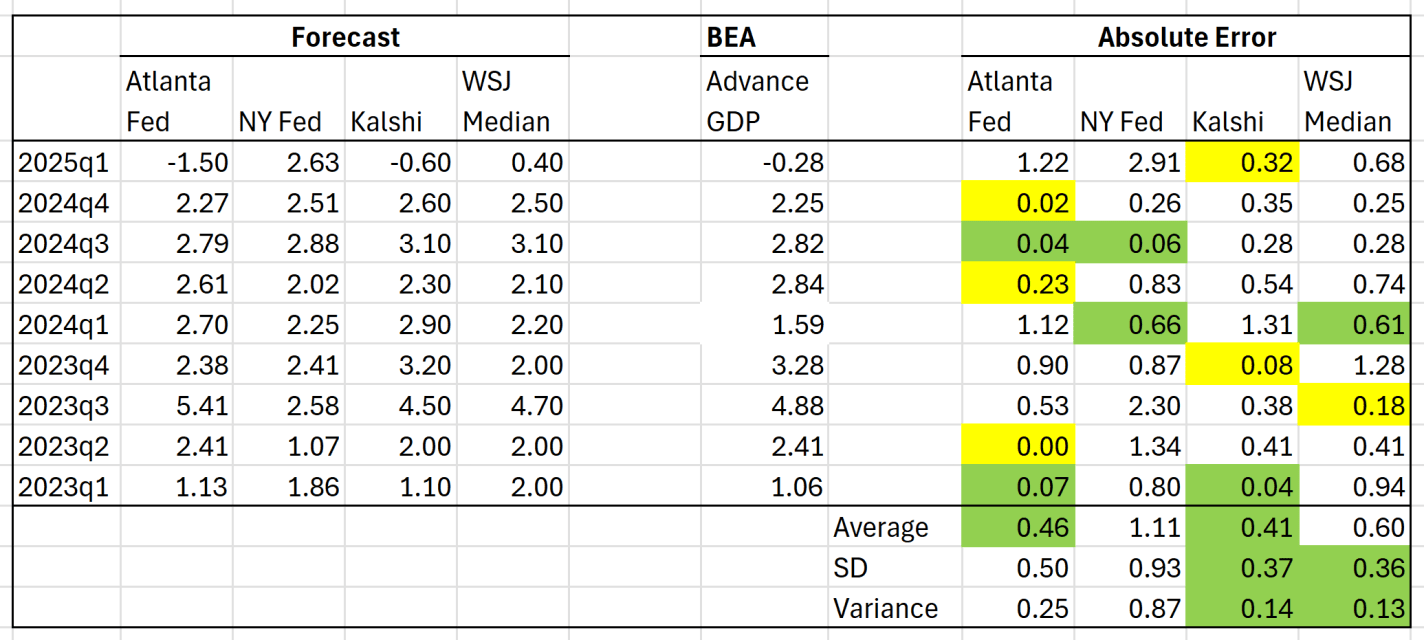
Both the Fed estimates ending up being pretty wrong: -1.5% and +2.6%. But there are two other kinds of forecasts we can look at.

The first is from a survey of economists done by the Wall Street Journal. The median forecast in that survey was positive 0.4%. This survey got the direction wrong, but it was much closer than the Fed models.

Finally, we can look at prediction markets. There are many such markets, but I’ll use Kalshi, because it’s now legal to use in the US, and it’s pretty easy to access their historical data. The average Kalshi forecast for Q1 (a weighted average of sorts across several different predictions) was -0.6%. Pretty close! They got the direction right, and the absolute error was smaller than WSJ survey. And obviously, much better this quarter than the Fed models.

But this was just one quarter, and perhaps a particularly weird quarter to predict (Atlanta Fed even had to update their model mid-quarter, because large gold inflows were throwing of the model). You may say that weird quarters are exactly when we want these models to perform well! But it’s also useful to look at past predictions. The table below summarizes predictions for the past 9 quarters (as far back as the current NY Fed model goes):

Continue reading

A Simple Presidential Election Model, Using Three Economic Variables

As the presidential race finishes out the last two weeks, it’s clearly a close race. In the past I have recommended prediction markets, and right now these are giving Trump about 60% odds. There have been lately a few big bettors coming into the markets and primarily betting on Trump, so there has been speculation of manipulation, but even at 60-40 the race is pretty close to a toss-up.

Another tool many use to follow the election are prediction models, which usually incorporate polling data plus other information (such as economic conditions or even prediction markets themselves). One of the more well-known prediction models is from Nate Silver, who right now has the race pretty close to 50-50 (Trump is slightly ahead and has been rising recently).

But Silver’s model, and many like it, is likely very complicated and we don’t know what’s actually going into it (mostly polls, and he does tell us the relative importance of each, but the exact model is his trade secret). I think those models are useful and interesting to watch, but I actually prefer a much simpler model: Ray Fair’s President and House Vote-Share Models.

The model is simple and totally transparent. It uses just three variables, all of which come from the BEA GDP report, and focuses on economic growth and inflation (there are some dummy variables for things like incumbency advantage). Ray Fair even gives you a version of the model online, which you can play with yourself. Because the model uses data from the GDP report, we still have one more quarter of data (releasing next week), and there may be revisions to the data. So you can play with it (and one of the variables uses the 3 most recent quarters of growth), but mostly these numbers won’t change very much.

What does the model tell us?

Continue reading

Taxes & Unemployment – Know Your Bias?

Say that there is a labor market and that there is no income tax. If an income tax is introduced, then what should we expect to happen? Specifically, what will happen to employment, the size of the labor force, and the number of people unemployed? Will each rise? Fall? Remain unchanged? Change ambiguously? Take a moment and jot down a note to test yourself.

As it turns out, what your answer is depends on what your model of the labor market is. Graphically, they are all quantities of labor. The size of the labor force is the quantity of labor supplied contingent on some wage that workers receive. It’s the number of people who are willing to work. Employment is the quantity of laborers demanded by firms contingent on to wage that they pay. Finally, the quantity of people unemployed is the difference between the size of the labor force and the quantity of workers employed (Assuming that the labor force is greater than or equal to employment).

Continue reading

3 Great Habits from 3 Great Economists

Jumping right in:

Acknowledge Biases

Have you ever tried to do something objectively. It’s impossible. We might try, but how do we know when we’ve failed to compensate for a bias or when we’ve over compensated. Russ Roberts taught me 1) all people have biases, 2) all analysis is by people, & 3) analysis should be interpreted conditional on the bias – not discarded because of it.

The only people who don’t have biases are persons without values – which is no one. We all have apriori beliefs that color the way that we understand the world. Recognizing that is the first step. The second step is to evaluate your own possible biases or the bias of someone’s work. They may have blind spots or points of overemphasis. And that’s OK. One of the best ways to detect and correct these is to expose your ideas and work to a variety of people. It’s great to talk to new people and to have friends who are different from you. They help you see what you can’t.

Finally, because biases are something that everyone has, they are not a good cause to dismiss a claim or evidence. Unless you’re engaged in political combat, your role is usually not to defeat an opponent. Rather, we like to believe true things about the world. Let’s get truer beliefs by peering through the veil of bias to see what’s on the other side. For example, everyone who’s ever read Robert Higgs can tell that he’s biased. He wants the government to do much less and he’s proud of it. That doesn’t mesh well with many readers. But it’d be intellectually lazy to dismiss Higgs’ claims on these grounds. Higgs’ math and statistics work no differently than his ideological opponents. It’s important for us to filter which claims are a reflection of an author’s values, and the claims that are a reflection of the author’s work. If we focus on the latter, then you’ll learn more true things.

Know Multiple Models

In economics, we love our models.  A model is just a fancy word which means ‘argument’. That’s what a mathematical model is. It’s just an argument that asserts which variables matter and how. Models help us to make sense of the world. However, different models are applicable in different contexts. The reason that we have multiple models rather than just one big one is because they act as short-cuts when we encounter different circumstances. Understanding the world with these models requires recognizing context clues so that you apply the correct model.

Models often conflict with one another or imply different things for their variables. This helps us to 1) understand the world more clearly, and 2) helps us to discriminate between which model is applicable to the circumstances. David Andolfatto likes to be clear about his models and wants other people to do the same. It helps different people cut past the baggage that they bring to the table and communicate more effectively.

For example, power dynamics are a real thing and matter a lot in personal relationships. I definitely have some power over my children, my spouse, and my students. They are different kinds of power with different means and bounds, but it’s pretty clear that I have some power and that we’re not equal in deed. Another model is the competitive market model that is governed by property rights and consensual transactions. If I try to exert some power in this latter circumstance, then I may end up not trading with anyone and forgoing gains from trade. It’s not that the two models are at odds. It’s that they are theories for different circumstances. It’s our job to discriminate between the circumstances and between the models. Doing so helps us to understand both the world one another better.

Continue reading

Teaching Price Controls (Poorly)

Economics textbooks differ in their treatment of price controls. None of them does a great job, in my opinion. The reason is mostly due to the purpose of textbooks. Despite what you might suspect, most undergraduate textbooks are not used primarily to give students an understanding of the world. They are often used as a bound list of things to know and to create easy test questions. If a textbook has to change the assumptions of a model too much from what the balance of the chapter assumes, then the book fails to make clear what students are supposed to know for the test.

I think that this is the most charitable reason for books’ poor treatment of price controls – even graduate level books. The less charitable reasons include sloppy exposition due to author ignorance or an over-reliance on math. I honestly would have trouble believing these less charitable reasons.

I picked up 5 microeconomics text books and the below graph is typical of how they treat a price ceiling.

The books say that the price ceiling is perfectly enforced. They identify producer surplus (PS) as area C and consumer surplus (CS) as areas A & B. There are very good reasons to differ with these welfare conclusions.

Problem #1

Continue reading

Have you heard about Human Capital?

While writing a paper recently, I was reminded of the importance of economic modelling.

Macroeconomic models are fun to rag on – everybody does it. But all economic models help us to express our understanding of the world clearly and help us to be specific when the temptation to hand-wave is strong. After all, a model is just a fancy way of saying “a system of logic”.

The paper linked above is several revisions in. What you don’t see are the mistakes that my co-author and I made along the way and the vagueness that we had to resolve. An earlier version of the paper simply stated that deaf people were endowed with less human capital than people who could hear. So far so good. But then we said that it was ambiguous who, the deaf or the hearing, would ultimately have more human capital after making additional human capital investments.

But this is not the case!

Continue reading

Vegetarians and Profits

Like most people, vegetarians have some weird opinions. Let’s assume that they have the ultimate goal of fewer live-stock deaths and less chattel cattle. Ask a vegetarian what they are achieving by choosing not to eat meat and you’ll hear the explanations let loose. By abstaining from meat they’re “reducing factory farm profits” or “helping to keep the price of beef low and unprofitable”. While being a vegetarian may save more cows from the butcher’s blade, it’s not at all clear that vegetarians have a good understanding of their sometimes perpetual boycotts.

What do vegetarians even do?

The decision to consume meat or not falls nicely into the supply-and-demand framework. Fewer people willing to eat meat means fewer purchases of meat products – no matter the price. A decline in meat demand lowers both the number of cows that ranchers will raise a slaughter and the price that they receive. There you have it. By lowering demand for meat, vegetarians reduce both the quantity and price of meat, reducing profits for those evil, animal-carving businessmen.

Not so fast.

Continue reading