Are there racial gaps in the distribution of the COVID-19 vaccine? This is an important and interesting question in its own right. But I’ll talk about this question today because it’s an interesting example of how confusing and sometimes misleading data can be.
How do we answer this question? One is by surveying people. There are a number of surveys that ask this question, but a recent one by the Kaiser Family Foundation finds that among adults 70% of Blacks and 71% of Whites report being vaccinated. And given the sampling error possible with surveys, we would say that these are virtually identical. No racial gap! (Note: there was a racial gap when they did the same survey back in April, with 66% of Whites and 59% of Blacks vaccinated.)
But, surveys are just a sample, and perhaps people are lying. Maybe we shouldn’t trust surveys! And shouldn’t there be hard data on vaccines? Indeed, the CDC does publish data on vaccinations by race. That data shows a fairly large gap: 42.3% of Whites and only 36.6% of Blacks vaccinated. This is for at least one dose, and the percentages are of the total population (which is why it’s lower than the survey data). So maybe there is a racial gap after all!
But wait, if you look closely at the footnotes (always read the footnotes!), you’ll see something curious: the CDC admits that the race data are only available for 65.8% of the data. We don’t have the race information for over one-third of those in this data. Yikes! And given the exist disparities we know about in terms of income and access to healthcare, we might suspect that the errors are not randomly distributed. In other words, if there is probably good reason to suspect that Blacks are disproportionately reflected in the “unknown” category. But we just don’t know.
So what can we do? Since this data comes from US states, we can look at the individual state data and see if perhaps some of it is better (fewer unknowns). What does that data show us?
Conveniently, the Kaiser Family Foundation has combed through the websites of all the state health departments and put this data together for us in a useful table (Figure 3). There are 43 states where they found good data on vaccinations by race. Adding up all those states, they do indeed find a gap: 54% of Whites and just 46% of Blacks are vaccinated. That’s an about an 8-point gap, larger than 6 point gap from the CDC data. Yikes!
But if we look at the states in detail, we’ll find something interesting. First, some states have no gap. Alabama, for example, is first on the list and has equal vaccination rates for Whites and Blacks (42%). And as we run down the list in alphabetical order, strange patterns show up. Alaska and Arizona both have 12 point gaps, but in opposite directions: Alaska has a reverse racial gap, with more Blacks have a much higher vaccination rate. That seems strange! Is Alaska just more equitable and better at distributing vaccines to traditionally underserved populations?
But if we think about the 3 “A” states in this list (no Arkansas on here, sorry!) and their racial composition, something stands out. Alabama, with no racial gap in vaccination, has a very large African-American population: over 25% of the state is Black. Alaska and Arizona have very small Black populations: 3.0% and 4.7%. This suggests a possible explanation: perhaps states with small Black populations are just seeing more random variation in the percent of Blacks vaccinated. We might especially think this is true given what we know from the CDC data: there are lots of unknowns, though as we’ll see this varies a lot by state!
What happens if we compare the racial gaps and the size of the Black population in all of these 43 states? The chart below does that.
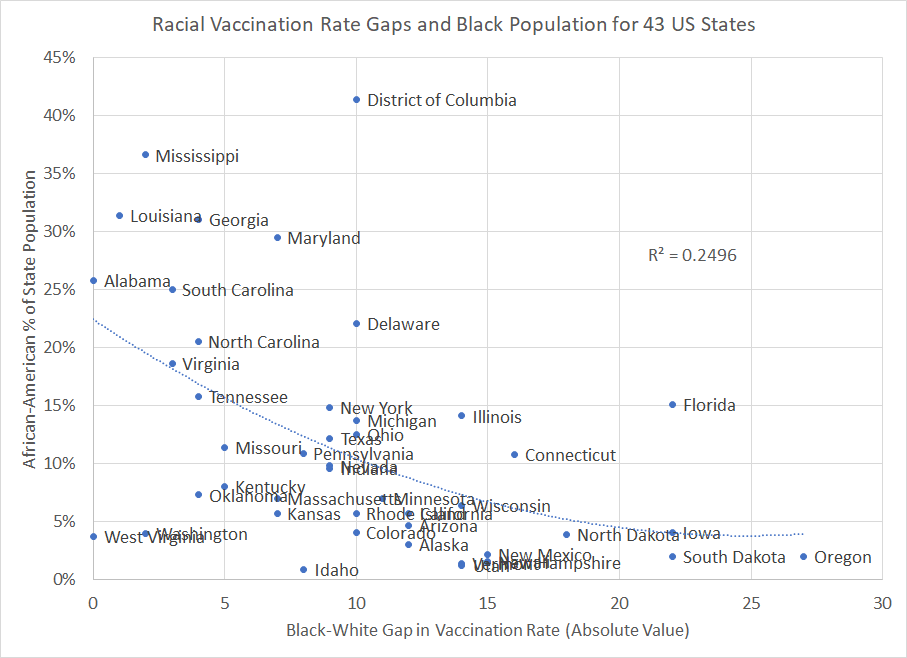
I’ve used the absolute value of the racial gap here (i.e., treating Alaska and Arizona the same) just to see if the widely varying gaps are related to the size of the African-American population. Indeed, there does seem to be some pattern. States with large African-American populations tend to have small racial gaps. States with small Black populations… are all over the place. Overall, about 25% of the variation is related to the African-American population size.
Though we do see a few outliers. DC and Florida seem to jump out, having large racial gaps in vaccinations despite having sizable African-American populations. When we look at these states more closely, we see they have a lot of people who were vaccinated but their race was recorded as “unknown.” DC has 22% of vaccinations with no race category, that’s higher than any state, and bigger than their racial gap (10 percentage points). Florida has 13% with an unknown race, which is slightly small than their racial gap (15 percentage points), but importantly it’s bigger than their Black category, which is just 9 percent of all vaccinations. More unknowns than Blacks in Florida vaccine data!
Clearly, these two states don’t have good enough data to assess this important question. What if we throw out states that look like this, either they: 1.) have an unknown category bigger than the racial gap; or 2.) have an unknown category bigger than the Black category. Doing so gets us down to just 18 states. So it’s a much smaller sample. But, hopefully these are states where we can better assess the data.

(Note: some states don’t even report an “unknown race” category. Is this because they have everyone’s race? Seems unlikely. Or did they just not publish it? We don’t know! Which further speaks to the challenges of working with this data. I included those states in this group of 18, but maybe I shouldn’t have. The data just isn’t that great.)
With this group of 18 states, we can see that my explanation seems to explain the data even better, as over 50 percent of the variation is associated with Black population shares. And for most of the largest Black states in this group with better data (Alabama, Louisiana, and Mississippi), the gaps are general are quite small. Louisiana and Mississippi even have “reverse” gaps where more Blacks than Whites are vaccinated (though it’s very close to equal) — remember, the chart uses the absolute value. Maryland and Delaware do have large gaps and large Black populations, and those gaps are Whites having higher vaccination rates (as are the remaining states in the chart). It may be worth looking into why these two states have large gaps, but Alabama, Louisiana, and Mississippi do not. And Mississippi and Louisiana are also the largest African-American states (Georgia is 3rd, but I dropped them since their unknowns [5%] were slightly larger than their racial gap [4%]).
So what’s the bottom line? Is there a racial gap in vaccinations? I really don’t know. I’m pretty confident there isn’t one in Alabama, Louisiana, or Mississippi. In Maryland and Delaware, there probably is one (though with those states, I do imagine there is a lot of cross-border vaccinations, which makes the data even more challenging to work with). But does North Dakota really have an 18 percentage point gap between Blacks and Whites? I’m skeptical. But we just don’t really know. Blacks are less than 4% of the population of North Dakota, and it’s a really small state, so if you don’t have race data for a few clinics that were frequented heavily by Blacks, your data is probably skewed (plus ND is one state that doesn’t even publish an unknown race category, so we really don’t know!).
I hope this post will at least make you skeptical about whether or not their is a racial gap in vaccinations. But most importantly, I hope it makes you more skeptical about data in general. Always read the footnotes.
