Way back in the late 1970s and early 80s, Kydland and Prescott proposed rational expectations theory. This line of research arose, in part, because the Phillips curve ceased to describe reality well. Amid increasing inflation, people began to anticipate higher prices to a relatively correct degree when making labor, supply chain, and pricing decisions. Kydland and Prescott argued that individuals understand the rules of the game or how the world works – at least on average.
An increase in the money supply would increase total national spending, and increase demand for goods. However, firms also experienced increasing revenues and demanded more inputs such as commodities, capital, and intermediate goods. Because there were no greater productivity earlier in the supply chain, price roses. Firms began to understand that greater demand would eventually find its way to causing greater costs. Therefore, firms began raising prices before the cost of resources rose, increasing their willingness to pay for inputs and, ironically, hastening the increase in input prices. As a result, increases in the money supply began having substantial short-run price effects and negligible output effects.
However, assuming that people understand the rules of our economic system and ‘how the world works’ is hard to swallow. It is not at all clear that the typical economist understands monetary theory, much less clear that the typical person has a good understanding. Fortunately, another theory of expectations can help carry some of the load and achieve similar results.
Adaptive Expectations
Adaptive expectations states that people can have a minimal understanding of how the world works and still be pretty good predictors of the near future. Rather than understand the complex machinations of political and economic forces, people will just expect the recent history to continue. What was the price of pasta last week? Odds are that the price will be little different this week. This way of forming expectations requires almost no logic and simply requires some very narrow knowledge about recent events. Assuming that people form expectations in this way is more tenable to our intuitions about our fellow humans.
Adaptive expectations can also be useful for the researcher. A vector autoregression (VAR) can find the average relationship between a variable and its lags. If people have adaptive expectations that are well described by the VAR, then the VAR can also identify surprises. In time series, we call these ‘shocks’.
Three Inflation Examples*
First, let’s say that PCE price index rises unexpectedly. Here we’ll define ‘expected’ as the change that’s predicted by the last 4 months of price data. So, if there is a shock to prices, then the VAR can tell us what pattern the price level will follow on average. Essentially, it allows people have a ‘normal’ time expectation and a different expectations for when their expectation was wrong. They can say to themselves, “I’ve been wrong before. What happened the last time that I was wrong?”. Below is the effect on price after a 1 standard deviation shock to the price level.
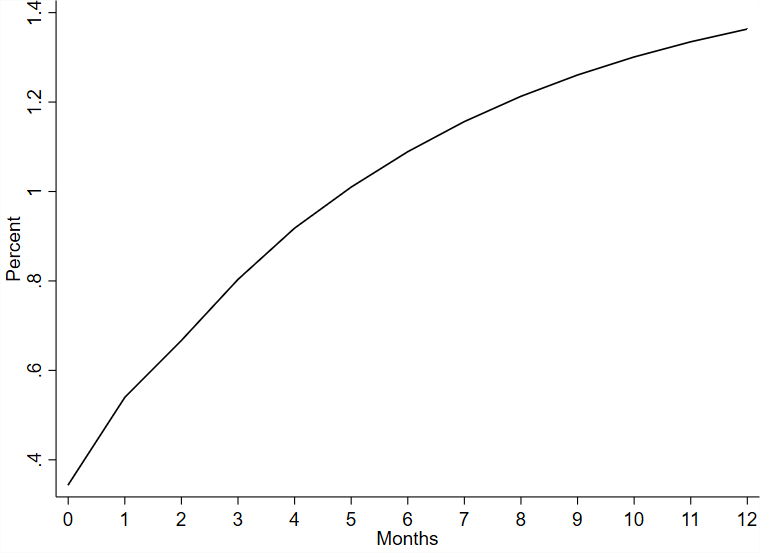
How do we interpret this result? Well, an unexpected shock to the price level will result in, on average, continuing price increases, albeit at a decreasing rate. This is not so informative however. Of course we would see this pattern on average in the US. Prices have being rising for a long time and this particular data reaches back all the way to 1959. So, yes, surprise price increases have always been followed by more increases in the price level.
Inflation
Inflation is more interesting because we’re all asking a similar question. When will inflation fall back to its previous pre-pandemic rate? Ever? The below figure shows us the average aftermath of a 1 standard deviation shock to inflation.
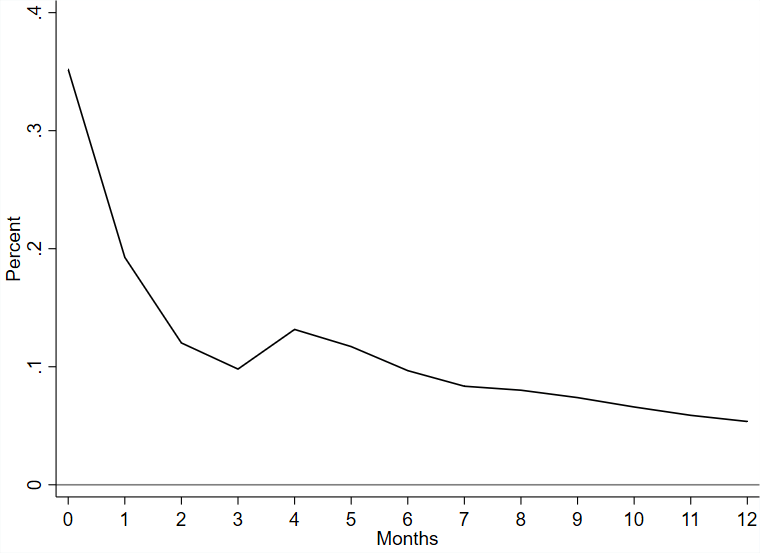
The result demonstrates that the monthly inflation rate falls by half after about 40 days. Then, it takes upwards of eight months to fall by another half. So, if the 7% inflation that we’ve been experience is about 3% surprise, then we can expect the rate of inflation be back down to 5.5% October – if the inflation behavior continues to reflect the past instances of surprise changes. Indeed, the monthly inflation in November 2021 was 0.63%, followed by 0.45% in December. The January numbers will be released next week and, fingers crossed, will be lower still.
Changes in the Change of Inflation
One of the difficulties will adaptive expectations is that, like rational expectations, it also begins to seem absurd. Yes, people will have a decent estimate for next period’s prices. They may even have a good estimate for next period’s inflation. But what stops them from anticipating the change in the rate of change? Or, the change in the change in the rate of change? We can do this all day and there’s little guidance beyond intuition to tell us at what point people stop paying attention. (For those with a calculus background, we can keep taking derivatives or integrals. When does it become unreasonable?) The below figure demonstrates what follows from a 1 standard deviation surprise change in the rate of inflation.
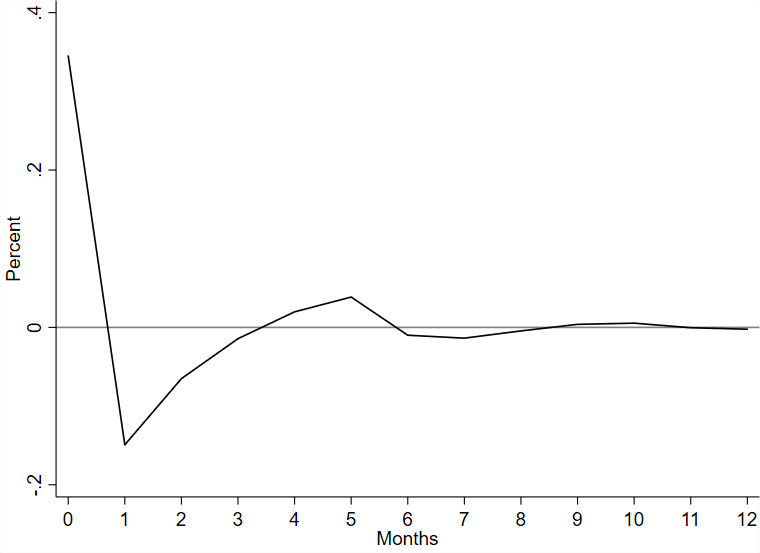
Essentially, the figure is telling us something about concavity. If there is a surprise acceleration in the rate of inflation, then we should expect that the change in inflation quickly becomes concave (rainbow shaped). After 3 months, the concavity oscillates and diminishes.
We can interpret all three graphs together. Say that there is a surprise increase in the price level, inflation, and in the change of inflation First, and obviously, we should expect the price level to continue going up (1st figure). Inflation continues, albeit at a diminishing rate (2nd figure). Finally, we can expect the change in inflation to diminished pretty quickly back to normal after about a quarter (3rd figure).
*For experts in the field, please excuse my statistical violations. I used an AR(4) selected by typical information criteria. All figures show an OIRF of a 1 SD impulse.

I like this post so thanks. I suspect we are more adaptive than rational so the explanation while making some sense is a tough sell because it implies once things have dampened down its all okay when it isn’t. Income for most people rarely match inflationary changes quickly enough and both income and savings can be heavily depleted dealing with the “inflationary shock”. Once the graphs go quiet with more gentle oscillations the damage continues for people trying to pay for housing, food, energy, auto loans etc. Its the human cost that really counts and is so rarely “graphed”.
LikeLike