Black families are the poorest major racial or ethnic group in the US. With a median income of $59,541, a Black family only has about 59 percent of the income of a White, Non-Hispanic family. That’s the same proportion, 59 percent, as was true in 1972, the earliest date that we have comparable data. (For most of the data in this post, I will be using Table F-23 from the Census Bureau’s Historical Income Tables.) That’s almost 50 years with no closing of the racial gap in total money income for families.
Of course, what this also means is that family incomes of both Black and Whites grew at the same rate from 1972 to 2021. They both are about 50 percent larger than in 1972, and that’s after accounting for inflation (using the CPI-U-RS). As a first point of optimism, this very much goes against the typical narrative of income stagnation since the early 1970s.
To be sure, some of this growth is because families have more earners today, but even so: they have a lot more income. Having two earners does mean that you must spend more on some consumption categories, such as daycare when kids are young, possibly more on dining out or prepared meals. But even with those additional expenses, these families will have significantly more disposable income than their 1970s counterparts.
There is an ever more optimistic fact that we need to point out for Black families today: there are many, many more rich Black families today than in 1972. There are more rich families in absolute terms and as a proportion of the total. Here is the basic data from the Census Bureau (it goes back to 1967, the earliest date available for Blacks).
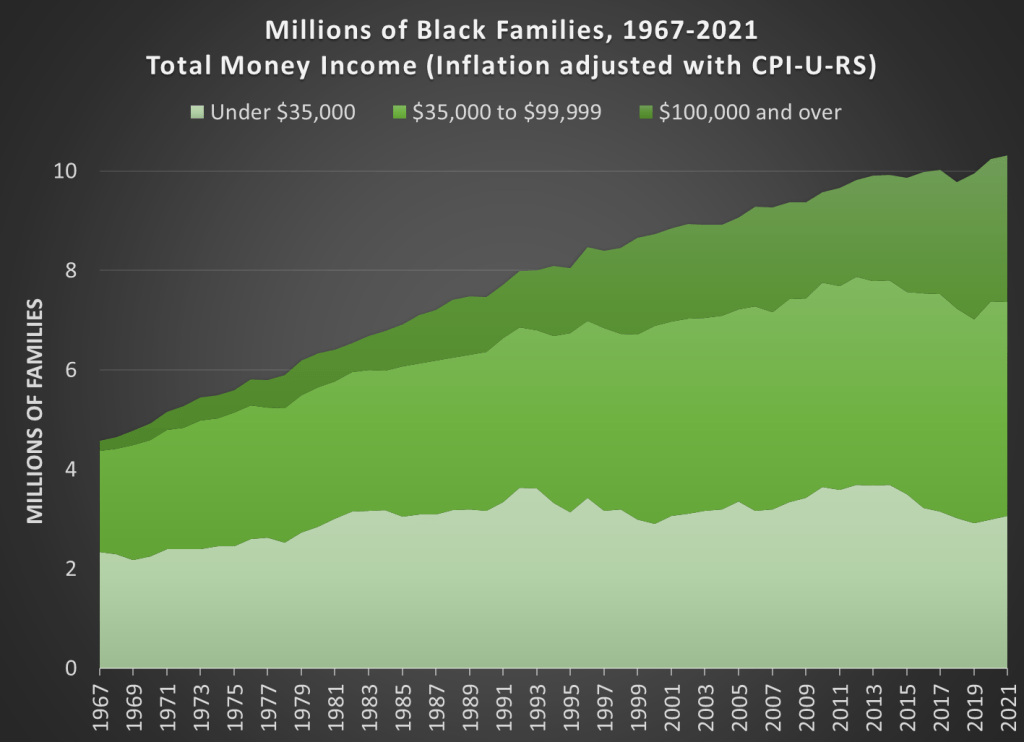
Exactly what we call “rich,” “middle class,” and “poor” is up for some debate. The Census data gives us nine buckets of income in the publicly available data, and I merge these into three groups of three. To me, calling those with over $100,000 is a reasonable definition of being rich, but if you think the correct number is $150,000 or $200,000, you can play around with the data yourself — I think you’ll see that it doesn’t change the story much.
In 1967 there were about 4.6 million Black families in the US (families are defined as related individuals living together, a narrower definition than “households,” who need not be related). Of those 4.6 million families, slightly more than half, about 2.3 million, had incomes under $35,000 (in 2021 inflation-adjusted dollars) — what we can reasonably call poor families, or at least near-poor families. Only 200,000 families, or less than 5 percent, had incomes over $100,000 — there were very few rich Black families.
If you prefer the highest Census cutoff of $200,000, then only 0.3% of Black families were rich in 1967.
By 2021, there were about 10.3 million Black families, of which 3.1 million were still under $35,000. This fact gives some credence to the pessimistic case, since there are more poor Black families today than five decades ago. But notice that proportion of poor Black families is therefore much lower: just under 30 percent. What’s most astonishing is the growth of rich Black families: in 2021 there were 2.9 million of them, almost as many as poor Black families (indeed, in 2019 before the pandemic, there were equal at about 2.9 million each). Thus, about 29 percent of Black families were “rich” by this measure in 2021.
Again, if you prefer the $200,000 level for rich, 7.6 percent of Black families were rich in 2021. In absolute terms, there are about 800,000 very rich Black families in 2021 — that’s 57 times as many as 1967.
The Black middle-class has also grown substantially since 1967. Using the three middle income groups from Census ($35,000 to $100,000), it has more than doubled in absolute terms from 2 million to well over 4 million. It has shrunk slightly as a proportion of the total, but of course for good reason: more Black families are above $100,000. If you prefer to change the definition of middle class slightly, say to the range of $50,000-$150,000, it looks even better: it grew from 1.3 million in 1967 to 4.5 million in 2021, more than tripling! And by this second definition, it grew in percentage terms too (28% to 44%).
Of course, we can’t let the growth of high-income Black families distract us from the reality that almost one-third of Black families still have very low incomes. But we also shouldn’t ignore the growth in rich Black families, as it represents substantial economic progress in just a few generations, and should give us hope that more improvement is possible.

This is encouraging news, but does household wealth (arguably the more important indicator) also show similar gains?
LikeLike
But is not “wealth” also a function of spending?
LikeLike
Aggregate wealth for Black households has increased from about $0.8 trillion ($2 trillion CPI-adjusted) in 1989 to around $6.5 trillion today: https://www.federalreserve.gov/releases/z1/dataviz/dfa/distribute/chart/#quarter:132;series:Net%20worth;demographic:race;population:3;units:levels;range:1989.3,2022.3
LikeLike
Thanks for the link! Too bad there’s no easy way to see per capita statistics (Black families are x% of the population but own y% wealth, for example)
LikeLike