In this brief post, I want to commend a few teaching resources that have been helpful over the past few months of teaching.
For teaching students the nuts and bolts of causal inference, the new Mastering Metrics videos with Josh Angrist on Marginal Revolution University are terrific. The causal animations from Nick Huntington-Klein (and other resources) are also very helpful. This app on linear regression from Luke M. Froeb and Keyuan Jiang is a helpful way to help students gain econometric intuition. They have a companion paper to the app on SSRN.
Joshua Hendrickson recently wrote about the provision of public goods, and how we teach public goods in economics. My post today is not so much a reply to Hendrickson, but is inspired by his mediation on public goods as I gear up to teach another semester of Public Finance.
The theory of public goods that economists discuss among themselves is pretty straightforward: when a good is both non-rival and non-excludable, there is a strong case for government intervention of some sort (though not necessarily public provision). The opposite is true when a good is both rival and excludable: there is a strong case for laissez faire.
Seems simple enough, right? But communicating this concept to undergraduates and the general public has been a major challenge. Part of the confusion arises from the term itself, “public good.” Non-economists tend to use the term interchangeably with the notion of “the common good, as is clear from Wikipedia, a dictionary, or a conversation with your grandma. For this reason, I sometimes substitute the awkward phrase “collective consumption good” (this is actually Samuelson’s term in his classic article on the topic), but all the textbooks so use it so I often default to the standard terminology.
From Jonathan Gruber’s Public Finance and Public Policy
But I think there’s a deeper problem than just terminology. Economists have put themselves in a box. Literally. Here’s a standard 2×2 matrix from Jonathan Gruber’s undergraduate public finance textbook. I don’t mean to pick on Gruber here — this is a pretty standard presentation. You can find it in many microeconomics textbooks too, or on Wikipedia. Everything goes in a box! It’s a nice stylized way to think of the terminology. It makes for nice test questions. But here’s the real problem with it as a pedagogical tool: it doesn’t seem to help many students! Or at least, it doesn’t seem to help them retain the knowledge between their micro principles courses and upper division courses (at least in my experience, I’d be happy to hear others chime in here).
So how can we teach this concept better? I have a few ideas. I’d like to hear yours too.
As I said earlier, I used SAS Viya for Learners this semester. I assigned a final project for students. They had to use the data pre-loaded into the free version of SAS Viya, but otherwise had freedom to select their own variables and construct their own research question.
SAS Viya for Learners just recently opened for any users to make an account. This will allow you to learn SAS Viya functions (but not do your own actual work, because you cannot import new data). I’m using SAS Viya 3.4.
I like the way SAS Viya allows users to create a beautiful intuitive interactive decision tree model. This blog is to show you what that looks like. In traditional EconLit, regressions are more popular than decisions trees. Decision trees are a simple and useful machine learning technique. If you are trying to teach a first-timer about decision trees, then the visualization in SAS Viya for Learners can be helpful.
I’ll demonstrate using a decision tree for classification using built-in SAS data. One of the larger datasets available is USCENSUS1990. I’ll use it to demonstrate (and I do love the 90’s!). Consider the variable about the number of children a person has. This could be reasonably predicted by age and education level. [Footnote 1]
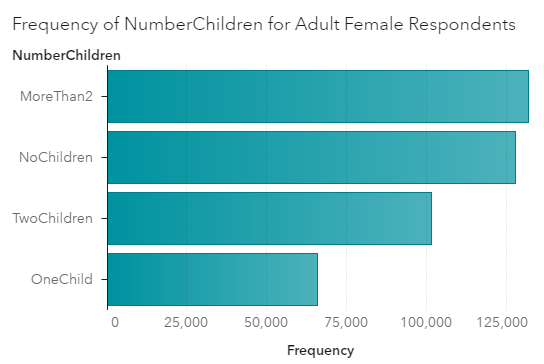
Here’s a chart showing the frequency of family sizes for adult women. (I used a Filter to only include people who are not coded zero in iFertil. See Footnote 1.)
For adult women in 1990, the most frequent category is to have more than 2 children. This would include the parents of Boomers. Think about those big families you know from the Boomer generation.
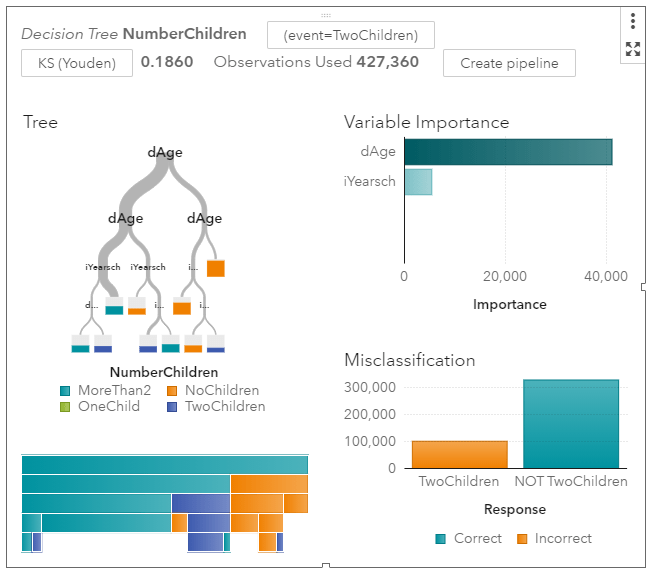
For input variables to my model, I’ll use age categories and also education levels. I set the new categorical variable I created called NumberChildren as the Response variable for a decision tree model. [Footnote 2] Here’s a zoomed out picture of the visual model output.
It’s immediately obvious that age is more informative than schooling. Women under the age of 30 are much more likely to have no children. The width of the grey tree branches makes it easy to see where the majority of the observations are.
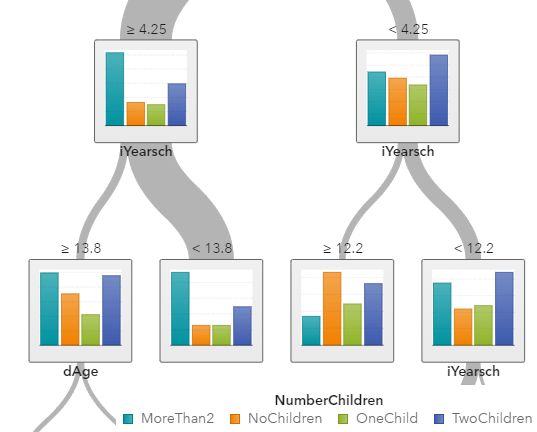
I’ll zoom in on the left side of the tree where most of the people are.
The “>= 4.25” means that women on the far left side are over the age of 40. Among older women, the norm is to have 2 or more children. If you are looking for the older women with exactly two children, you are more likely to find them among those who have an education score of larger than “13”, meaning that they have a Bachelor’s degree or higher.
My point is not to posit causal relationships among education and fertility. My point is how awesome these graphs are. You do have to learn some point-and-click functions within SAS Viya to make them. But I don’t know of any other software that can produce this.
SAS Viya also provides tables and statistics on each node, which is more like what I could get from free open source software a few years ago when I looked into decision tree packages.
[Footnote 1] If you want to replicate what I did, know that the USCENSUS1990 dataset in SAS Viya comes with no explanation. Google brought me to UCI, where I found what I needed in terms of technical documentation.
dAge, iFertil, iSex, iYearsch are the names of the variables you will find in SAS. To create my graphs and models, I converted some of them to categorical variables using the “+New Data Item -> Custom Category” functions. No programming is required.
iSex: 0 indicates Male, 1 indicates Female
dAge is coded as follows: 0 is babies; 1 is under 13, 2 is under 20 (but over 13), 3 is under 30, 4 is under 40, 5 is under 50, 6 is under 65, 7 is for 65 and over
iFertil is coded: 0 is either less than 15 years old or male, 1 is no child, 2 means they have one child (confusing…), 3 means they have two children, all the way up to a 13 which is the code for 12 or more children
iYearsch: 3-10 refers to primary school up to a 10 indicating graduating from high school, 11-13 refer to some college and associate degrees, 14 is a Bachelors degree, 15-17 refers to higher degrees
[Footnote 2] I decided to set Maximum levels to 5 in Options. This keeps the tree smaller which looks better in the blog.
I used SAS Viya for Learners to teach data analytics to undergraduate business students for one semester.
I’ll start with the benefits of SAS Viya: It’s free; It’s visually appealing and requires no coding; There are some SAS tutorial materials that teachers can use; The way decision tree results are displayed makes intuition easy for students who are new to data mining.
I made a post earlier in which I reported that it actually works. I still think that, but at the end of the semester I did have individual students experience errors and mysterious interruptions to service. It made me wonder if the server gets busy at the end of an academic semester.
SAS is known for making excellent products and charging high fees for them. Since SAS Viya is free, they aren’t going to be giving all the functionality with it. The free version does not let students import any data. There is a sandbox of data to learn with, which is more than enough to fill a semester. I didn’t even open most of the available data sets.
My students did their final projects by choosing one of the pre-loaded datasets and using that for analysis. As far as applying the principles I taught, this was fine. In one sense, it was easier than telling them to fend for themselves and find data on the world wide web.
The downside is that the software-specific skills students learn from free student SAS Viya can’t be used on a project for work or for a different class. Eventually, any useful work involves importing new data.
The decision to use SAS Viya for Learners instead of R should depend on what your students want to do next. Both products will allow them to learn concepts and common functions.
If you are going to use SAS Viya, I highly recommend using the tutorials made by SAS with screenshot-by-screenshot instructions. You can give the instructions to the students, so students aren’t coming to you with questions about every click they need to make.
I paired SAS Viya with a Business Intelligence Textbook. Also note that students had already taken a traditional Business Statistics course previously.
I’m going to teach text mining in the upcoming week. Most of my students have never heard of it. We have spent the semester talking about what do to with structured data, which includes some of the basic concepts from traditional statistics.
I often ask them to think about what computers can do. We talk about why “data analytics” classes are happening in 2020 and did not happen in 1990. Hardware and software innovations have expanded the boundaries of what computers can do for us.
The gritty details of how text mining works can make for a boring lecture, so I’m going to use the following narrative to get intellectually curious students on board. It always helps to start with fighting Nazis. Alan Turing helps defeat the Nazis by using a proto-computer to crack codes. The same brilliant Turing was smart enough to realize that computer could play chess someday (acknowledgement for me knowing that trivia: Average is Over). Turing didn’t live to see computers beat humans in chess but, in a sense, it didn’t take very long. Only about 50 years later, computers beat humans at chess.
Maybe chess is exactly the kind of thing that is hard for humans and easy for computers. When we discuss basic data mining, I tell students to think about how computers can do simple calculations much faster than humans can. It’s their comparative advantage.
Could Turing ever have imagined that a human seeking customer service from a bank could chat with a bot? Maybe text mining is a big advance over chess, but it only took about one decade longer for a computer (developed by IBM) to beat a human in Jeopardy. Winning Jeopardy requires the computer to get meaning from a sentence of words. Computers have already moved way beyond playing a game show to natural language processing.
How computers make sense of words starts with following simple rules, just as computer do to perform data mining on a spreadsheet of numbers. As I explain those rules to my students this week, I’m hoping that starting off the lecture with fighting Nazis will help them persevere through the algorithms.
Sometimes I remark to my students, “This is why economists don’t get invited to cocktail parties.” This post is about that.
From 2008 – 2011 I taught a course at Florida State called “Economics of Compassion”. It is a course co-designed with my mentor Mark Isaac. The class discusses historical and contemporary problems related to poverty, both at the domestic and international levels. Having heard about the course, the Social Justice Living Learning Community at Florida State wanted me to teach the course to their incoming freshman.
It was quite different from other courses they were taking that seemed to talk in terms of solutions without regard for scarcity. My role was to put parameters on their utopia and get the students to think carefully about a couple questions related to issues they care about:
Compared to what?
What happens next?
The students seemed to like the class, but, for a committed group of people who want to change the world it was also quite a downer. It was a downer for them the same way economics is a downer for people at cocktail parties.
We start with scarcity. Scarcity is a fact of life. There are never enough resources to satisfy everyone and there will always be unmet desires. For the economist, the notion of trade-offs — you must give up one thing to get another — flow from this scarcity. It means that anytime a solution to a problem is attempted you are always giving something up.
For example, the death of George Floyd this summer sparked conversation about how to reduce police violence. One approaching to curbing this important social problem is to eliminate or reform qualified immunity (QI). This is a legal doctrine intended to protect police and others from frivolous lawsuits. The problem is that QI has made accountability extremely difficult. The logic of reforming QI is that doing so will increase accountability, raise the cost of police violence, and therefore lead to less police violence. That’s good economics.
But, remember there are trade-offs. In a new world where police are opened up to lawsuits, local government might need to increase police compensation to retain or attract qualified men and women. Where does the money come from? Can you reduce the number of police and/or will you have to raise taxes? There are other trade-offs too. Will police become more reluctant to enter dangerous neighborhoods? After all, there is a greater chance that inserting themselves into a risky situation will lead to financial ruin.
Moving from heavy to light. If you haven’t seen Yoram Bauman’s comedic schtick on Principles of Economics Translated, take five minutes and check it out here. As he illustrates, “economic profit” depends on alternatives: A Snickers bar valued at one dollar with no alternative implies an economic profit of $1. However, if the alternative was M&Ms that you value at 70 cents then your economic profit is 30 cents … Your profit from pursuing one course action declines as the value of the alternative increases.
By accounting for trade-offs the net benefit of a course of action goes down. When we bring up trade-offs in conversation, economists effectively eat into people’s mental profits for some course of action.
Another thing to consider, when you’re intervening, that intervention can sometimes have dramatic side effects that you didn’t even think about. You cannot merely move people around as if they’re pieces on a chessboard (head nod to Adam Smith).
For example, it is possible that eliminating qualified immunity leads to less police violence but more neighborhood violence overall if police decide not to insert themselves into situations that could be more costly. Beyond this hypothetical example I have been using, there are loads of other unintended consequences economists talk about.
Thinking in this way is the bread and butter of economists. This is how we see the world. But, don’t try this in social settings. As EconTalk host Russ Roberts once commented (this podcast), a pleasant picnic veered into chilly company when he pointed out someone’s proposed minimum wage could have negative employment effects. The others at the picnic started to inch away from him on the picnic blanket. At parties, I’ve had people talk about the idea that a tax won’t effect them because it is only on sellers, homeowners, etc. I’ve had to ask myself, “Is it worth it to bring up that the tax is likely to be passed through?”
So while my last couple posts sing the praises of economics, I should let you know, at cocktail parties people don’t like to think about scarcity, tradeoffs, and unintended consequences. Economists like to think about the seen and unseen. Many others, especially in social settings, would rather the unseen remain unseen.
In an earlier post, I discussed the idea that memorable and persuasive arguments have the force of logic, credibility, and emotional appeal. Economists who stink at emotional appeal do so to their own detriment. One strategy to make an emotional appeal is to use the power of beauty to promote a sense of wonder and awe (see here). In this post, I discuss the use of experience in the classroom.
This idea really hit home with me in an EconTalk podcast with Milton Friedman. In that episode, Friedman suggested that public appetite for price controls was low — not because economists educated the public on their dangers — but because people still remembered the long waiting lines for gasoline. Once those memories faded, or the people who experienced those lines died, there would be a renewed desire for price controls.
Experience is important. But, the gas lines were a costly way to learn that lesson, especially if the lesson needs to be re-learned in every generation. How can we give students experience at a lower price? We can tell them stories from experiences around the world. I am in favor! I love case studies and their thick descriptions. At some point I will blog about my favorite stories to tell. But, for this post, let me propose the widespread use of classroom experiments.
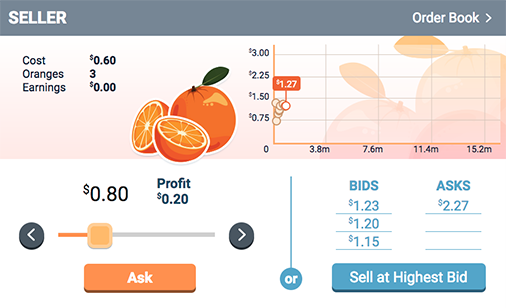
The basic idea of a classroom experiment is to embed students inside an economic environment and give them a goal to maximize. For example, in an experiment on supply and demand students are embedded in a market institution and serve as either a buyer or seller. Their goal is to buy something at a low price or sell at a high price. These experiments can be run either with paper-and-pencil or electronically.
To show how these experiments can result in emotional appeal, let me recount a story. In a unit on price controls, I had students participate in a market without price controls followed by a market with a price ceiling. Back when I taught the Economics of Compassion class at FSU — specifically to the Social Justice Living Learning Community — I remember the following (quoted from here):
“The market without a price control demonstrated smooth convergence to the equilibrium prediction. The double auction with the price ceiling was chaos. Once the frenetic burst of trades stopped, buyers started yelling at sellers, “Post some asks!” and “Why aren’t you selling anything? We’re posting bids, why aren’t you doing anything?” The sellers of course shot back, “If we sell [at the max price] we will lose money!” It was chaos! I remembered that visceral reaction, the frustration, and the silence as all students waited with no trades happening … tick-tock, tick-tock, until the clock timed out. They felt the shortage. Students would stop me on campus (sometimes years later) saying they remembered playing that game.”
Experiments enhance credibility through engaging students in theory testing. But, to close I want to emphasize that experiments also help provoke visceral reactions and audible sighs. Experiments can help provide experiential punch in different institutional contexts at a low price. All of that connects students to the material in a way our logic and credibility alone cannot do.
Currently, I subscribe to Bloomberg Businessweek. Instead of ranking MBA programs, this year they decided to report on a survey of students about switching to online classes. (in the Sept. 21 issue)
Overall, the reaction from students has been negative. They believe an online MBA is not as valuable as the traditional in-person experience.
Something MBA students state, which I have already heard from my own undergraduates, is that it’s difficult to focus during online instruction hours. If your face isn’t being watched through your webcam, then it’s tempting to “multitask” and not pay attention to the professor. I feel the same temptation when I join online research seminars.
What’s the most sympathetic view of this situation? Doing your online classes “isn’t that hard”. I feel like the scold looking over my bifocals at millennials saying, “going to a dry cleaner isn’t that hard”. (We millennials cannot be bothered to go to a dry cleaner.)
Here’s my first and brief thought: College students today have been taught to use screens for recreation by their parents.
Parents put kids in front of screens to get rid of them. I get rid of my own kids by putting them on screens. I ensure that they are not watching something evil.
I hope parents are diligently ensuring that their preteen daughters are not chatting up predators. What responsible parents have been told is to try to limit total screen hours and also to try to keep your child out of the digital equivalent of dark alleys.
That kind of guidance doesn’t teach students how to use screens constructively. They are suddenly being asked by teachers to be constructive on the screen. Some of them can hack it. Some of them can’t. None of them were prepared for this.
Your typical 20-year-old college student today must have done well in traditional classrooms because they did, after all, get admitted to college. But when they were on their screens, they were scrolling and gaming and indulging their impulses. As long as they physically showed up to class on Monday morning and turned in enough homework assignments, no adult was going to make them do chores on screens.
Since screens are here to stay, we need a lot more research on how to raise humans who know how to be responsible on screens.
No answers came to me when posed this question to the hive mind:
Should we gamify more good things or teach our species to do good things without gamification? (If there is a right answer to this question, then many implications follow for teachers.)
In middle school, when I was about 12, I had a rotating non-academic period in my schedule. For at least 6 weeks, I can remember we had a typing class. We would go into the school computer lab and practice “touch typing”. I typed the letter “f” with my left index figure hundreds of times. They made us put a cover over our hands to force us to practice typing without looking.
I resented that class. I hated taking the long way round. I hated typing the letter “f” over and over. Since it’s so boring, I don’t know if I would have forced myself to learn QWERTY touch typing. Part of the value of school is a framework in which you do things that you don’t have the discipline to do on your own. (Tyler Cowen has written somewhere about teachers as coaches, but I could not find the link.)
Looking back, this is the most valuable thing I did in school. I’m writing this post almost as fast as I can think of the words.
Learning to type is not useful if you can’t read or write. I’m not saying that nothing else I did in school was valuable. Also, I recognize that this would not be the most valuable class for every student.
There is the potential for Speech to Text to make touch typing obsolete. I don’t think I would work better that way and I do not personally know any professionals who write using Speech to Text.
We know WAY more about Covid-19 than we used to. But there is plenty of appropriate and inappropriate incredulity concerning the data meaning, validity, and implication. I want to take a minute and give it the good ol’ Stat – 201 college try. Here’s the level-headed and appropriately humble Covid statistics conversation.
B: “Yes, but that’s not important. They are very different countries. After all, 65% of people in Portugal live in urban centers. For the US, that number is 80%. Obviously, people being close together, such as in urban places, will contribute to more Covid cases.”
A: “Ah! And the US also has a Covid positivity rate well in excess of the UK.”
B: “Hmm… That is something. The problem is that the testing is not administered in the same fashion in both places (or across time). That is, neither set of tests is a simple random sample of people and neither is biased in sampling in the same sort of relevant ways.”
A: “But how do you know that the samples aren’t collected in the same sort of ways? Someone feels poorly, then they go and get tested. Isn’t that how is works everywhere?”
B: “Not necessarily at all. Some countries and municipalities offer free testing. Other places have more or less scarcity of tests and surely that affects whom they decide to test. Not only that, different people are differently willing to get tested (maybe they’d have to involuntarily stop working, for example). My point is that the testing samples are not both biased in favor or against positives in the same way and we have little way of telling either the direction or magnitudes. The fact that both countries test a similar proportion of the population doesn’t address the sampling method.”
A: “OK. Well, I suppose that we ought not try at all then, according to you? Isn’t some problematic data better than none?”
B: “Problematic data is not better than none at all if we have good reason to think that there isn’t enough in common between sample collection methods to make valid comparisons.”
A: “Right, so you’re saying that we have to be agnostic.”
B: “In some sense, yes. But rather than Covid cases, we can track relevant variables whose sampling is more comparable. Hospitalizations are better, but we still have the issue of selection bias among those being admitted and a bias due to different hospital capacities between localities. The best measure is the number of deaths due to Covid. People can’t elect out of that sample.”
A: “Hm… Ok. But while total deaths is a more dependable statistic, it is less relevant. Of course deaths matter a great deal, but Covid makes people feel terrible and may even have long term effects.”
B: “You’re right. Covid deaths Vs cases has the trade-off of relevance Vs dependability. Arguably, deaths are the most important possible symptom – although I take your point that it’s not the only relevant symptom. Ultimately, however, the death numbers are more dependable and we should use them if we want a high degree of certainty.”
B: “Yep. You are right. But the US has more Covid cases, so of course it has more Covid deaths than the UK. The correct statistic is, given a Covid diagnosis, how likely are you to die of Covid? In the UK, a much higher proportion of people with a Covid diagnosis die. In other words, Covid is more dangerous in the UK than it is in the US.”
A: “Time out. Two things: 1) Didn’t you say just a moment ago that the testing data wasn’t reliable enough? Now you’re using it as if it’s reliable. 2) If we are making a cross country comparison, then can’t we just say that a person, randomly drawn from the population, is more likely to die from the Covid in the US than in the UK?”
B: “Mea culpa. You’re right on both points. At the end of the day, a US person is more likely to die of Covid. But, in the UK a person with Covid may be more likely to die. So what do we do about that?”