I don’t have an answer, research to reference, or really even ideas regarding the optimal amount of time off. All I know is that I took 5 days off – actually off, with no work to speak of other unless you count reading short stories on a couch as work – and I feel much better. Not that I felt bad before, it wouldn’t even be that noticeable save that working is easier now. Focusing is easier, following through is easier. Enjoying the work is the easier. I never stopped caring, but I had become easier to distract.
Five days isn’t a lot. I didn’t go off the grid for a month. I didn’t try on a new identity in a foreign country. I ate granola with my wife at top of a beautiful mountain, so maybe that counts as eating, praying, and loving. I liked my job before and I still like it now, but sometimes you can end up too deep and caring a little too much, particularly about the bureaucratic details and status-oriented outcomes.
I am firmly team vacation, but with the caveat that your vacation actually be a vacation. Something stimulating and relaxing at the same time. The kind of thing where you are excited to get out of bed to do stuff but also free to do nothing for long languid periods of time, preferably with the hot or cold beverage of your choice.
As for the question presented at the outset, I still don’t know what the optimal length of time is. My closest approximation is a period of time long enough that don’t remember what you were working on the day that you left but not so long that the discontinuity becomes a source of stress and anxiety.
Or maybe its a schedule – 3 days every 2 months, 1 week every year, 1 month every 3 years, 3 months every decade. I’d love to say there is no rule, that you’ll know what you need when you need it, but I didn’t. I might schedule rereading this post every 6 months though.
You can find my paper with Will Hickman “Do people trust humans more than ChatGPT?” at the Journal of Behavioral and Experimental Economics (JBEE) online, and you can download it free before July 30, 2024 (temporarily ungated*).
Did we find that people trust humans more than the bots? It’s complicated. Or, as we say in the paper, it’s context-dependent.
When participants saw labels informing them (e.g. “The following paragraph was written by a human.”) about authorship, readers were more likely to purchase a fact-check (the orange bar).
Informed subjects were not more trusting of human authors versus ChatGPT (so we couldn’t reject the null hypothesis about trusting humans, in that sense). However, Informed subjects were significantly less likely to trust their own judgement of the factual accuracy of the paragraph in the experiment, relative to readers who saw no authorship labels.
Some regulations would make the internet more like our Informed treatment. The EU may mandate that ChatGPT comply with the obligation of: “Disclosing that the content was generated by AI.” Our results indicate that this policy would affect behavior because people read differently when they are forced to think up front about how the text was generated.
Inspiration for this article on trust began with observing the serious errors that can be produced by LLMS (e.g. make up fake citations). Our hypothesis was that readers are more trusting of human authors, because of these known mistakes by ChatGPT. This graph shows that participants trust (left blue bar = “High Trust”) statements *believed* to have been written by a human (so, in that sense, our main hypothesis has some confirmation).
Conversely, in the Informed treatment, readers are equally uncertain about text written either by humans or bots. Informed readers are suspicious, so they buy a fact-check. “High Trust” (the blue bar) is the option that maximizes expected value if the reader thinks the author has not made factual errors.
So, in conclusion, we find that human readers can be made more suspicious by framing. In this case, we are thinking of being cautious and doing a fact-check as a good thing. The reason is that, increasingly, the new texts of society are being written by LLMs. Evidence of this fact has been presented by Andrew Gray in a 2023 working paper: “ChatGPT “contamination”: estimating the prevalence of LLMs in the scholarly literature” Note that is the scholarly literature, not just the sports blogs or the Harry Potter – Taylor Swift- crossover fanfics.
What about the medical doctors? What is the authority on whether you are getting surgery or not? See: “Delving into PubMed Records: Some Terms in Medical Writing Have Drastically Changed after the Arrival of ChatGPT”
At the same time, renewables and nuclear power accounted for roughly half of US electricity in March.
Good morning with good news: Renewables and nuclear power generated 49.4% of USA's electricity in March! RE alone produced 29.85%, with wind and solar at 21.2%.
USA nears its first month in many generations, when fossil fuels will provide less than 50% of its power for a month! pic.twitter.com/uGQ2JDiiSH
— John Raymond Hanger (@johnrhanger) May 29, 2024
If you were wondering why Saudi Arabia is trying to get into the sports business, this is why. They have almost single-handedly held the line on OPEC’s export restrictions, but the strain has become too great. After posting a fiscal deficit for 9 of the last 10 years, Saudi Arabia will spread the burden a little wider, which means accepting a lower price that will, in turn, likely generate (much needed) greater total revenue. The world is moving to a new equilibrium.
Say that there is a labor market and that there is no income tax. If an income tax is introduced, then what should we expect to happen? Specifically, what will happen to employment, the size of the labor force, and the number of people unemployed? Will each rise? Fall? Remain unchanged? Change ambiguously? Take a moment and jot down a note to test yourself.
As it turns out, what your answer is depends on what your model of the labor market is. Graphically, they are all quantities of labor. The size of the labor force is the quantity of labor supplied contingent on some wage that workers receive. It’s the number of people who are willing to work. Employment is the quantity of laborers demanded by firms contingent on to wage that they pay. Finally, the quantity of people unemployed is the difference between the size of the labor force and the quantity of workers employed (Assuming that the labor force is greater than or equal to employment).
Jingi Qui, Tan Chen, Alain Cohn, and Alvin Roth ran a cool field experiment asking the question: does it matter if a prominent economist quote tweets your job market paper? Well, it turns out, yes, it does:
I’m not going to call anyone out, but there was definitely some significant pearl clutching about young careers, IRB, and did the job candidates in the control group give permission to not be retweeted by a prominent economist. I do not care about any of that. I’ll go on the record and say that a) I believe those concerns to be silly and b) if you don’t think they are silly, for your own mental health don’t start digging into how medical science is advanced at the stage of human trials.
What I do care about is the results and what they mean. All publicity is good publicity, doubly so when it implies a famous person has vouched for your paper. It’s the vouching that intrigues me because it’s so weak. It’s a retweeting. It should help you get out of a pile and into a slightly smaller pile. In a job market with a 500-1000 applicants for most positions and only 10-20 first interview slots that lead to 4-7 flyouts, the effect should be trivial. Twenty-five percent additional flyouts is not trivial. If anything it’s catastropic.
“Catastropic” is hyperbole, but this is a blog and that is the currency we deal in.
Twenty-five percent more flyouts are, to me, further evidence of the true source of most of the pathologies of academic economics: we’re overcommitted. We don’t have time to do things like reading papers. This is especially problematic for hiring committees tasked with sorted through 500 to 1000 applicants, each of whom has written a job paper. Careful, dear reader, because you might not like how far this logic can take you.
Why do journal reviews feel so capricious and random? Because the referees don’t have time to read anything or they won’t have time to work on their own submissions. Why does the NBER essentially operate as a club whose principal membership mechanism whether you are a student of a current member at a top 10 school? Because what else are they going to do, read 2000 applicant CVs every year? Why does a three-three teaching load feel utterly damning to those trying to start a research career? Because they marginal cost of additional teaching for someone without any research assistance leaves them a simple choice: no sleep or no research. Do I even have to get into the costs of having children early in careers?
So yeah, if I’m on a hiring committee and someone famous retweets your job market paper, I might just skim it there and then on my computer screen (it’s low marginal cost). It’s there in front of me, so I’ll probably more than read the abstract, I’ll skim the tables and figures too. And that’s all it takes. I’ve got a mandate to come up with a list of 10 candidates I think we should consider interviewing. Who am I to disagree with Famous Economist X when a moment’s humility will put me 10% closer to meeting my obligation?
I’m not saying we’re not star-f…..I’m not saying we’re not status seekers, it’s just that the obsession with status in academia is inframarginal in this context. What’s driving these results is stressed-out folks whose own imposter syndrome makes them incredibly vulnerable to any sort of low-cost information i.e. advertising that offers a new and easy way to economize on their time.
That’s it, that’s the post. I don’t have time to come up with a clever ending.
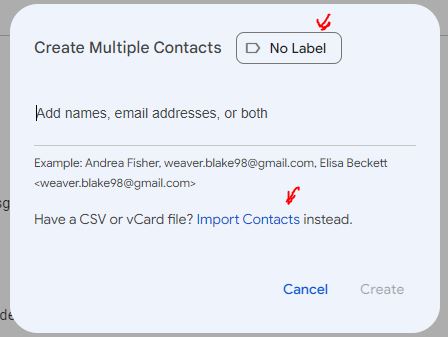
I recently did some business where I had a text file of names and email addresses that I wanted to send a group email to, in Gmail. Here I will share the steps I followed to import this info into a Google contact group.
The Big Picture
First, a couple of overall concepts. In Gmail (and Google), your contacts exist in a big list of all your contacts. To create a group of contacts for a mass email, you have to apply a label to those particular contacts. A given contact can have more than one label (i.e., can be member of more than one group).
To enter one new contact at a time into Gmail, you go to Contacts and Create Contact, and type in or copy/paste in data like name and email address for each person or organization. But to enter a list of many contacts all at once, you must have these contacts in the form of either a CSV or vCard file, which Google can import. So here, first I will describe the steps to create a CSV file, and then the steps to import that into Gmail.
Comma-separated values (CSV) is a text file format that uses commas to separate values. Each record (for us, this means each contact) is on a separate line of plain text. Each record consists of the same number of fields, and these are separated by commas in the CSV file.
A list of names and of email contacts (two fields) might look like this in CSV format:
We could have added additional data (more fields) for each contact, such as home phone numbers and cell numbers, again separated by commas.
For Gmail to import this as a contact list, this is not quite enough. Google demands a header line, to identify the meaning of these chunks of data (i.e., to tell Google that these are in fact contact names, followed by email addresses). This requires specific wording in the header. For a contact name and for one (out of a possible two) email address, the header entries would be “Name” and “E-mail 1 – Value”. If we had wanted to add, say, home phones and cell phones, we could have added four more fields to the header line, namely: ,Phone 1 - Type,Phone 1 - Value,Phone 2 - Type,Phone 2 – Value. For a complete list of possible header items, see the Appendix.
The Steps
Here are steps to create a CSV file of contacts, and then import that file to Gmail:
( 1 ) Start with a text file of the names and addresses, separated by commas. Add a header line at the top: Name, E-mail 1 – Value . If this is in Word, Save As a plain text file (.txt). For our little list, this text file would look like this:
( 2 ) Open this file in Excel: Start Excel, click Open, use Browse if necessary, select “All Files” (not just “Excel Files”) and find and select your text file. The Text Import Wizard will appear. Make sure the “Delimited” option is checked. Click Next.
In the next window, select “Comma” (not the default “Tab”) in the Delimiters section, then click “Next.” In the final window, you’ll need to specify the column data format. I suggest leaving it at “General,” and click “Finish.” If all has gone well, you should see an Excel sheet with your data in two columns.
( 3 ) Save the Excel sheet data as a CSV file: Under the File tab, choose Save As, and specify a folder into which the new file will be saved. A final window will appear where you specify the new file name (I’ll use “Close Friends List”), and the new file type. For “Save as type” there are several CSV options; on my PC I used “CSV (MS-DOS)”.
( 4 ) Go to Gmail or Google, and click on the nine-dots icon at the upper right, and select Contacts. At the upper left of the Contacts page, click Create Contact. You’ll have choice between Create a Contact (for single contact), or Create multiple contacts. Click on the latter.
( 5 ) Up pops a Create Multiple Contacts window. At the upper right of that window you can select what existing label (contact group name) you want to apply to this new list of names, or create a new label. For this example, I created (entered) a new label (in place of “No Label”), called Close Friends. Then, towards the bottom of this window, click on Import Contacts.
Then (in the new window that pops up) select the name of the incoming CSV file, and click Import. That’s it!
The new contacts will be in your overall contact list, with the group name label applied to them. There will also be a default group label “Imported on [today’s date]” created (also applied to this bunch of contacts). You can delete that label from the list of labels (bottom left of the Contacts page), using the “Keep the Contacts” option so the new contacts don’t get erased.
( 6 ) Now you can send out emails to this whole group of contacts. If this is a more professional or sensitive situation, or if the list of contacts is unwieldy (e.g. over ten or so), you might just send the email to yourself and bcc it to the labeled group.
APPENDIX: List of all Header Entries for CSV Files, for Importing Contacts to Gmail
I listed above several header entries which could be used to tell Google what the data is in your list of contact information. This Productivity Portfolio link has more detailed information. This includes tips for using VCard file format for transferring contact information (use app like Outlook to generate VCard or CSV file, then fix header info as needed, and then import that file into Google contacts).
There is also a complete list of header entries for a CSV file, which is available as an Excel file by clicking his “ My Google Contacts CSV Template “ button. The Excel spreadsheet format is convenient for lining things up for actual usage, but I have copied the long list of header items into a long text string to dump here, to give you the idea of what other header items might look like:
I bolded the two items I actually used in my example (Name and E-mail 1 – Value), as well as a pair of entries ( Phone 1 – Type and Phone 1 – Value) as header items which you might use for including, say, cell phone numbers in your CSV file of contact information.
I was watching the most recent episode of Welcome to Wrexam and was horrified to see another athlete with the wisdom to start planning for their future only for their time and money to be guided into a high risk, low payoff investment.
Stop!
If you are a professional athlete, actor, musician- if you are anyone in a career whose dollar rewards are front-loaded within careers that are short and hard to forecast – please, in the name of Shaquille O’Neal and all that is holy, do not take the money that needs to be the foundation of your family’s financial wellbeing and throw it into endeavors that are more likely to melt it down than grow and prosper.
Ok, Mr Know It All Economist, What should I do with myself and my money?
Great question, let’s start with what you shouldn’t do.
Don’t invest your money in anything cool. Your peak income earning years are likely behind you. You can’t afford to be paid in cool. Everything balances out in the wash. If something is cool to invest in (art, music, memorabilia, fashion, film, etc) then it pays out that much less monetarily.
Don’t invest your time or money in anything that priortizes the economic outcomes of everyone but you. You’re heavily specialized, which means you may have managers, agents, publicists, etc. You’re a gravy train for others and that train is going to slow down one day. Your job is to ensure your future, not theirs.
Don’t insist on maintaining the same economic trajectory. Trying to match or beat your peak athletic earnings is going lead you to taking on too much risk. Look for skills and opportunities that accessible that offer a career you can imagine doing for 20 years. Leverage your connections, skills, public awareness, and interests.
Try to tame your instincts towards overconfidence. You were in the top 0.01% of the population for your previous athletic endeavor. You are highly unlikely to be at the same level of elite excellence at your next profession. Look for something you are likely to be good at. Good can and may turn into great, but don’t assume it from the start.
Ok, but what does that add up to? What should I actually do?
Fine, here you go.
Invest most of your money in S&P 500 index funds.
Buy a house in a place you want to live long term. However much house you think you should buy, get 25% less.
Look for a job. Don’t overconcern yourself with the salary, focus on skill acquisition. If need by, take an internship or two.
If there is a field you want to work in, yes, even a cool one, and someone gives you an opportunity to work and learn, by all means go for it. But if they ask you for money, run away as fast as you can.
Take risks with your time and your feelings (it’s been a long time since you were bad at something!), not with your money.
It’s ok to make less money and in less exciting ways. Ninety-nine percent of people can’t be wrong.
I’m going to be in Montana later this summer and I’d like to solicit our readers for travel suggestions. Three days in Helena, two and a half in Bozeman. I will have a car, but Glacier and Yellowstone National Parks are likely going to be too difficult to squeeze in given the brevity. Where should I go? Should food be a consideration beyond basic caloric needs? I know 5 days is shockingly brief for big sky country, but that’s why I’m coming to you!
I’m in the process of writing a review of Jon Haidt’s book The Anxious Generation. I wrote some preliminary thoughts a few weeks ago, but I’m diving a lot deeper now, so watch for that review soon. But one of the main startling pieces of data in the book is the dramatic rise in suicides among young girls. Haidt isn’t the first to point this out, but in large part his book is an attempt to explain this rise (as well as the rise among boys and slightly older girls).
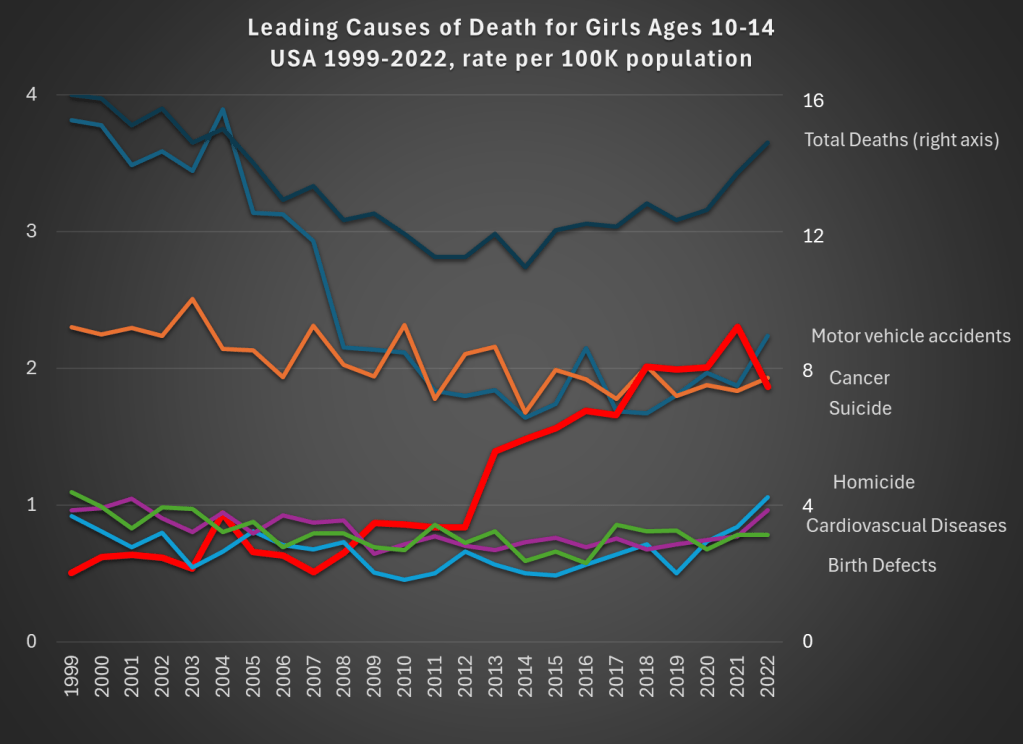
This got me thinking a bit more broadly about not just suicides, but all causes of mortality among young Americans. So in the style of my 2022 post about the leading causes of death among men ages 18-39, let’s look at the historical trends for deaths among girls 10-14 in the US.
Data comes from CDC WONDER. The top dark line shows total deaths, and the scale for total deaths is the right-axis. Notice that for total deaths, there is a U-shaped pattern. From 1999 to about 2012, deaths for girls aged 10-14 are falling. Then, the bottom out and start to rise again. While the end point in 2022 is lower than 1999 (by about 9 percent), there is a 22 percent increase from 2010 to 2022.
What’s driving those trends? A fall in motor vehicle accidents (blue line, the leading cause of death in both 1999 and 2022) is driving the decline. This category fell 41 percent over the entire time period: a big drop for the leading cause of death!
But the rise in suicides (thick red line) starting in 2013 is the clear driver of the reversal of the overall trend. Suicides for this demographic in 2022 were 268 percent higher than 1999, and 116 percent higher than 2010. Haidt and others are right to investigate the causes of this trend (I’m not convinced they have the complete answer, but more on that in my forthcoming book review).
There has been no clear trend in cancer deaths over this time period, and the combination of all the three of these trends means that roughly equal number of girls ages 10-14 die from car accidents, suicide, and cancer.
What can we learn from this data? First, we should acknowledge just how rare death is for girls ages 10-14. At 14.8 deaths per 100,000 population, it is the lowest 5-year age-gender cohort, other than the ages just below it (ages 5-9, for both boys and girls). But just because it is small doesn’t mean we should ignore it. The big increase, especially in suicides, in the past decade is worrying and could be indicative of broader worrying social trends (and suicides have risen for almost every age group too, see my linked post above).
If a concern, though, is that we are over-protecting our kids and this is leading them to retreat into a world of social media, we might want to see if there are any benefits of this overprotection in addition to the costs. The decline in motor vehicle accidents is one candidate. Is this decline just a result of the overall increase in car safety? Or is there something specific going on that is leading to fewer deaths among young teens and pre-teens?
As we know from other data, a lot fewer young people are getting driver’s licenses these days, especially compared to 1999 (and engaging in fewer risky behaviors across the board). Of course, 10-14 year-olds themselves usually weren’t the ones getting licenses — they are too young in most states — but their 15 and 16 year-old siblings might be the ones driving them around. Is fewer teens driving around their pre-teen siblings a cause of the decline in motor vehicle deaths? We can’t tell from this data, but it is worth investigating further (note: best I can tell, only about 23 percent of the decline is from fewer pedestrian deaths, though in the long-run this is a bigger factor).
Social tradeoffs are hard. If there really is a tradeoff between fewer car accident deaths and more suicides, how should we think about that tradeoff? Or is the tradeoff illusory, and we could actually have fewer deaths of both kinds? I don’t think I know the answer, but I do think that many others are being way too confident that they have the answer based on what data we have so far.
One final note on suicides. For all suicides in the US, the most common method is suicide by firearm: about 55% of suicides in the US were committed with guns in 2022, with suffocations a distant second at about 25%. For girls ages 10-14, this is not the case, with suffocation being by far the leading method: 62% versus just 17% with firearms. I only mention this because some might think the increasing availability of firearms is the reason for the rise in suicides. It could be true overall, but it’s not the case for young girls.