Two years ago I wrote about post about how long it took consumer prices to double in the US. The most recent time period looked pretty good compared to most of the 20th century. But lately I’ve seen a lot of social media posts talking about prices doubling (e.g., “you need twice as much income as the 1990s to match the standard of living back then”), so it’s worth looking at again.
The results aren’t that different:
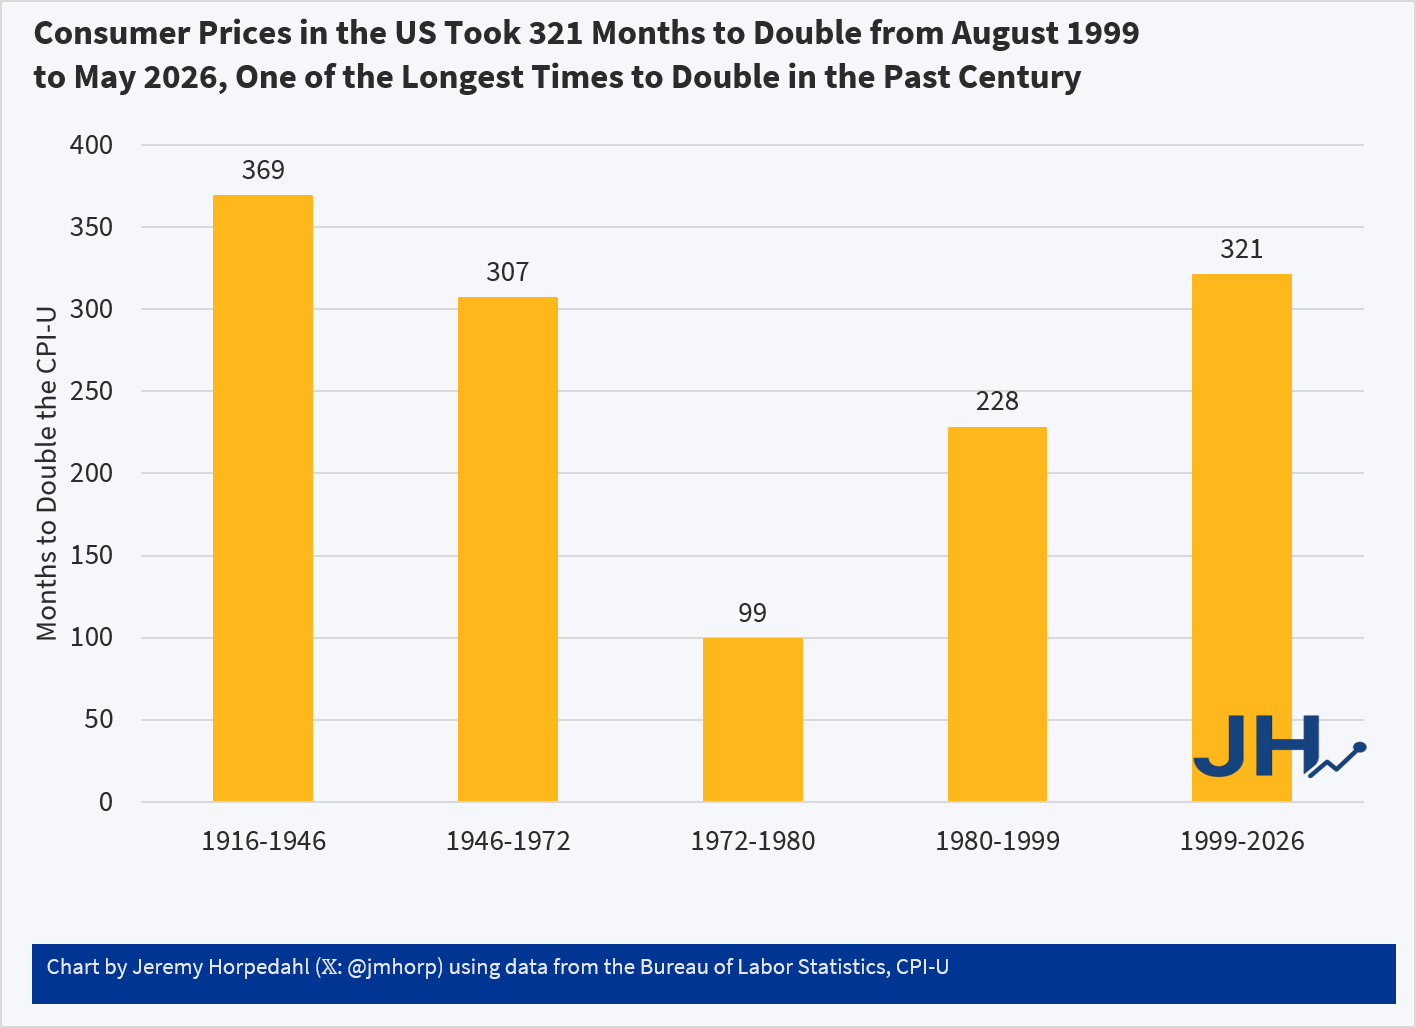
Using the CPI-U, consumer prices in the US doubled in the most recent 321 months. Not only is that a longer period of time to double than most of the 20th century, in the prior 321 months (November 1972 to August 1999) consumer prices doubled twice: nominal prices were almost 4 times higher in August 1999 than in November 1972!
While the CPI-U does slightly overstate inflation, we don’t get much different results if we used chained indexes. For example, using the PCEPI, it took 390 months for prices to double between October 1993 and April 2026. Either way, prices roughly doubling from some time in the 1990s to today is accurate. But wages have more than doubled since then: you only have to go back to July 2005 for average wages to double (they are up 139% since August 1999 and 190% since October 1993). Or if we use a median wage series (such as EPI’s using CPI data), nominal wages doubled from 2002 to 2025 (I have readjusted that series back to nominal wages). In real terms, median wages are 22 percent since 1999 and 29 percent since 1993.
Of course, it would be better if prices weren’t doubling over any time frame! But the most recent doubling of prices that we lived through is the longest period to double in the lifetime of almost everyone alive in the US today.
