Do Required Personal Finance Classes Work?

41 states now require students to take a course in economics or personal finance in order to graduate high school:

Source: Council for Economic Education

12 states representing 21% of US high schoolers passed mandates for personal finance classes just since 2022. This sounds like a good idea that will enable students to navigate the modern economy. But does it work in practice?

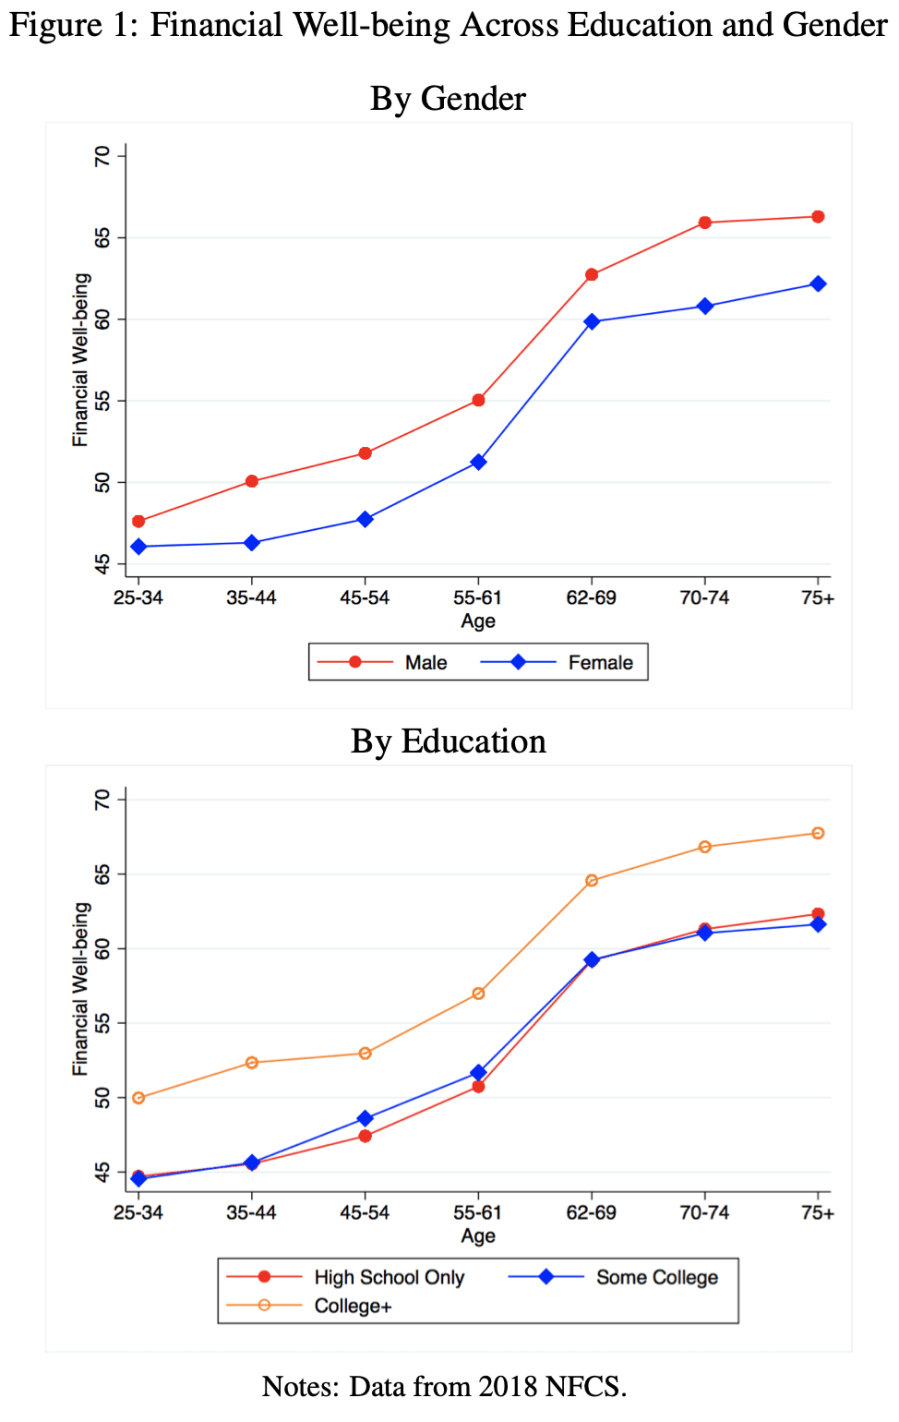
A 2023 working paper “Does State-mandated Financial Education Affect Financial Well-being?” by Jeremy Burke, J. Michael Collins, and Carly Urban argues that it does, at least for men:

We find that the overall effects of high school financial education graduation requirements on subjective financial well-being are positive, between 0.75 and 0.80 points, or roughly 1.5 percent of mean levels. These overall effects are driven almost entirely by males, for whom financial education increases financial well-being by 1.86 points, or 3.8 percent of mean financial well-being.

The paper has nice figures on financial wellbeing beyond the mandate question:

As soon as I heard about the rapid growth in these mandates from Meb Faber and Tim Ranzetta, I knew there was a paper to be written here. I was glad to see at least one has already tackled this, but there are more papers to be written: use post-2018 data to evaluate the new wave of mandates, evaluate the economics mandates in addition to the personal finance ones, and use a more detailed objective measure like the Survey of Consumer Finances.

There’s also more to be done in practice, hiring and training the teachers to offer these new classes:

our estimates are likely attenuated due to poor compliance by schools subject to new financial education curriculum mandates. Urban (2020) finds evidence that less than half of affected schools may have complied. As a result, our estimated overall and differential effects may be less than half the true effects

The Growth of Family Income Isn’t Primarily Explained by the Rise of Dual-Income Families

Alex Tabarrok was kind enough to share a chart of mine showing that one-third of families in the US have incomes greater than $150,000. This is a massive increase since the 1960s, or even since the 1980s.

In addition to questions about inflation adjustments and general disbelief, one of the more common questions about this data is how much of it is driven by rising dual-income families, where both the husband and wife work (for purposes of this post, I will look only at opposite-sex couples, since going back to the 1960s this is the only way we can really make consistent comparisons).

In short: most of the growth of high-income families can not be explained by the rise of dual-income families. The basic reason is that the growth in dual-income families had mostly already occurred by the 1980s or 1990s (depending on the measure). So the tremendous growth since about 1990, when just about 15 percent of families were above $150,000 (in 2024 dollars), is better explained by rising prosperity, not a trick of more earners.

You can see this in a number of ways. First, here is the share of married couples where both spouses are working. I have presented the data including all married couples (blue line), as well as only married couples with some earners (gold line), since the aging of the population is biasing the blue-line downwards over time.

Continue reading

META Stock Slides as Investors Question Payout for Huge AI Spend

How’s this for a “battleground” stock:

Meta stock has dropped about 13% when its latest quarterly earnings were released, then continued to slide until today’s market exuberance over a potential end to the government shutdown. What is the problem?

Meta has invested enormous sums in AI development already, and committed to invest even more in the future. It is currently plowing some 65% (!!) of its cash flow into AI, with no near-term prospects of making big profits there. CEO Mark Zuckerberg has a history of spending big on the Next Big Thing, which eventually fizzles. Meta’s earnings have historically been so high that he can throw away a few billion here and there and nobody cared. But now (up to $800 billion capex spend through 2028) we are talking real money.

Up till now Big Tech has been able to finance their investments entirely out of cash flow, but (like its peers), Meta started issuing debt to pay for some of the AI spend. Leverage is a two-edged sword – – if you can borrow a ton of money (up to $30 billion here) at say 5%, and invest it in something that returns 10%, that is glorious. Rah, capitalism! But if the payout is not there, you are hosed.

Another ugly issue lurking in the shadows is Meta’s dependence on scam ads for some 10% of its ad revenues. Reuters released a horrifying report last week detailing how Meta deliberately slow-walks or ignores legitimate complaints about false advertising and even more nefarious mis-uses of Facebook. Chilling specific anecdotes abound, but they seem to be part of a pattern of Meta choosing to not aggressively curtail known fraud, because doing so would cut into their revenue. They focus their enforcement efforts in regions where their hands are likely to be slapped hardest by regulators, while continuing to let advertisers defraud users wherever they can get away with it:

…Meta has internally acknowledged that regulatory fines for scam ads are certain, and anticipates penalties of up to $1 billion, according to one internal document.

But those fines would be much smaller than Meta’s revenue from scam ads, a separate document from November 2024 states. Every six months, Meta earns $3.5 billion from just the portion of scam ads that “present higher legal risk,” the document says, such as those falsely claiming to represent a consumer brand or public figure or demonstrating other signs of deceit. That figure almost certainly exceeds “the cost of any regulatory settlement involving scam ads.”

Rather than voluntarily agreeing to do more to vet advertisers, the same document states, the company’s leadership decided to act only in response to impending regulatory action.

Thus, the seamy underside of capitalism. And this:

…The company only bans advertisers if its automated systems predict the marketers are at least 95% certain to be committing fraud, the documents show. If the company is less certain – but still believes the advertiser is a likely scammer – Meta charges higher ad rates as a penalty, according to the documents. 

So…if Meta is 94% (but not 95%) sure that an ad is a fraud, they will still let it run, but just charge more for it.  Sweet. Guess that sort of thinking is why Zuck is worth $250 million, and I’m not.

But never fear, Meta’s P/E is the lowest of the Mag 7 group, so maybe it is a buy after all:

Source

As usual, nothing here should be considered advice to buy or sell any security.

Bright Mornings Help Parents

In the United States, most people just turned their clocks back one hour for the end of Daylight Saving Time. This annual ritual happens in fall when we “gain” an extra hour of sleep but also notice that the sun starts setting earlier in the evening.

For many of us, we get, once again, bright daylight at least 30 minutes before the kids are due at school. In most parts of the country, that means sunrise is now somewhere between 6:30 and 7:00 a.m. This helps families who are trying to get moving, find shoes, and make breakfast before the first bell rings. The morning light makes it feel to kids like the day is starting as opposed to Mom trying to “make them get up.”

Although every child and schedule is different, sunlight helps parents navigate the morning with their dependents.

I hear people complain every year that they can’t hang out with friends in the daylight after work once the clocks change. I understand that. It’s not easy to balance all these competing needs. If I were only in charge of myself, I could imagine getting up in total darkness and finishing work with a couple of hours of daylight left to enjoy. I think I could handle that just fine. But as a society, with kids, parents, teachers, bus drivers, and caregivers all trying to operate on a shared schedule, it seems reasonable to prioritize morning light. That’s when the essential stuff happens. If it helps parents, consider keeping it.

A last note for parents: If this system is going to work, turn off devices and screens at some reasonable time such as before 8:30pm. Otherwise, the world practically turning on its axis to help you (okay, I’m exaggerating) won’t do much good. The blue light from phones, tablets, and televisions suppresses melatonin, the hormone that helps us fall asleep, and tricks the brain into thinking it’s still daytime. As a bonus, if you were hoping your kid would read more, they might read before bed if it’s the only thing they are allowed to do. Reading a paper book with a normal light does not mess up the sleep schedule so much.

The brilliant thing about reading to kids who are in bed is that, if they aren’t paying attention, you can turn out the light and tell them they are going to sleep 5 minutes early.  This works best if it’s pitch-black dark outside at bedtime. Stop scrolling and go to sleep (if you are reading this after dark).

Some people deal with different circumstances close to the poles like seasonal depression. I have no advice about that, although the technology of sun-mimicking lamps is available. Maybe that’s why Americans are moving to the sun belt with air conditioning.

Interesting discussion and map on Twitter/X here https://x.com/benryanwriter/status/1985382840167457110?s=46

Optimal Portfolio Weights

All of us have assets. Together, they experience some average rate of return and the value of our assets changes over time. Maybe you have an idea of what assets you want to hold. But how much of your portfolio should be composed of each? As a matter of finance, we know that not only do the asset returns and volatilities differ, but that diversification can allow us to choose from a menu of risk & reward combinations. This post exemplifies the point.

1) Describe the Assets

I analyze 3 stocks from August 1, 2024 through August 1, 2025: SCHG (Schwab Growth ETF), XLU (Utility ETF), and BRK.B (Berkshire Hathaway). Over this period, each asset has an average return, a variance, and  co-variances of daily returns. The returns can be listed in their own matrix. The covariances are in a matrix with the variances on the diagonal.

The return of the portfolio that is composed of these three stocks is merely the weighted average of the returns. In particular, each return is weighted by the proportion of value that it initially composes in the portfolio. Since daily returns are somewhat correlated, the variance of the daily portfolio returns is not merely equal to the average weighted variances. Stock prices sometimes increase and decrease together, rather than independently.

Since the covariance matrix of returns and the covariance matrix are given, it’s just our job to determine the optimal weights. What does “optimal” mean? This is where financiers fall back onto the language of risk appetite. That’s hard to express in a vacuum. It’s easier, however, if we have a menu of options. Humans are pretty bad at identifying objective details about things. But we are really good at identifying differences between things. So, if we can create a menu of risk-reward combinations, then we’re better able to see how much a bit of reward costs us.

2) Create the Menu

In our simple example of three assets, we have three weights to determine. The weights must sum to one and we’ll limit ourselves to 1% increments. It turns out that this is a finite list. If our portfolio includes 0% SCHG, then the remaining two weights sum to 100%. There are 101 possible pairs that achieve that: (0%, 100%), (1%,99%), (2%,98%), etc. Then, we can increase the weight on SCHG to 1% for which there are 100 possible pairs of the remaining weights: (0%,99%), (1%, 98%), (2%, 97%), etc. We can iterate this process until the SCHG weight reaches 100%. The total number of weight combinations is 5,151. That means that there are 5,151 different possible portfolio returns and variances. The below figure plots each resulting variance-return pair in red.

Continue reading

Economic Freedom Updates

In September we covered the release of the Fraser Institute’s 2025 Economic Freedom of the World report. I said then:

The authors are doing great work and releasing it for free, so no complaints, but two additional things I’d like to see from them are a graphic showing which countries had the biggest changes in economic freedom since last year, and links to the underlying program used to create the above graphs so that readers could hover over each dot to identify the country

Well, now Matthew Mitchell of the Fraser Institute has done that:

I can only post a screenshot of a scatterplot here, but if you click through to the Fraser report you can hover over any dot to see which country it represents:

The Supreme Court Case on Trump’s Tariffs

Today is a big day not only for Supreme Court watchers, but for everyone following economic policy: the Court will hear oral arguments for the case Learning Resources, Inc. v. Trump. The case concerns whether Trump’s tariffs imposed under the International Emergency Economic Powers Act are legal, which includes the famous “Liberation Day” tariffs from April 2025.

You should be able to livestream the arguments from the SCOTUS website starting at 10am ET (though it may start a little later). SCOTUS blog has a liveblog which should cover most of the legal arguments, but if you want to follow the economic arguments there are several people you can follow on Twitter, such as Scott Lincicome and Phil Magness (you can follow me too).

Is Tesla Stock Grossly Overpriced?

One of the more polarizing topics in investing is the valuation of Tesla stock. Its peers among the Magnificent 7 big tech leaders sport price/earnings ratios mainly in the 30s. Those are high numbers, but growth stocks deserve high P/Es. A way to normalize for expected growth of earnings is to look at the Price/Earnings/Growth (PEG) ratio. This number is usually 1.5-2.0 for a well-regarded company. Anything much over 2 is considered overvalued.

Tesla’s forward P/E of about 270 is nearly ten times higher than peers. Its anticipated growth rate does not seem to justify this astronomical valuation, since its PEG of around 4-10 (depending on assumptions) is way higher than normal. This seems to be a case of the CEO’s personal charisma dazzling shareholders. There is always a new “story” coming out to keep the momentum going.

Tesla’s main actual business is selling cars, electric cars. It has done a pretty good job at this over the past decade, supported by massive government subsidies. With the phasing out of these subsidies by the U.S. and some other governments, and increasing competition from other electric carmakers, it seems unlikely that this business will grow exponentially. Ditto for its smallish ($10 billion revenue) business line of supplying large batteries for electric power storage. But to Tesla fans, that doesn’t really matter. Tesla is valued, not as a car company, but as an AI startup venture. Just over the horizon are driverless robo-taxis (whose full deployment keeps getting pushed back), and humanoid Optimus robots. The total addressable market numbers being bandied about for the robots are in the trillions of dollars.

Source: Wikipedia

From Musk’s latest conference call:

Optimus is Tesla’s bipedal humanoid robot that’s in development but not yet commercially deployed. Musk has previously said the robots will be so sophisticated that they can serve as factory workers or babysitters….“Optimus will be an incredible surgeon,” Musk said on Wednesday. He said that with Optimus and self driving, “you can actually create a world where there is no poverty, where everyone has access to the finest medical care.”

Given the state of Artificial General Intelligence, I remain skeptical that such a robot will be deployed in large numbers within the next five years. It is of course a mind-bending exercise to imagine a world where $50,000 robots could do anything humans can do. Would that be a world where there is “no poverty”, or a world where there is no wealth (apart from the robot owners)? Would there be a populist groundswell to nationalize the robots in order to socialize the android bounty? But I digress.

On the Seeking Alpha website, one can find various bearish articles with the self-explanatory titles of, for instance, Tesla: The Dream Factory On Wall Street, Tesla: Rallying On Robotaxi Hopium, and Tesla: Paying Software Multiples For A Car Business – Strong Sell . There are also bullish pieces, e.g. herehere, and here.

Musk’s personal interaction with shares has propped up their value. He purchased about $1 billion in TSLA shares in September. This is chicken feed relative to its market cap and his net worth, but it apparently wowed TSLA fans, and popped the share price. What seems even more inexplicable is the favorable response to a proposed $1 trillion (!!) pay package for Elon. For him to be awarded this amount, Tesla under his watch would have to achieve hefty boosts both in physical production and in stock market capitalization. But… said package would be highly dilutive (like 12%) to existing shareholders, so, rationally they should give it thumbs down. However, it seems likely that said shareholders are so convinced of Musk’s value that they will approve this pay package on Nov 6, since he has hinted he might leave if he doesn’t get it.

Such is the Musk mystique that shareholders seem to feel that giving him an even greater stake in Tesla than he already has  will cause hundreds of billions of dollars of earnings appear from thin air. From the chatter I read from Wall Street professionals, they view all this as ridiculous magical thinking, yet they do not dare place bets against the Musk fanbase: the short interest in TSLA stock is only a modest 2.2%. Tesla is grossly overvalued, but it will likely remain that way as long as Elon remains and keeps spinning grand visions of the future.

Fresh observations of Americans working hard

It has been over 100 years since GK Chesterton visited America. I wrote about his observations on the American “enthusiasm for work” for Liberty Fund.

Henry Oliver commented on much the same thing this week in The American art of being busy.

The whole place was as busy as a hive. It went on and on. Everyone was cheerful. No-one fussed and bothered.

And what of the Americans who are not allowed to work because of the government shutdown? Here is a guy who has rapidly found a way to work in DC again and seems “cheerful”: This furloughed IRS lawyer is living out his dream of being a hot dog vendor

This restlessness and energy likely has something to do with us being currently in the lead for the race to AI. Ho hum… building God while still having the equivalent of the GDP of a small country to drop on Halloween trinkets.

Looking Ahead: Post-Powell Interest Rates

Jerome Powell’s term as Fed Chair ends in late May 2026. President Trump has said that he will nominate a new chair and the US senate will confirm them. It may take multiple nominations, but that’s the process. The new chair doesn’t govern monetary and interest rate policy all by their lonesome, however. They have to get most of the FOMC on board in order to make interest rate decisions. We all know that the president wants lower interest rates and there is uncertainty about the political independence of the next chair. What will actually happen once Jerome is out and his replacement is in?

The treasury markets can give us a hint. The yields on government debt tend to follow the federal funds rate closely (see below). So, we can use some simple logic to forecast the currently expected rates during the new Fed Chair’s first several months.

Here’s the logic. As of October 16, the yield on the 6-month treasury was 3.79% and the yield on the 1-year treasury was 3.54%. If the market expectations are accurate, then holding the 1-year treasury to maturity should yield the same as the 6-month treasury purchased today and then another one purchased six months from now. The below diagram and equation provide the intuition and math.

Since the federal funds rate and US treasury yields closely track one another, we can deduce that the interest rates are expected to fall after 6 months. Specifically, rates will fall by the difference in the 6-month rates, or about 49.9 basis points (0.499%).  This cut is an expected value of course. Given that the cut is between a half and a zero percent, we can back out the market expectation of for a 0.5% vs 0.0% cut where α is the probability of the half-point cut.* Formally:

Continue reading