The Blue Wave Was Not That Surprising If You Followed Prediction Markets

The election last night was clearly a victory for Democrats. But was it a surprise? For the most part, no, especially if you follow prediction markets. Here’s what the Senate map looked like on ElectionBettingOdds.com the night before the election:
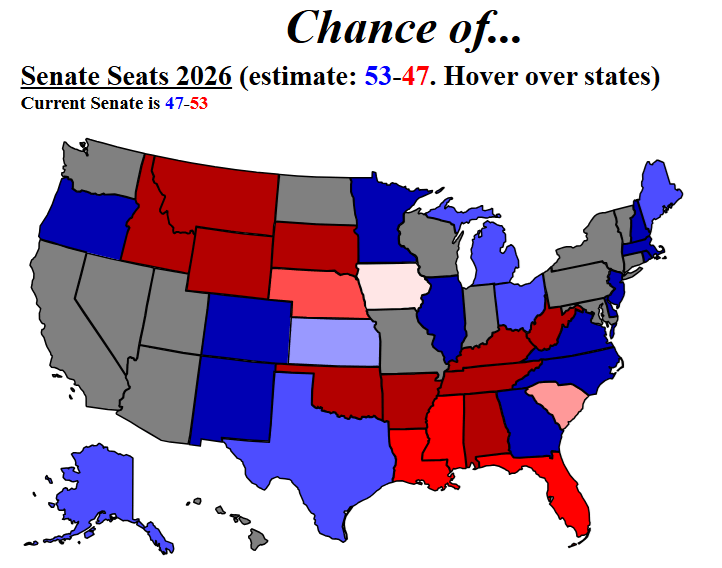
Of course, there are still a few surprises on that map, such as Iowa, South Carolina, and maybe Mississippi. But only Mississippi was a huge surprise. Betting markets had Iowa as a toss-up, and South Carolina as 2/1. And even in Mississippi, the Democrat had 1-in-7 chances based on the average across three betting markets. 1-in-7 chances do happen sometimes! None of the states that were solid blue or red on the map (indicating >90% chances) went the other way. But even without those three races, it was clear that Democrats were the favorite (even if the extent of their domination wasn’t completely clear the day before).

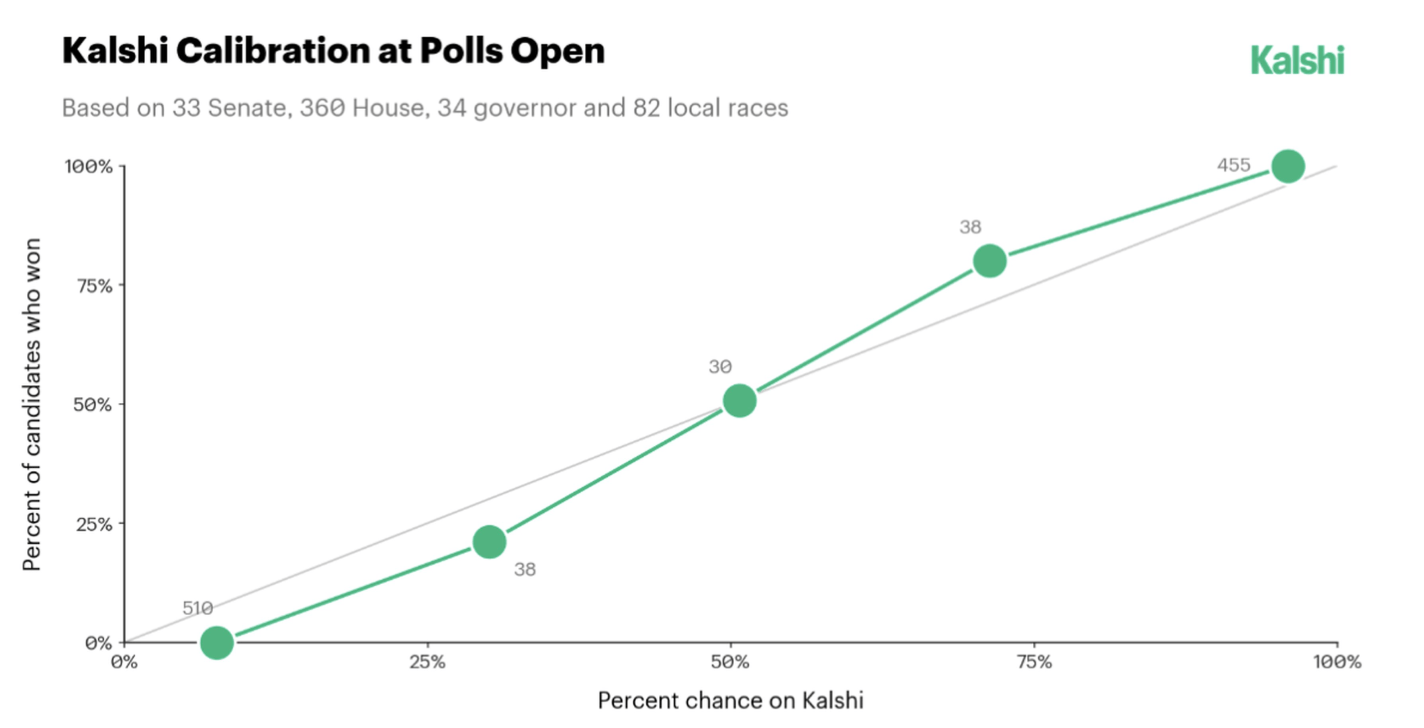
And these are not just a few cherry-picked results from one election. A recent paper published in PNAS shows that across a wide variety of outcomes, prediction markets are “well calibrated” — that is, events with X% probability on prediction markets tend to happen… about X% of the time!
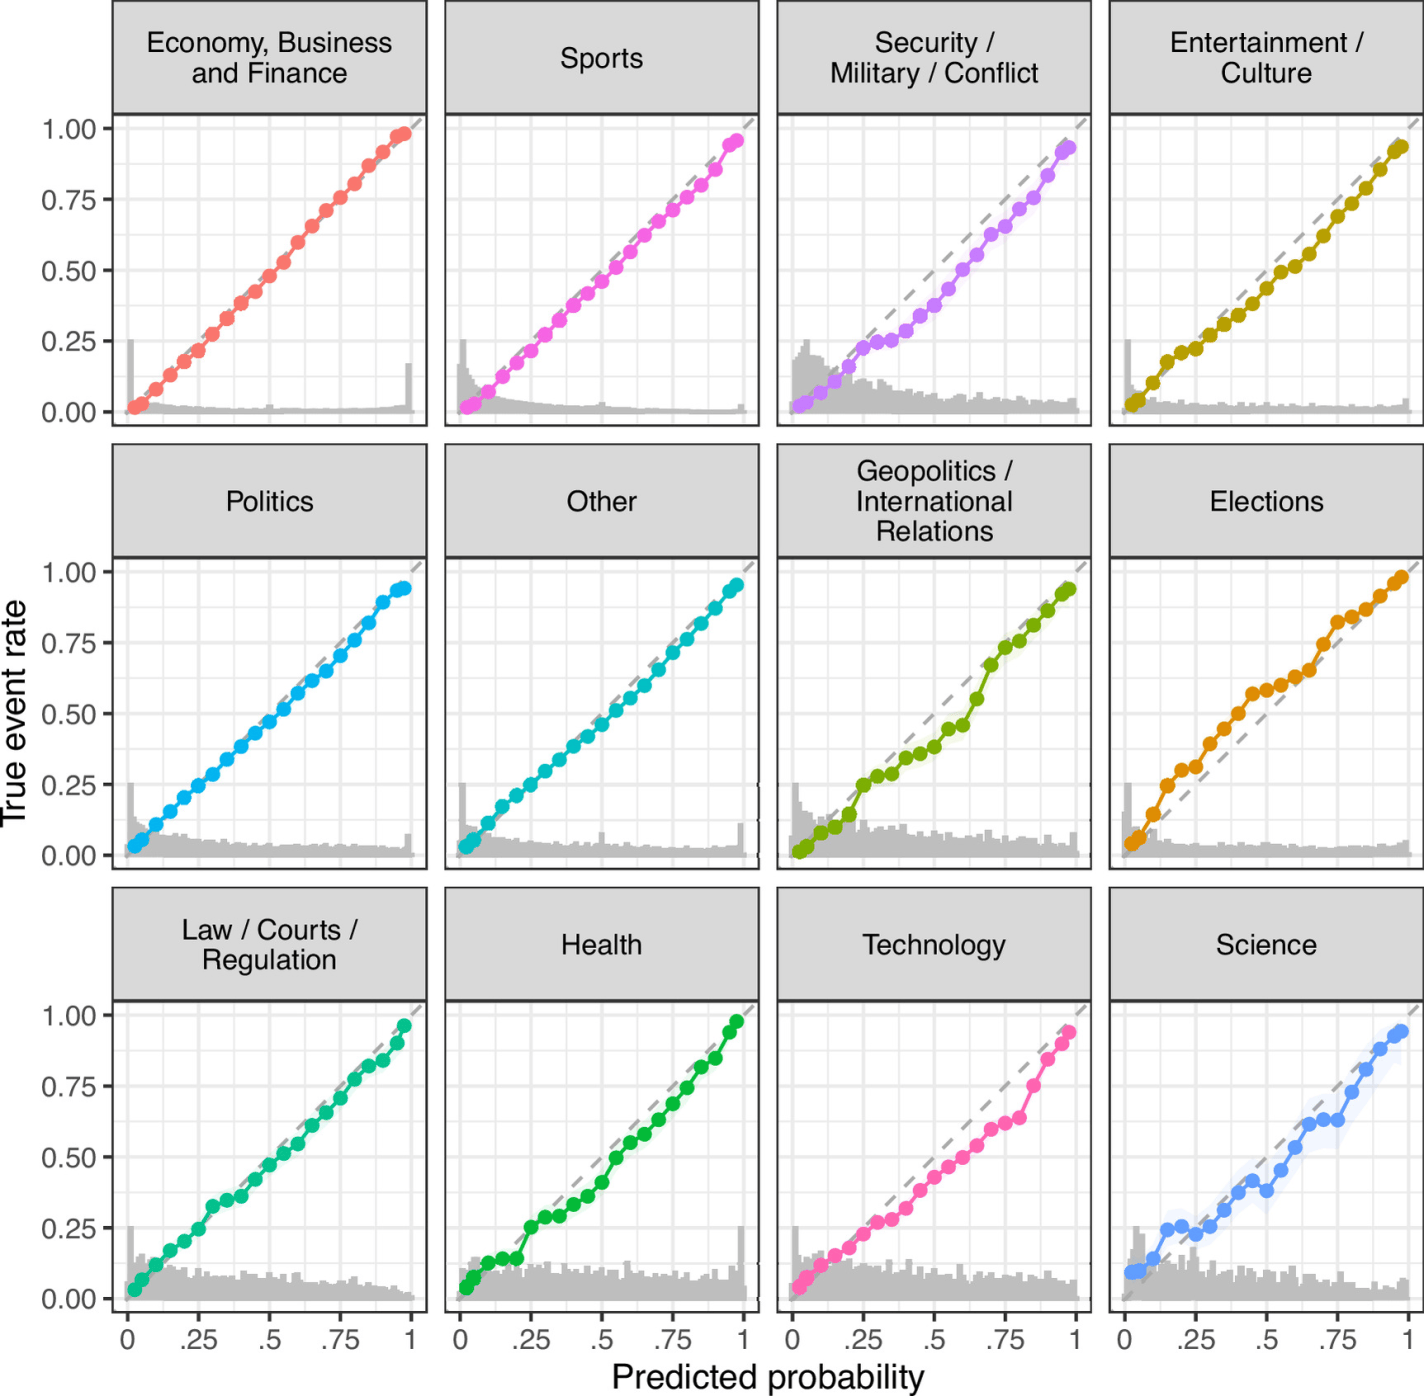
UPDATE: Here’s a calibration Kalshi just provided for the 2026 midterms:
Follow the Money in Politics

As we enter election season, I can sympathize with those that want to ignore it as much as possible. But if you do want to follow it closely, here is my advice: talk is cheap, so follow the money.

And by money, I am not referring to campaign contributions. I mean prediction markets, where people are putting their money where their mouth is, rather than just making predictions based on their own intuition (or their own “model,” which is just a fancy intuition).

There are a number of betting markets online today, but a good aggregator of them is Election Betting Odds.

For example, here is their current prediction for which party will win the Presidency:

Continue reading →

The Only Analysis of the Pennsylvania Senate Debate That You Need To Read

Last night the major party candidates for Senate in Pennsylvania had their first and only debate. I didn’t watch it, since I don’t live in Pennsylvania. But judging by my Twitter feed, a lot of people did watch it, including (bizarrely to me) lots of people who don’t live in Pennsylvania. And overnight, tons of articles were written analyzing the debate, saying who “won” the debate, and so on (“5 Things You Need to Know About the Pennsylvania Senate Debate” etc.).

But this blog post is the only thing you need to read about that debate. And these charts are really all you need to look at.

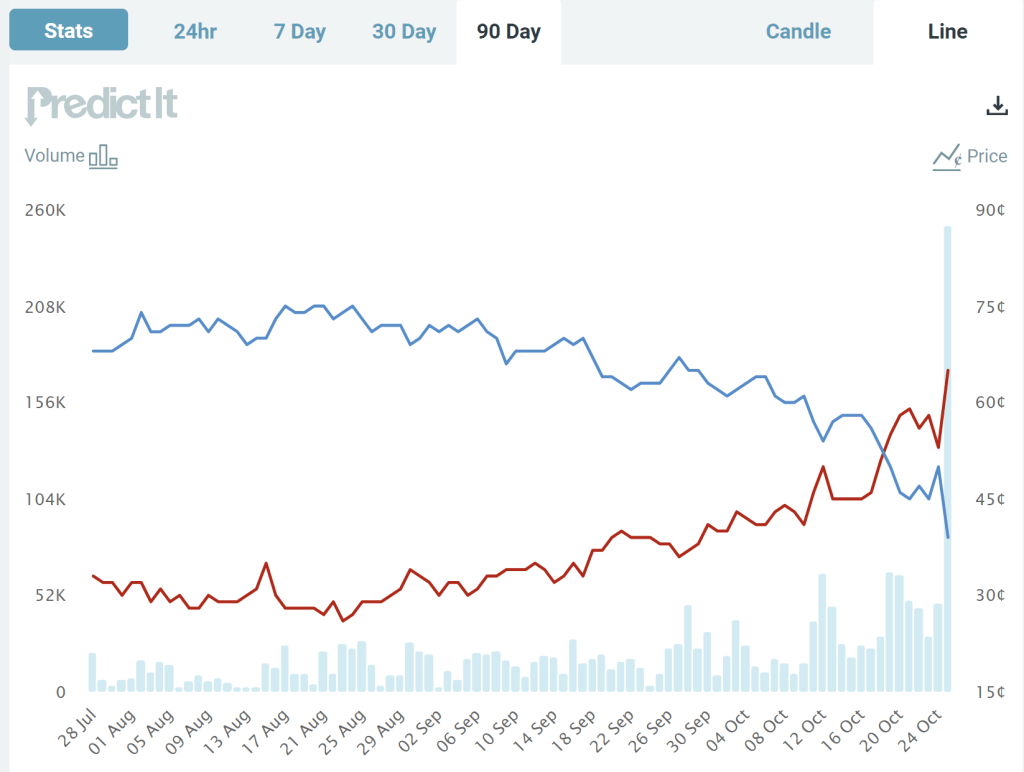
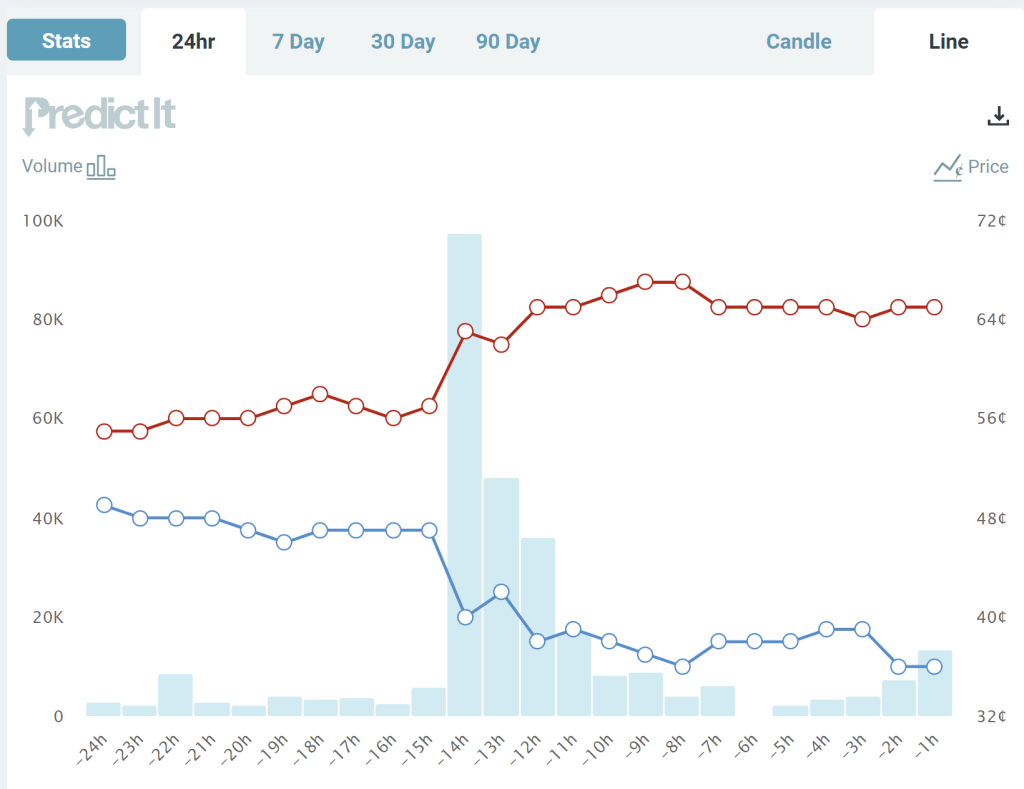
These two charts come from the prediction market website PredictIt. The charts show the “odds” (more on that below) that each candidate will win the Pennsylvania Senate race, over a 90-day time horizon (first chart) and the last 24 hours (second chart). What do we see? The Democratic candidate has been leading for the entire race up until a week ago, though with his odds falling gradually over the past month or two.

Notice though the big jump last night during the debate. The Republican candidate moved up from odds of about 57% to odds of about 63%, close to where it stands as I write (67%). Based on this result, it’s safe to say that the Republican candidate “won” the debate, though not so decisively that the election is now a foregone conclusion. You don’t need to wait for the polls, which have consistently showed the Democratic candidate in the lead (though with the gap closing in recent weeks) — though of course, these betting odds could change as new polling data is released.

But where do these odds come from?

Continue reading →