Structure Integrated Panels (SIP): The Latest, Greatest (?) Home Construction Method

Last week I drove an hour south to help an acquaintance with constructing his retirement home. I answered a group email request, looking for help in putting up a wall in this house.
I assumed this was a conventional stick-built construction, so I envisioned constructing a studded wall out of two by fours and two by sixes whilst lying flat on the ground, and then needing four or five guys to swing this wall up to a vertical position, like an old-fashioned barn raising.

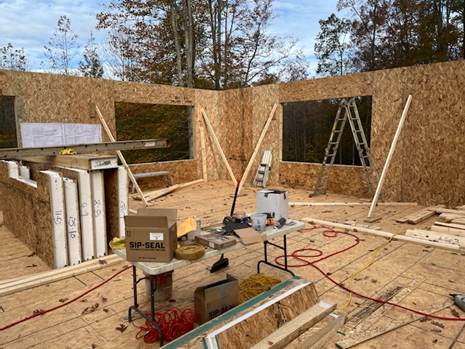
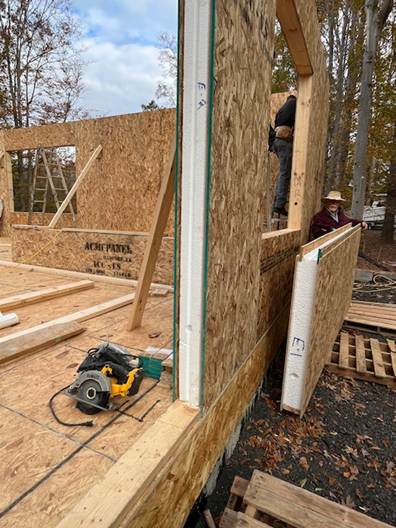
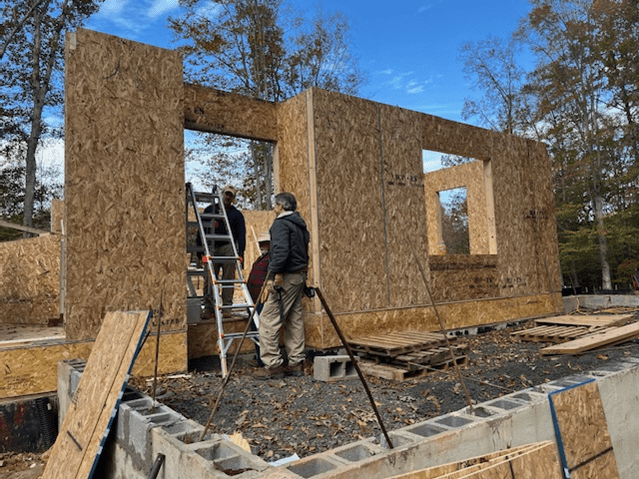
But that wasn’t it at all. This house was being built from Structure Integrated Panels (SIP). These panels have a styrofoam core, around 5 inches thick, with a facing on each side of thin oriented strandboard (OSB). (OSB is a kind of cheapo plywood).


The edges have a sort of tongue and groove configuration, so they mesh together. Each of the SIP panels was about 9 feet high and between 2 feet and 8 feet long. Two strong guys could manhandle a panel into position. Along the edge of the floor, 2×6’s had been mounted to guide the positioning of the bottom of each wall panel.


We put glue and sealing caulk on the edges to stick them together, and drove 7-inch-long screws through the edges after they were in place, and also a series of  nails through the OSB edges into the 2×6’s at the bottom. Pneumatic nail guns give such a satisfying “thunk” with each trigger pull, you feel quite empowered. Here are a couple photos from that day:


The homeowner told me that he learned about SIP construction from an exhibit in Washington, DC that he attended with his grandson. The exhibit was on building techniques through the ages, starting with mud huts, and ending with SIP as the latest technique. That inspired him.

(As an old guy, I was not of much use lifting the panels. I did drive in some nails and screws. I was not initially aware of the glue/caulk along the edges, so I spent my first 20 minutes on the job wiping off the sticky goo I got all over my gloves and coat when I grabbed my first panel. My chief contribution that day was to keep a guy from toppling backwards off a stepladder who was lifting a heavy panel beam overhead).

We amateurs were pretty slow, but I could see that a practiced crew could go slap slap slap and erect all the exterior walls of a medium sized single-story house in a day or two, without needing advanced carpentry skills. Those walls would come complete with insulation. They would still need weatherproof exterior siding (e.g. vinyl or faux stone) on the outside, and sheetrock on the inside. Holes were pre-drilled in the Styrofoam for running the electrical wiring up through the SIPs.

From my limited reading, it seems that the biggest single advantage of SIP construction is quick on-site assembly. It is ideal for situations where you only have a limited time window for construction, or in an isolated or affluent area where site labor is very expensive and hard to obtain (e.g., a ski resort town). Reportedly, SIP buildings are mechanically stronger than stick-built, handy in case of earthquakes or hurricanes. Also, an SIP wall has very high insulation value, and the construction method is practically airtight.

SIP construction is not cheaper than stick built. It’s around 10% more expensive. You need perfect communication with the manufacturer of the SIP panels; if the delivered panels don’t fit properly on-site, you are hosed. Also, it is tough to modify an SIP house once it is built.

Because it is so airtight, it requires some finesse in designing the HVAC system. You need to be very careful protecting it from the walls from moisture, both inside and out, since the SIP panels can lose strength if they get wet. For that reason, some folks prefer to not use SIP for roofs, but only for walls and first-story flooring.
For more on SIP pros and cons, see here and here.

The Growth in Wealth is Not Primarily Driven by Rising Home Prices

As I have discussed in many previous blog posts, young people today have a lot more wealth than past generations at the same point in their life. But we also know that housing prices have increased dramatically in recent years, and that for most families their home is their largest source of wealth.

Does this imply that the increase in wealth young Americans have seen is primarily driven by increased housing prices? If so, this would paint a less optimistic picture of the wealth of young people today, since the value of your home that you usually can’t easily convert into other consumption.

If we look at the past 5 years (2019Q4 to 2024Q4), the total wealth US households under the age of 40 increased by $5 trillion, in nominal terms. That’s not adjusted for inflation, but we don’t need to do so because we can look at how much each asset class increased in nominal terms as well. The total value of assets for households under age 40 increased by $5.86 trillion.

Here’s how the various classes of assets have increased since 2019Q4:

Continue reading

Spending on Necessities Has Declined Dramatically in the United States

Has it gotten easier or harder for Americans to afford the basic necessities of life? Part of the answer to this question depends on how you define “basic necessities,” but using the common triad of food, clothing, and housing seems like a reasonable definition since these composed over 80% of household spending in 1901 in the United States.

If we use that definition of necessities, here is what the progress has looked like in the US since 1901:

The data comes from various surveys that the Bureau Labor Statistics has collected over the years, collectively known as the Consumer Expenditure Surveys. The surveys were conducted about once every 1-2 decades from 1901 up until the 1980s, and then annually starting in 1984. Some of these are multi-year averages, but to simplify the chart I’ll just state one year (e.g., “1919” is for 1918 and 1919). The categories are fairly comprehensive: “food” includes both groceries and spending at restaurants; “housing” includes either mortgage or rent, plus things like utilities and maintenance; and “clothing” includes not only the cost of the clothes themselves, but services associated with them such as repairs or alterations (much more important in the past).

We can see in the chart that over time the share spent on these three areas of spending has declined dramatically, taken as a group. Housing is different, but it has been fairly stable over time, mostly staying between 22% and 29% of income (the Great Depression being an exception). There are two time periods when these costs rose: the Great Depression and the late 1970s/early 1980s. Both are widely recognized as bad economic times, but they are aberrations. The jump from 1973 to 1985 in spending on necessities was fully offset by 2003, and today spending on necessities is well below 1973 — even though for housing, it is a few percentage points greater.

A chart like this shows great progress over time, but it will inevitably raise many questions. Let me try to answer a few of them in advance.

Continue reading

Housing Quality Has Improved Dramatically Since the 1980s — For the Poorest Households

A few weeks ago I wrote a post comparing housing costs in 1971 to today. I noted that while houses had gotten bigger, the major quality improvement for the median new home was the presence of air conditioning: a semi-luxury in 1971 (about 1/3 of new homes), to a standard feature in 2023. Even accounting for the presence of central air-conditioning and more square footage, I concluded that housing was about 17 percent more expensive in 2023 than 1971 (relative to wages).

However, if we consider the housing quality of the poorest Americans, the improvements go beyond air-conditioning and more square feet. A recent paper in the Journal of Public Economics titled “A Rising Tide Lifts All Homes? Housing Consumption Trends for Low-Income Households Since the 1980s” has important details on these improvements (ungated WP version). In addition to larger homes, there was “a marked improvement in housing quality, such as fewer sagging roofs, broken appliances, rodents, and peeling paint. The housing quality for low-income households improved across all 35 indicators we can measure.”

Overall, the number of poor American households living in “poor quality” housing was roughly cut in half from 1985 to 2021, from 39% to 16% among social safety net recipients, or from 30% to 12% for the bottom quintile. The 12-16% of poor households that still have poor quality housing is much more than we would like, but these are dramatic improvements over a period when many claim there was stagnation in the standard of living for poor Americans.

This figure from the paper shows the improvements for the different features:

For example, the number of households with no hot water was just 20% of what it was in the late 1980s. Some of the other major improvements are also related to plumbing and water, such as the number having no kitchen sink or no private bathtub/shower, but there was also a big decline in the presence of rodents in the house. All of the 35 indicators they looked at showed improvements, on average a 50% reduction in the number of households with these poor-quality components. This paper only uses data back to 1985, but almost certainly there would be even larger improvements if we used 1971 as the starting point.

While the median new home in 1971 had complete indoor plumbing, this was clearly not true for many poor households even through the 1980s. When we talk about the increasing cost of housing for the poorest Americans, much of that improvement does represent essential quality improvements — and not merely more square feet and air conditioning (though they did get these improvements too).

Economic Nostalgia: 1890s Edition

You see a lot of nostalgia for the recent past. People pining for the simpler life of the 1950s, or claims that wages have stagnated since the late 1970s or early 1980s. I’ve tried to take these arguments seriously and respond to them, such as in a paper I wrote with Scott Winship and summarized in a blog post last June. But occasionally, you find really weird economic nostalgia, like for the 1890s. Yes, the 1890s, not the 1990s.

Here’s one example: a cartoon shared on social media of workers being oppressed in the 1890s, with the caption “the problem has only gotten worse.” That post received 2 million views on Twitter, possibly because many people are criticizing it, but it also has a lot of retweets and likes.

If it was just one semi-viral social media post from an anonymous Twitter account, we could easily dismiss it. But 1890s economic nostalgia has been coming from another important place lately: President Elect Trump. Of course he is nostalgic for the policies of the 1890s. But on occasion, Trump will say things like “Go back and look at the 1890’s, 1880’s with McKinley and you take a look at tariffs, that was when we were at our richest” (emphasis added).

Really, our richest in the 1890s? Can this be true? Are the anonymous socialist Twitter accounts correct? Let’s look at the data. But the answer probably won’t surprise you: your intuition is correct, we are much better off today than the 1890s, in almost every way of looking at it economically.

Continue reading

House Prices and Quality: 1971 vs 2023

Last week I did a comparison of “time prices” for several goods and services in 1971 compared with 2024. For almost all goods and services, it took fewer hours of work in 2023 to purchase them. In some cases, huge increases in affordability; air travel is 79% cheaper and milk is 59% cheaper, in terms of how much time an average worker needs to labor to pay for them.

There was one major exception though: housing. Especially the cost of buying a new home. Just using the median sale price of a home, the cost (in terms of hours of work) roughly doubled between 1971 and 2024. That’s not good!

Many who commented on the post mentioned that houses are much bigger today, and I noted that in the post but still claimed this is a worrying trend: “since 1971 you can’t really argue the quality improvements make up for the increase. Yes, houses are much bigger (about double in size), but that’s not clearly driven by consumer demand (more so by zoning and other laws). The 1971 house also had indoor plumbing (but maybe not air conditioning).”

Furthermore, housing is the largest expense for most families, both today and in 1971. In the early 1970s it was 30.8% of consumer spending, and in 2023 it was slightly higher at 32.9%. Given all this, it is worth investigating further.

First, let’s consider the size of a typical house. For most of the 1971 data, I will use this HUD report on new single-family homes. And I will use the similar Characteristics of New Housing report for 2023 (the latest year available) to compare.

Are houses bigger today? Yes, but not nearly enough to account for the decreasing affordability I showed in the previous post. In 1971, the median new home had 1,400 square feet of floor space. In 2023, it was 2,286. That’s a big increase (over 60%), but let’s now do the time-price affordability calculation, which I show in the table below.

Continue reading

“Time Prices” Today Compared With 1924 and 1971

I’ve written before on this blog about “time prices”: the amount of time it takes at a particular wage to buy a specific product. Time prices are especially useful for making historical comparisons of the real price of a good or service. Rather than adjusting historical prices for inflation (which only tells you whether they have increased faster or slower than average prices), time prices give you a real comparison of whether a good has become more or less affordable.

Antony Davies recently did a 100-year comparison of time prices for an average worker in the US. He compared prices in 1924 for several common food items, gasoline, electricity, movie tickets, airline tickets, an automobile, and several measures of housing costs to the best comparable thing in 2024. This following table shows his results:

You will notice a few things here. For the median worker, most things are much more affordable in 2024. Some things are dramatically so! For many items, the median worker in 2024 is similar to someone in the top 1% in 2024. Huge improvements in the standard living.

It will probably not surprise you that one major exception is housing. For renters, things are not obviously worse, but they are not better, depending on what size of city you are in (renters also have lower incomes, but that would be true in both time periods). However compared to the average home price, things look much worse in 2024. You can reasonably reply that the home is much larger and better quality in 2024 (as late as 1940, barely half of homes had complete indoor plumbing!), and this is all true. Still, an average house today is much better, but also much less affordable.

Despite the high cost of housing, the average worker today is much better off than 1924. It’s hard to deny it.

But what about more recent times? As a recurring meme likes to date it, what about since 1971?

Continue reading

Consumer Expenditures in 2023

Today BLS released the annual update to the Consumer Expenditure Survey, which is exactly what it sounds like: a survey of US consumers about what their spending. The sample size is “20,000 independent interview surveys and 11,000 independent diary surveys” so it’s a pretty big sample. And this is a really great data source, because versions of it go back over 100 years (though the current, annual survey with a lot of detail starts in 1984).

What does this new data tell us? One area that has received a lot of attention lately is food spending (including a lot of attention on this blog), especially the cost of groceries. According to the CPI food at home index, grocery prices are up almost 26 percent since the beginning over 2020. That’s a lot! But incomes are up too, so how does this affect spending patterns?

Here’s what food and grocery spending for middle-quintile households looks like:

Compared to the pre-pandemic 2019 levels, consumers are spending slightly less of their income on food (12.7% vs. 13.2%), though a slightly larger share of their income is being spent on groceries (8.1% vs. 7.8%). Those changes are noticeable, though this isn’t the radical realignment of spending patterns you might expect from such a big change in food prices. The reason is clear: while grocery prices are up about 26%, middle-quintile incomes are up a similar 25% since 2019. That’s falling behind a little bit, but incomes have roughly kept pace with rising food prices. And from 2022 to 2023, both of these percentages decreased slightly, by about 0.3 percentage points.

Continue reading

House Rich, House Richer

The third quarter ‘All Transaction’ housing price data was just released this week. These numbers are interesting for a few of reasons. One reason is that home prices are a big component of our cost of living. Higher home prices are relevant to housing affordability. This week’s release is especially interesting because it’s starting to look like the Fed might be pausing its year 18-month streak of interest rates hikes. In case you don’t know, higher interest rates increase the cost of borrowing and decrease the price that buyers are willing to pay for a home. Nationally, we only had one quarter of falling home prices in late 2022, but the recent national growth rate in home prices is much slower than it was in 2021 through mid-2022.

Do you remember when there were a bunch of stories about remote workers and early retirees fleeing urban centers in the wake of Covid? We stopped hearing that story so much once interest rates started rising. The inflection point in the data was in Q2 of 2022. After that, price growth started slowing with the national average home price up 6.5%. But the national average masks some geographic diversity.  

Continue reading

Spending on Housing: It Hasn’t Really Increased in the Past 40 Years

UPDATE: see also this post on homeowners versus renters, which givens important context to this post.

Are Americans spending more of their income on housing than in the past? Using data from the Consumer Expenditure Survey back to 1984, the answer is pretty clear: no. In fact, it has declined mildly.

This concern is usually raised on the context of young people. Are young people spending more of their income on housing than in the past? No.

For working-age Americans, the percent of their income spent on housing has declined mildly since 1984, but I think it’s accurate to say it’s pretty stable (I have truncated the y-axis so you can see the detail). It’s true that young people spend more of their income on housing than older people, but this has always been true, and the gap is pretty constant.

Continue reading