A Canned-Beer Kind of Guy

An  ex-co-worker was once complaining to me that the prices of things that he liked kept going up.

He was an economics major. Of course he knew that wages also increase. He wasn’t simply cantankerous about inflation. He knew all about improving productivity, income, and price level changes. He was being more specific. The *particular* items that *he* liked were getting more expensive. He was complaining about what, to everyone else, were relative price changes.

Unrelatedly, I was floating around the bls.gov website and examining their Producer Price Index (PPI) FAQs (I learned a bunch). The content is extensive. CPI is broken up into some subcategories. But PPI, being used by multiple industries and trade groups for real-life costs and benefits, is excitingly granular.

You want to know what happened to the price of red, white, rose, and carbonated wines each in particular?  They’ve got you covered. It really is amazing.

Back to my co-worker. I tried to explain that relative price changes reflected underlying economic value and scarcities. We wasn’t having any of it. He just didn’t want his prices to go up. We economists are known for being kind of dispassionate. We see relative prices change and we shrug. Man-on-the-street sees a relative price change and, boy, does he care about it – if it’s the purchasing price that *he* faces.

See the below graph. What kind of consumer are you? Since the start of the pandemic, canned, bottled, and kegged beer have all changed in price. Or maybe you’re a teetotaler and you’ve noticed the increasing price of bottled water.  For interpretability, let’s consider what had cost $10 at the start of the year 2020. Bottled water has gone up to $10.50 and bottled beer has gone up to almost $10.30.  You may not blink at a 3% price increase – unless it’s for 6 bottles of your favorite craft beer.

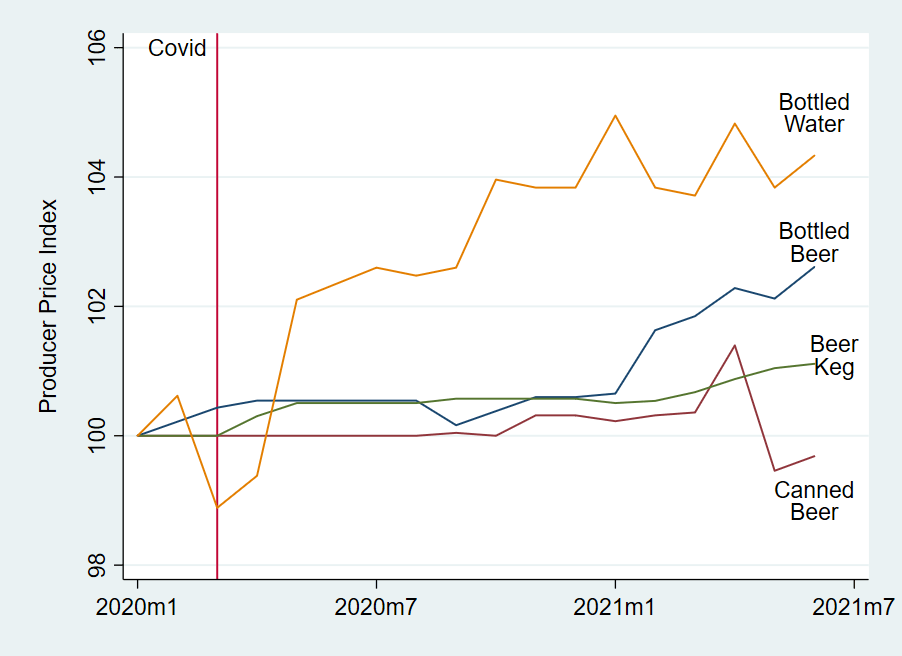
The price of canned beer, on the other hand, hardly increased at all. And in the last couple of months, the price *fell*. I sure hope that my co-worker is a canned-beer kind of guy. Otherwise, someone is sure to hear a lot of belly-aching.

Cars, Inflation, and the Quantity Theory of Money

You have probably seen the latest inflation data. The headline number is 5.4% increase in prices in the past year as measured by the CPI-U. That’s a lot! Even the Core CPI (removing volatile food and energy) is up 4.5%.

If you follow the data closely, you may also have heard that a big chunk of that increase comes from prices related to automobiles: new cars, used cars, rental cars, car parts. All way up!

If you are in the market to buy a car, or if you really need a rental, it’s a bad time for prices. (Conversely, if you have an extra car sitting around, it’s a great time to sell!)

But what if you aren’t in the market for a car? What does the inflation data look like? The White House CEA tweeted out this chart to deconstruct the factors in the recent CPI release.

What does it all mean?

Continue reading

CEA on Inflation Today and WWII

This week the Biden Council of Economic Advisers blogged about “Historical Parallels to Today’s Inflationary Episode”.

Consumer demand in 2021 is roaring back after pandemic shutdowns. Demand for airline travel is exceeding expectations. Car dealer lots are empty.

The authors argue that, of all the periods of rapid inflation in American history, the boom after WWII has the most parallels to today.

During WWII, Americans were obviously in war mode. Price controls and supply shortages led to deprivation on the Homefront. Families had trouble buying cars, just like today.

Instead of focusing on consumer or industrial durable goods, manufacturing capabilities were concentrated on military production. Today’s shortage of durable goods is similar—a national crisis necessitated disrupting normal production processes. Instead of redirecting resources to support a war effort, however, manufacturing capabilities were temporarily shut down or reduced to avoid COVID contagion.

Remember when oil had a negative price in 2020? While people in the US were staying home, many were building up personal savings. As soon as the “war” ends, consumers compete as buyers and drive up the prices of the limited available goods.

They present the post-war inflationary episode as dramatic but temporary, because it only lasted for two years. It’s short compared to inflation of the late ‘70’s. They are standing behind the Powell “transitory” story, in their conclusion.

On the other hand, they say that the most comparable moment in history to today involved the price level spiking 20% and taking two years to come down. I’m pondering a very expensive repair on our car, just make sure I don’t have to buy a new one soon.

1970’s SNL on the Problem of Inflation

Any student of economics knows that inflation emerged as a big issue in the late 1970’s, first under the presidency of Jimmy Carter. The newly minted Saturday Night Live rose to the occasion. First, Dan Akroyd as Jimmy Carter proposed that that every American take 8 per cent of his or her money and burn it (Season 3, Episode 17, 4/15/1978), to reduce the money supply.

The President demonstrated leadership here by burning 8% of the $12.50 in his daughter’s little peanut bank:

A few months later (Season 4, Episode 4, 11/4/1978), the President changed his mind. Since austerity did not seem to be working, he offered a new approach – –  “Inflation is our friend”:

Continue reading

What Forex says about cheap travel

The 2007-9 Financial Crisis turned Iceland into a major tourist destination, as a newly cheap currency combined with affordable flights and natural beauty. For anyone with plenty of time and a moderate amount of money, chasing the newly-cheap destination seems like a good travel strategy.

Since January 2020, here are the countries where the US dollar has gained the most vs the local currency:

Calculated using https://fx-rate.net/USD/?date_input=2020-01-01
Continue reading

Let’s Talk About Inflation

You’ve probably seen the headlines. Corn prices are double what they were a year ago. Lumber prices are triple. You can find all kinds of other scary examples. Is runaway inflation just around the corner? Is it already here?

And yet, measures of prices that consumers pay are much more stable. The most widely tracked measure, the CPI-U, is up 4.2% over the past year. That’s through April — and keep in mind that it’s starting from a low base since March-May 2020 saw falling prices). The Personal Consumption Expenditures index, often preferred by economists, is up just 2.3% (though that’s only through March).

So what gives? Do these consumer measures understate inflation in some way? Or is the increase in commodity prices telling us that consumer prices will increase soon?

Let’s take that second question first. Do higher commodity prices necessarily lead to higher consumer prices? The answer is a clear no. First, we can see that in the data. The producer price index for all commodities (such as corn and lumber) is up 12% over the year (through March, with April data coming out tomorrow). That’s a big increase. But as the chart below suggests, that probably will not lead to 12% increases in consumer prices. It probably won’t even lead to a 5% increase in consumer prices.

Notice two things about this chart. First, commodity prices (the red line) are much more volatile than consumer prices, both on the upside and downside. Second, there really isn’t much of a lag, if any. The direction of change is similar in both indexes, almost to the month. When producer commodity prices go up, consumer prices also go up, that very same month, but not by the same amount. So all of that 12% increase in producer prices is probably already reflected in consumer prices.

Why might this be? Simple supply and demand analysis (hello Econ 101 critics!) can tell us why.

Continue reading

Hyperinflationary Efficiency?

I’m advising a senior thesis for a student who is examining the strength of Purchasing Power Parity in hyper-inflationary countries. Beautifully, the results are consistent with another author* who uses a more sophisticated method.

For those who don’t know, absolute purchasing power parity (PPP) depends on arbitrage among traders to cause a unit of currency to have the same ability to acquire goods in two different countries. If after converting your currency you can afford more stuff in foreign country, then there is a profit opportunity to purchase there and even to re-sell it in your home country.

Essentially, when you make that decision, you are reducing demand for the good in your home country and increasing demand in the foreign country (re-selling affects the domestic supply too). Eventually, the changes in demand cause the prices to converge and the arbitrage opportunities disappear. At this point the two currencies are said to have purchasing power parity – it doesn’t matter where you purchase the good.

So does PPP hold? One way that economists measure the strength of PPP is by measuring the time that it takes for a typical purchasing power difference to be arbitraged away by 50% – its ‘half-life’.  The more time that is required, the less efficient the markets are said to be.

The ex-ante question is: Is PPP be stronger or weaker during hyperinflationary periods?

Continue reading