Governors serve for 4 years in most US states. You can find many rankings of state economies out there, but they tend not to measure how states have done over the last 4 years- instead they either use measurements based on levels (things like mean income which were mostly determined by events before the current governor’s term), or one year of growth (which has a lot of randomness), or they don’t explain what period it is based on at all.
But if you want to know how a state’s economy has performed under an incumbent governor (for instance, to inform your vote on whether to re-elect them), the best way is to measure it’s economic growth over the period of their term- most commonly, 4 years. A governor currently up for re-election following their first term would typically have taken office in January 2023. Below I map how two of the most commonly used economic measured have fared by state from January 2023 to the most recent available data (what is available differs by measure):
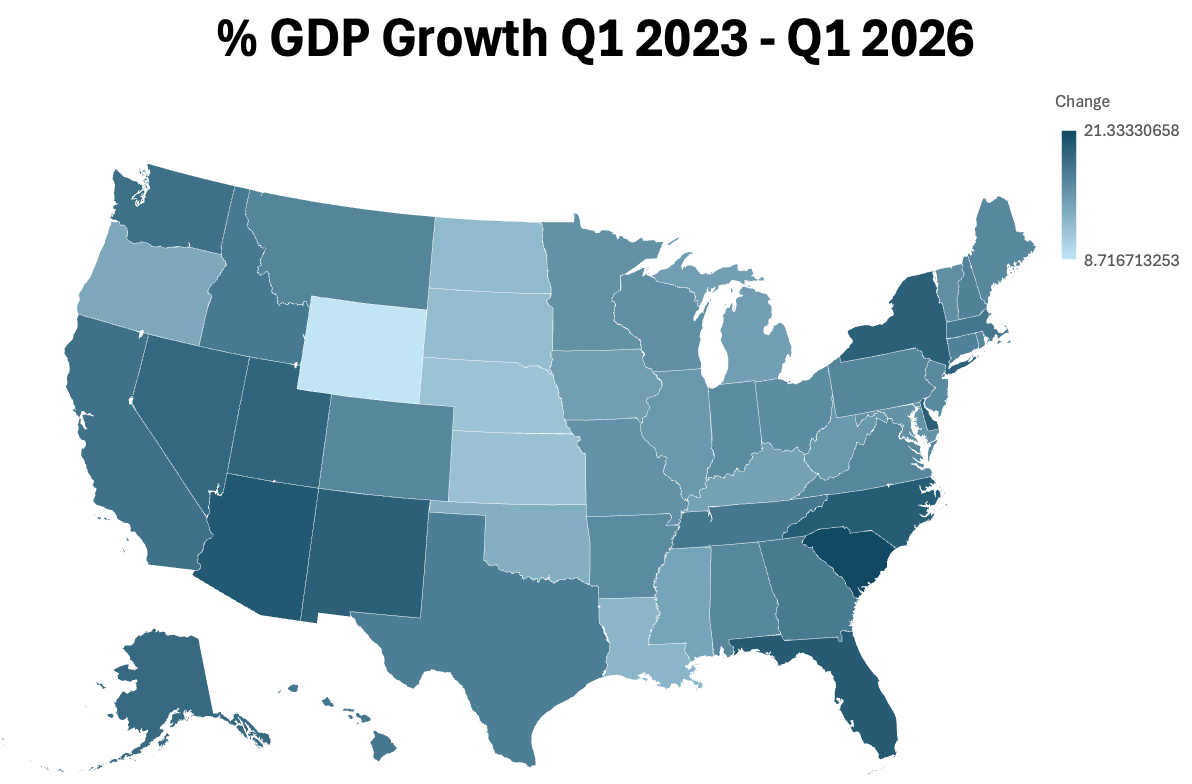
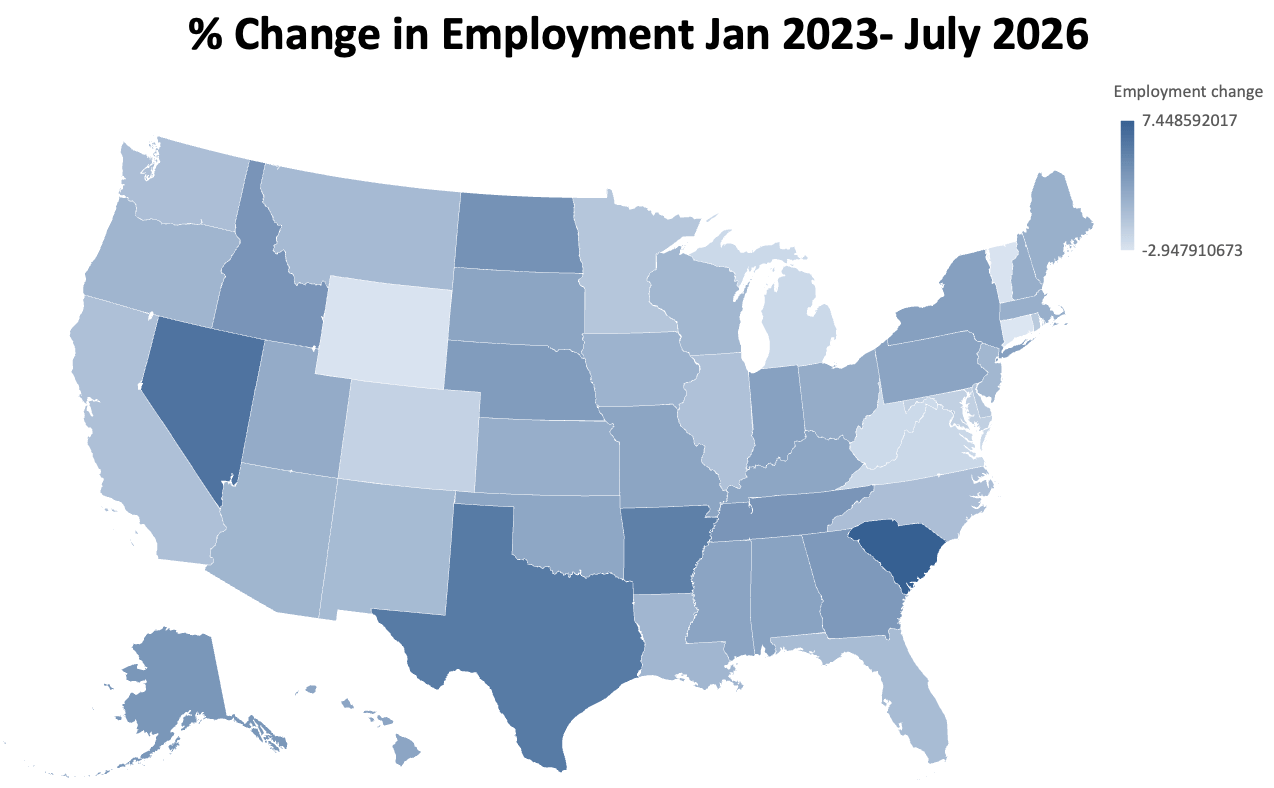
Overall South Carolina looks best and Wyoming looks worst. There might be other economic measures you prefer, like poverty rates or median income- but whatever measure you prefer and whatever politician you are evaluating, I encourage you to check how that measure has changed since their term started and how that ranks compared to other similar regions.
This post was inspired by the mailers that would-be Rhode Island Governor Foulkes’ campaign keeps sending me suggesting I vote for her in the primary against incumbent Rhode Island Governor Dan McKee because “we are last in the country for our economy”, citing this CNBC ranking. Looking into the source, CNBC says:
Continue reading
