Governors serve for 4 years in most US states. You can find many rankings of state economies out there, but they tend not to measure how states have done over the last 4 years- instead they either use measurements based on levels (things like mean income which were mostly determined by events before the current governor’s term), or one year of growth (which has a lot of randomness), or they don’t explain what period it is based on at all.
But if you want to know how a state’s economy has performed under an incumbent governor (for instance, to inform your vote on whether to re-elect them), the best way is to measure it’s economic growth over the period of their term- most commonly, 4 years. A governor currently up for re-election following their first term would typically have taken office in January 2023. Below I map how two of the most commonly used economic measured have fared by state from January 2023 to the most recent available data (what is available differs by measure):
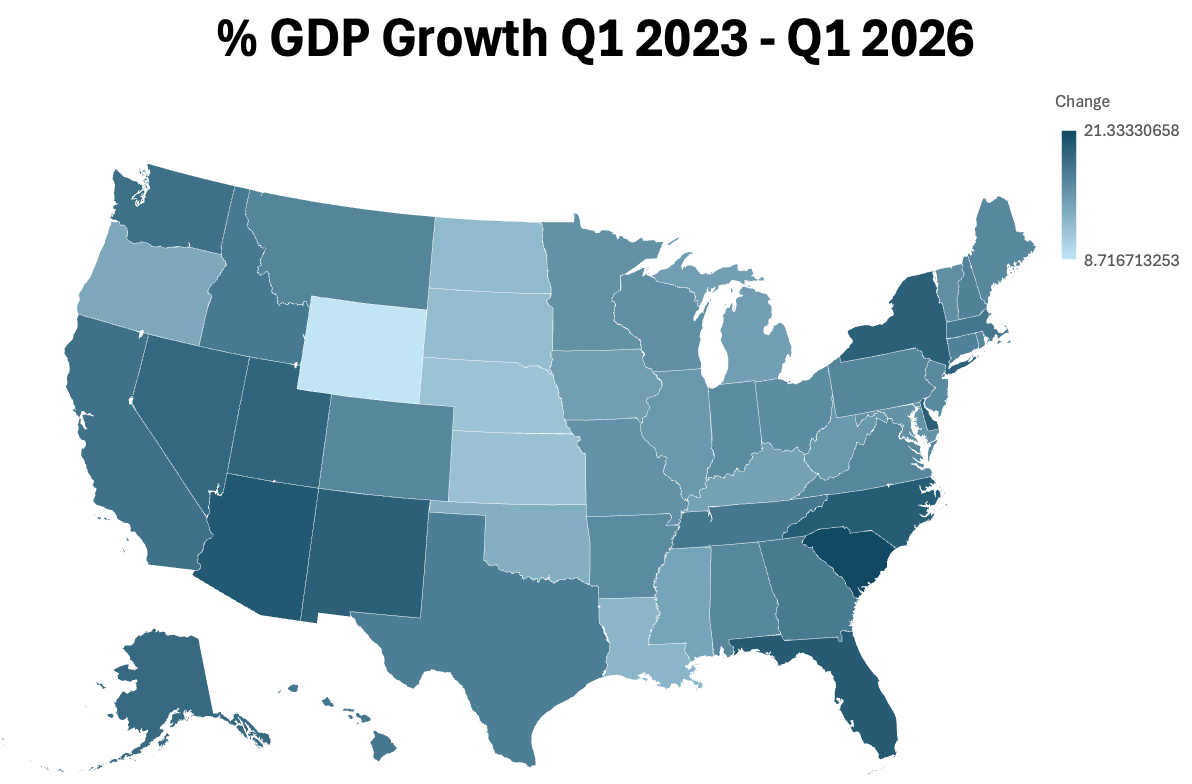
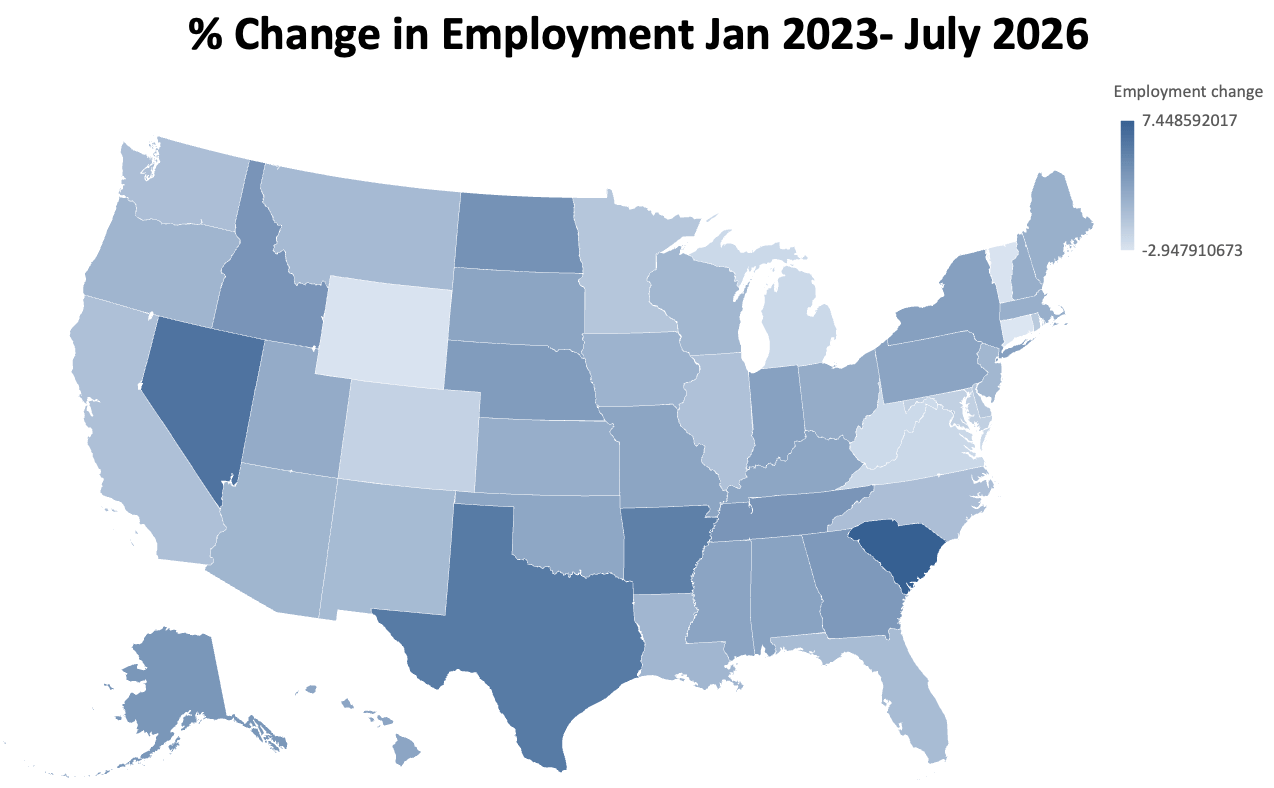
Overall South Carolina looks best and Wyoming looks worst. There might be other economic measures you prefer, like poverty rates or median income- but whatever measure you prefer and whatever politician you are evaluating, I encourage you to check how that measure has changed since their term started and how that ranks compared to other similar regions.
This post was inspired by the mailers that would-be Rhode Island Governor Foulkes’ campaign keeps sending me suggesting I vote for her in the primary against incumbent Rhode Island Governor Dan McKee because “we are last in the country for our economy”, citing this CNBC ranking. Looking into the source, CNBC says:
To measure each state’s economy, we consider job growth, economic growth, and the number of major companies headquartered in the state. We also measure each state’s fiscal health, including its budget situation, its long-term obligations and its debt ratings, as well as the health of the residential real estate market. We also consider the impact of tariffs, the potential impact of federal budget cuts, and small business survival rates.
But they don’t say how they weight these measures or, crucially, what time period they use for the growth measures (e.g. is job growth over 1 quarter? 1 year? 4 years? 10?). On the measures I showed on the maps above, Rhode Island ranks 22nd in GDP growth and 43rd in employment growth- not great, but hardly “last”.
McKee is an unusual case though; he was first elected Governor in November 2022, but he began serving as Governor in March 2021, elevated from Lt. Governor when then-Governor Gina Raimondo left to be US Secretary of Commerce. Calculating the same measures starting from March 2021 shows that Rhode Island has been 48th in GDP growth and 46th in employment growth. Still not “last”, but not looking great for McKee. Using “levels” measures rather than growth would make him look better of course- Rhode Island ranks 24th in unemployment rate and 17th in median income. Would a challenger have done better? It’s hard to know, but I’d encourage any challenger to let voters know which measure they would like to be judged by themselves in four years.

