In the past 20 years in the US, per pupil spending in K-12 schools has increased by about 20%. That’s in CPI-U inflation-adjusted dollars. What’s the cause of this increase? Higher teacher salaries? Administrative bloat? Something else?
Here’s a chart you may have seen floating around the internet. It shows the growth in the number of employees at K-12 public schools.

This looks like a lot of administrative bloat! The source of the data is the National Center for Education Statistic’s Digest of Education Statistics, Table 213.10.
But hold on, here’s another chart, showing the percent of employees in each of these same categories.
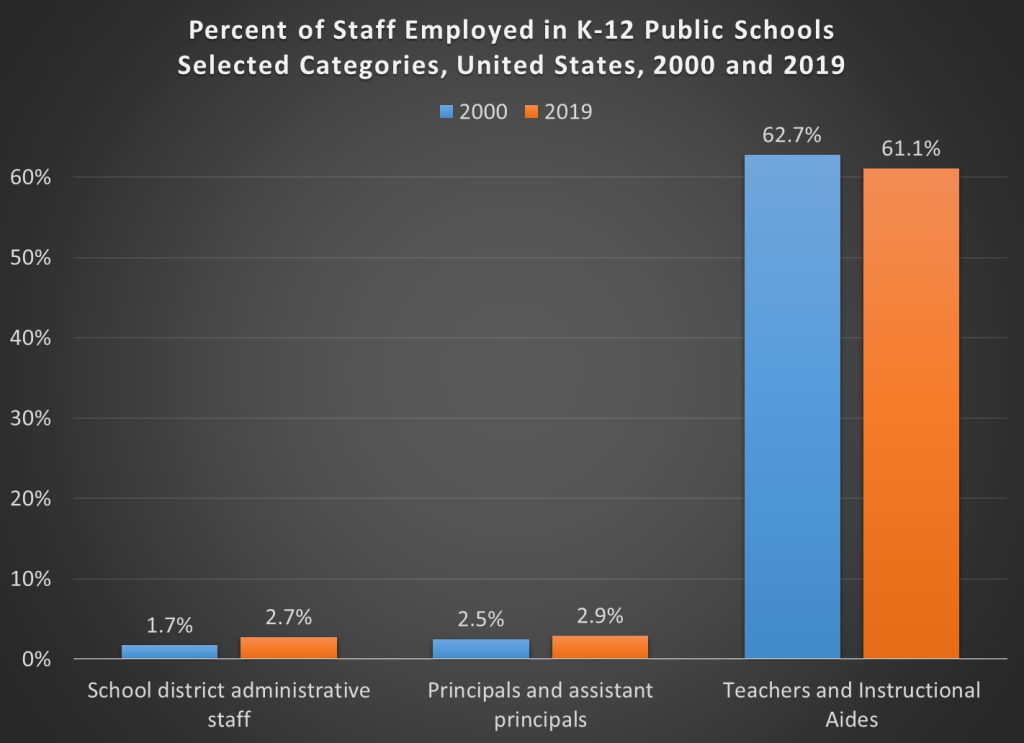
The numbers don’t add up to 100% because I’ve left off a few categories (the biggest one is “support staff,” which was 30-31% of the total throughout the time period). But overall, this chart appears to show much less bloat. Instructional staff (including aides) were by far the biggest category of employees in both categories in both time periods. Administrative staff at the district level did grow, but only by 1 percentage point of the total.
What’s the source of this data? Well, it’s a little trick I played. The source is the National Center for Education Statistic’s Digest of Education Statistics, Table 213.10. It’s the exact same data.
How is this possible?
Continue reading