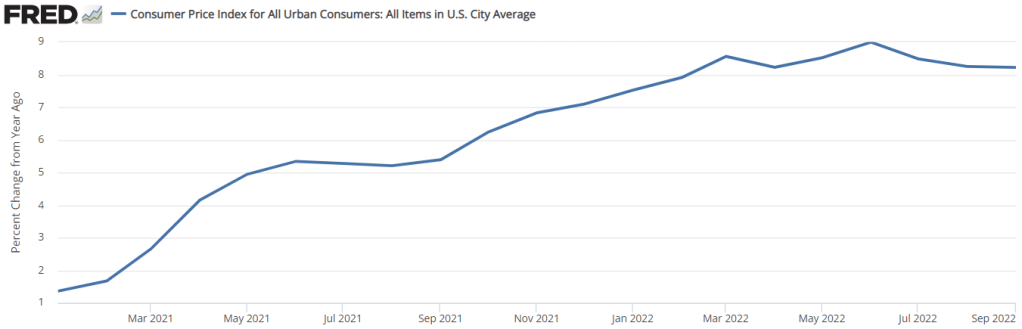
People were all excited last week when the CPI numbers were released because… the year-over-year rate of inflation did a whole lot of nothing. See below. The 12-month rate of inflation was practically constant. The 8.2% number was all over the headlines and twitter. We already know that news outlets don’t always report on the most relevant numbers. And I say that this is one of those times.
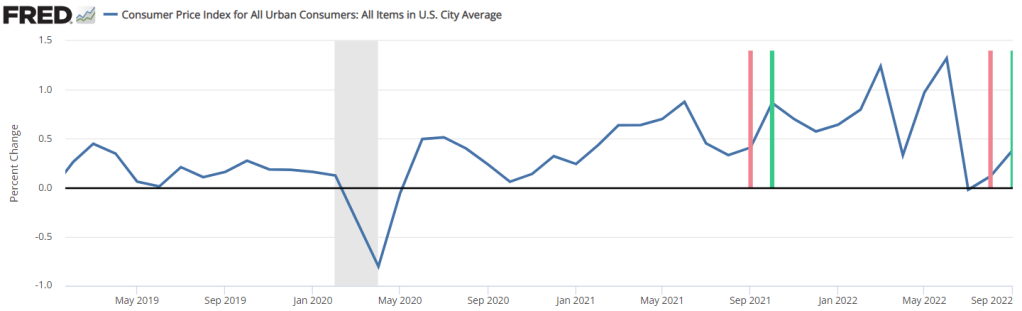
First of all, there is a problem with the year-over-year indicator. Well, not so much problem in the measure itself, but more a problem of interpretation. The problem is that the 12-month rate of inflation is the cumulative compound rate for 12 individual months. Each month that we update the 12-month inflation rate, we drop a month from the back of the 12-month window and we add a month to the front of the 12-month window. Below are both a graph and a table indicating the monthly rate of inflation and the 12-month periods ending in August 2022 (pink) and in September 2022 (green).
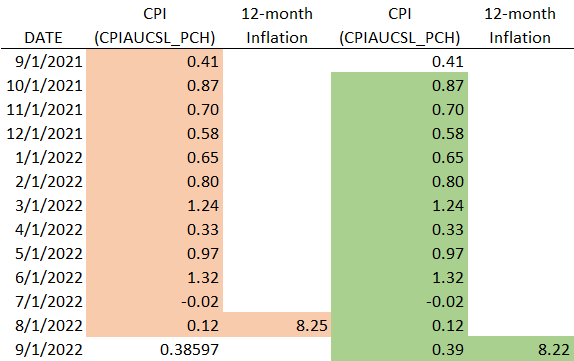
There’s plenty to see in the above. But I want you to notice the values that are included in the year-over-year inflation calculations. Note that the monthly inflations in the pink and the green intervals are the same for all but two values. The 12-month inflation ending in September 2022 excludes the 0.41% value from September 2021 and adds the 0.39% value from September 2022. I don’t know what the talking heads and columnists wanted last week, but any change in the 12-month rate of inflation was going to be quite small because only one out of the twelve values in the calculation changed.
People are saying that there’s been no improvement in our inflation and that another federal funds rate hike is now guaranteed. While another rate hike may happen, the most recent CPI release will not be the reason. Take a look again at that second graph. Yes, it is true that inflation was higher in September of 2022 than in both July and August. But, it’s just as high as it was in early 2019.
The 12-month rate of inflation uses more data, but the data is older and maybe less relevant. In this post I note the monthly periodic rates of inflation because they are easy to understand. Personally, I get an unreasonable amount of satisfaction from using the annualized rate, which is the annual rate if a periodic rate were to remain constant for a year. The annualized rate of inflation between July and September was 2%.
Guys. 2%. That’s not 12% and it’s certainly not 20%. If the Fed’s goal is to have a 2% average rate of inflation in the medium term, then the last three months have been on track. Congratulations to the Fed! I don’t know all of the variables that the Fed cares about, but the last quarter of inflation is looking on-point. The Fed tries to adjust interest rates based on the prospective course of the economy and not the historical course. It’s reasonable to think that next month will be more like the last 3 months than like the last 12 months.
OF COURSE, three months does not mean that the task of taming inflation is done. It doesn’t mean that the Fed has ‘beaten inflation’. There is still plenty of time for inflation to rebound given the long and variable lags of monetary policy. We could just be experiencing a momentary reprieve. Regardless, please tell your friends to use the appropriate measures of inflation and to think before they tweet.
