People were all excited last week when the CPI numbers were released because… the year-over-year rate of inflation did a whole lot of nothing. See below. The 12-month rate of inflation was practically constant. The 8.2% number was all over the headlines and twitter. We already know that news outlets don’t always report on the most relevant numbers. And I say that this is one of those times.
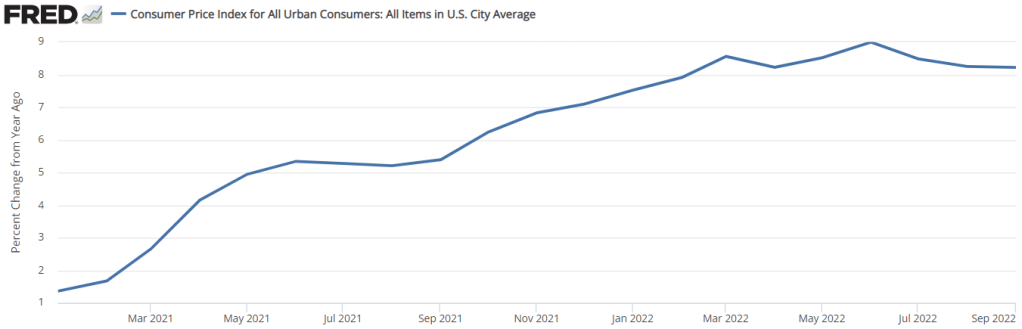
First of all, there is a problem with the year-over-year indicator. Well, not so much problem in the measure itself, but more a problem of interpretation. The problem is that the 12-month rate of inflation is the cumulative compound rate for 12 individual months. Each month that we update the 12-month inflation rate, we drop a month from the back of the 12-month window and we add a month to the front of the 12-month window. Below are both a graph and a table indicating the monthly rate of inflation and the 12-month periods ending in August 2022 (pink) and in September 2022 (green).
Continue reading