When you see prices from the past, especially the distant past, your normal reaction is perhaps one of envy or nostalgia. Take for example the Thanksgiving menu from the Plaza Hotel in New York in 1899. As you browse the menu, note that the prices are in cents, not dollars.
The most expensive items on the menu are only a few dollars, while many items can be had for around 50 cents. But hopefully your nostalgia will soon fade when you recall that wages were probably lower back then.
But how much lower?
According to data from MeasuringWorth.com (an excellent resource affiliated with the Economic History Association), the average wage for production workers in manufacturing was 13 cents per hour in 1899. From this we can immediately see that a dish such as Ribs of Prime Beef (60 cents) would take about 4.5 hours of work for a production worker to purchase.
How can we compare these prices and wages from 1899 to today?
The COVID-19 pandemic, war in Ukraine, simmering US-China tensions, and rising global populism have led to globalization facing renewed attention-and criticism-from politicians and pundits across the political spectrum. Like any market phenomenon, the free movement of people, things, money, and ideas across natural or political borders is imperfect and often disruptive. But it has also produced undeniable benefits-for the United States and the world-that no other system can match. And it’s been going on since the dawn of recorded history.
The original essays compiled in this volume offer a diverse range of perspectives on globalization-what it is, what it has produced, what its alternatives are, and what people think about it-and offer a strong, proactive case for more global integration in the years ahead. Covering the basic economic and political ideas and historical facts underlying globalization, rebutting the most common arguments against globalization today, and educating readers on the intersection of globalization and our societies and cultures-from where we live to what clothes we wear and what foods we eat-Defending Globalization demonstrates the essential humanity of international trade and migration, and why the United States and the rest of the world need more of it.
It takes all of us to be rich. We need “a great multitude that no one could count, from every nation, tribe, people and language,” so to speak.
Two years ago, on Twitter, I summarized my contribution as follows, in the form of a dialogue:
Person from the Past: “So, how is it with 8 billion people?”
Me Today: “It’s bad. We have too many clothes.”
Person from the Past: “Right. With 8 billion you wouldn’t have enough clothes for everyone.”
Me Today: “Too many.”
I made it to the book launch event in D.C. near the Capitol.
Some people still have not heard of “fast fashion.” Maybe you heard it here first: New legislation is likely coming to regulate the clothing industry. It might start at the state level, in progressive places like California or Seattle. Demands include making information about supply chains more transparent and taxing the clothing companies in order to pay for trash disposal. For example, you can read about the New York Fashion Act. Similar to the way the food companies have to provide clear information about calories, clothing retailers might have to provide more information about chemicals, labor, and disposal issues.
Plastic fibers making new clothing cheap. I sometimes hate the flood of cheap products that American families are drowning in. Plastic products are so cheap to stamp out and give to kids. Some days you’ll find me grumpy about the latest bag of plastic swag and candy my kids came home with. There are some negative externalities to consuming tons of plastic items and tossing them out.
It’s a privilege to have this problem. Perhaps we are overindulging in clothing abundance and need some modern solutions to modern problems. We also need to figure out how to stop getting obese off of food abundance. (Hello, Ozempic.) But let’s still be grateful for the abundance, on this Thanksgiving week. My controversial take is that it’s good for the cost of clothing to be low. We don’t want to regress. We don’t want to make clothing scarce again.
If you were to want to cite my work on fashion and globalization, then you could use something like this:
Buchanan, Joy. “Fast Fashion, Global Trade, and Sustainable Abundance” (2024) In S. Lincicome, & C. Packard (Eds.), Defending Globalization: Facts and Myths about the Global Economy and Its Fundamental Humanity, Cato Institute, (pp. 367 – 380).
Public choice economists emphasize the process by which we select political leaders. Electoral and voting rules influence the type of leaders we get. Institutional economists agree and go one step further. Who we choose matters less than the environment we place them in. Leaders, regardless of their personal qualities, respond to the incentives that surround them. The ultimate policies, therefore, largely conform to those incentives. From this perspective, it’s important to adopt institutional incentives for leaders to promote policies oriented toward economic growth and provide the option to flourish.
The same principle applies to the private economy. Productivity is crucial, and higher IQ often correlates with greater productivity. Yet, genetic endowment—including IQ—is beyond individual control. Many other determinants of productivity are not exogenous when we can affect policy. Let’s adopt policies that allow individuals with lower IQ to act productively as if they had higher IQ. Protecting the freedom to contract and private property rights creates conditions whereby even those at the lower end of the cognitive ability distribution can thrive. These principles expand their opportunities. Market signals give them valuable feedback on their activities and enable them to contribute to the economy.
I offer a cleaned version of the state-level NSDUH in Stata .dta and Excel .xlsx formats here.
The NSDUH is mostly quite good as government datasets go- they share individual-level data in many formats and with the option to get most years together in a single file. But due to privacy concerns, the individual-level data doesn’t tell you what state people live in, which means it can’t be used to study things like state policy. SAMHSA does offer a state-level version of their data, but it is messy and only available in SAS format. So I offer the 1999-2019 state-level NSDUH Small Area Estimation Dataset in Stata .dta and Excel .xlsx formats here.
If you have Stata I recommend using that version, since the variables are labelled, making it much easier to understand what they represent.
This is the latest addition to my data page, where you can find cleaned/improved versions of other government datasets.
Just when you think there might be one arena of human life free of status competition, you will turn out to be wrong.
Consider the 4th graders who get to do “safety patrol” as volunteer work. This is a badge of honor and the kids like power. A casual observer might think that any kid who volunteers to do safety patrol would simply be having a great experience. Surely this is as simple as adding a unit of utility from consumption, in comparison to the times when the child is not allowed to do safety patrol.
But all is not well. Jackson Carter, says Rachel Pratt, has been hogging the prime safety patrol spot for weeks. He walks to school earlier than anyone and sits on the good spot, excluding the other 4th graders from having the chance to catch the highest volume of younger kids to boss around.
Rachel Pratt and several other girls are conspiring to, collectively, prevent Jackson from getting so disproportionately many days on the prime spot. They have agreed that if any one of them can beat him to the spot, they will share it with anyone except Jackson. The crew has also planned to loudly comment on the situation in earshot of the school principal in hopes that Jackson will have to share the spoils more evenly.
Remember that one time, back when we had a global pandemic, when interest rates fell really low and everyone was borrowing and refinancing? Good times. But they were also times of surging demand for durable goods, supply chain disruptions, and shortages. Specifically, the price of lumber surged by 54% between 2019 and 2022. There were stories of contractors who were unable to do their jobs at their typical prices. Some of them went without work. Others did much less work. Theft of precious lumber was in the news.
As we know, sudden price spikes often make the front pages and the social media rounds. But they peter out and the subsequent decline in prices hardly ever gets coverage in the same way. People used to talk about higher gasoline prices all the time, but never discussed with the same enthusiasm when prices fell. The same is true for lumber. We heard hysterical stories of record high prices, alleged shortages, and the sawmills that lacked adequate capacity to keep up with demand.
I thought this was going to be another election post, but it didn’t turn out that way.
My plan was to do another annual portfolio review, with a focus on changes I’ll make to my portfolio as a result of how the election impacts various market themes, and how my take on the election differs from the market’s take. But as I looked at my portfolio, what struck me wasn’t how the election changes things, but instead how severely my stock picks underperformed the incredible 26% return the S&P has posted so far this year.
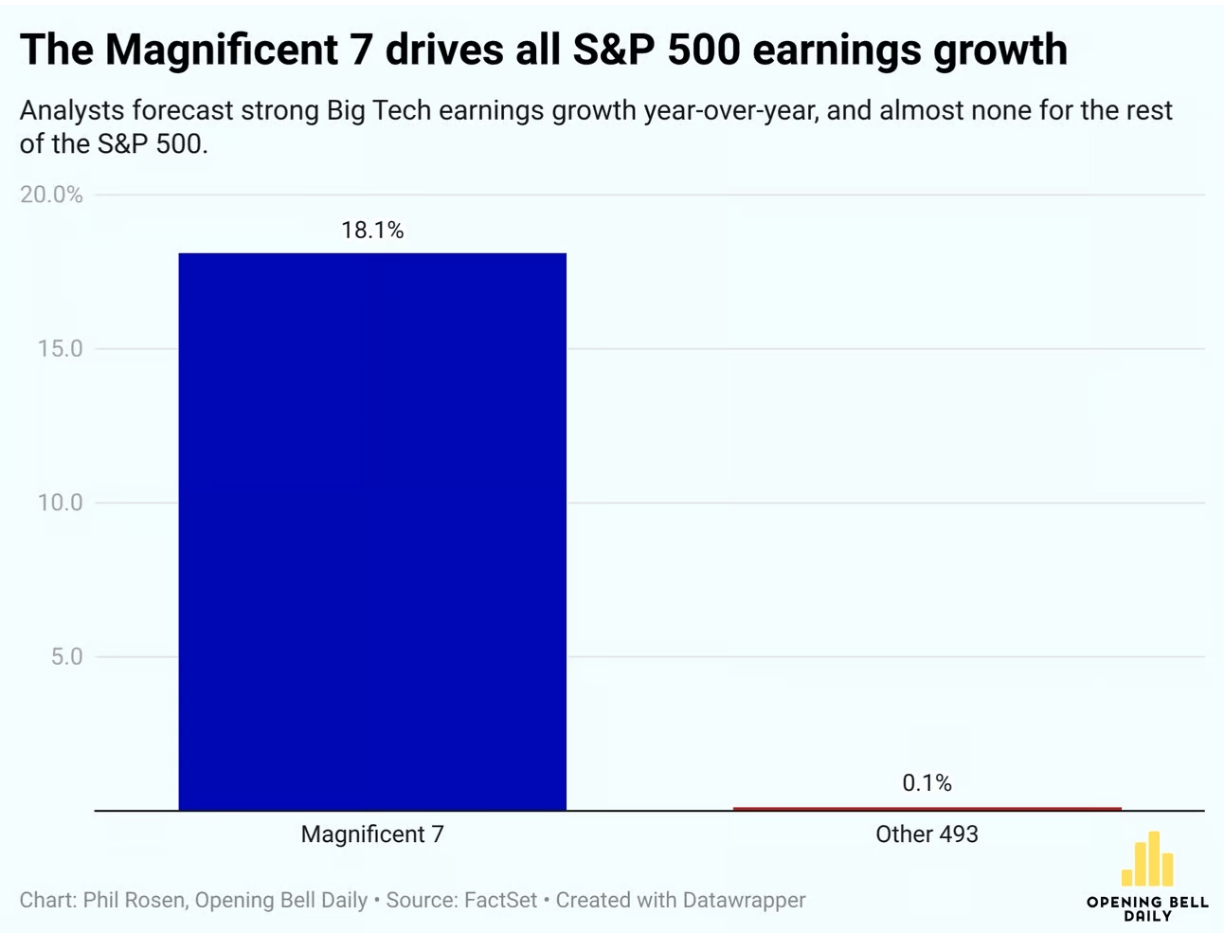
My first couple years of stock picking tended to match the S&P, roughly what you’d expect if markets are efficient and I’m just throwing darts. But more recently so much of the overall return of the market has been driven by just 7 mega-cap stocks, the “Magnificent 7”, that if you don’t own them you are probably underperforming big time.
Of course buying a broad index, especially a market-cap-weighted one like the S&P, is a way to ensure you own at least a piece of the big winners, which is one reason economists usually recommend buying the broad index. And I did this with 80% of my portfolio, to match my 80% belief in the efficient markets hypothesis. But I’m now back up to 90% belief in efficient markets, at least for stocks.
This efficiency seems to change a lot over time. Probably fewer than 10% of US stocks have obvious mis-pricings right now; really none stand out as super mispriced to a casual observer like me. Instead, it seems like every 10 years or so a broad swathe of the market is driven crazy by a bubble or a crash, and you get lots of mispricing- like tech in 2000, forced/panic selling at the bottom in 2009, or meme stocks in 2021. The rest of the time, the stock market is quite efficient. So, in typical times, just be boring and buy and hold a broad index fund.
Of course, you might think that AI is a bubble now. I certainly don’t love the 68 P/E on NVIDIA, but this doesn’t strike me as a true bubble driven by irrational hope- peoples’ hopes have proven well justified so far, with AI performing miracles and the Mag 7 delivering huge profits. So like Scott, I’m finally giving up on being overweight value stocks. Perhaps our capitulation is the sign that growth’s decade-plus run is finally about to reverse; but if so, I’ll try not to regret it. After all, the S&P has plenty of value stocks too.
A new essay by J. Zachary Mazlish answers the title question in the affirmative: yes, inflation made the median voter poorer. The post is data-heavy, with lots of charts and different ways of slicing the data, which is great! But since I am called out by name (or rather, my evil twin, Jeremy Horpendahl), I want to respond specifically to the claim about my data, but also I’ll make a few broader points.
Regular readers will recognize the chart in that Tweet comes from an EWED post from April 2024. Mazlich says that my chart and others like it are “misleading for understanding the election because a) they compare wages now versus January 2020, rather than January 2021.”
Fair enough, but if you read my Tweet you will see that I am specifically responding to an NPR story which said, “if you look at the difference between what… groceries cost in 2019 and what it costs today, and what wages looked like in 2019 and today, the gap is really gigantic.” So, they are specifically using 2019 as a baseline in that story, and my chart specifically used that as the baseline too! That’s why I thought that chart was relevant.
It’s true, of course, that if you want to understand median voter sentiment about the Biden administration, you should probably start the data at the beginning of the Biden administration. But I was responding to the more general claim people make, that they are worse off than in 2019.
With that clarification out of the way, what does Mazlich’s broader post say?
Last week I laid out my own expectations for what economic policy would look like in a Trump or Harris presidency. Now after yesterday’s market reaction, we can infer what market participants as a whole expect by roughly doubling the size of yesterday’s market moves. Prediction markets had a 50-60% change of Trump winning as of Tuesday morning’s market close, which moved to a 99+% chance by Wednesday morning. Look at how other markets moved over the same time, multiply it by 2-2.5x, and you get the expected effect of a Trump presidency relative to a Harris presidency. So what do we see?
Stocks Up Overall: S&P 500 up 2%, Dow up 3%, Russell 2000 (small caps) up 6%. My guess this is mostly about avoiding tax increases- the odds that most of the Tax Cuts and Jobs Act gets renewed when it expires in 2025 just went way up. Lower corporate taxes boost corporate earnings directly, while lower taxes on households mean that they have more money to spend on their stocks and their products. Lower regulation and looser antitrust rules are also likely to boost corporate earnings.
Bond Prices Down (Yields Up): 10yr Treasury yields rose from 4.29% to 4.4%. This is the flip side of the tax cuts- they need to be paid for, and markets expect they will be paid for through deficits rather than cutting spending. The government will issue more bonds to borrow the money, lowering the value of existing bonds.
Dollar Up: The US dollar is up 2% against a basket of foreign currencies. I think this is mostly about the expected tariffs. People like the sound of the phrase “strong dollar” but it isn’t necessarily a good thing; it makes it cheaper to vacation abroad, but makes it harder to export, even before we consider potential retaliatory tariffs.
Crypto Way Up: Bitcoin went up 7% overnight, Ethereum is now 15% up since Tuesday. Crypto exchange Coinbase was up 31%. Markets anticipate friendlier regulation of crypto, along with a potential ‘strategic Bitcoin reserve’.
Single Stock Moves: Private prison stocks are up 30%+. Tesla is up 15%, mostly due to Elon Musk’s ties to Trump, but also due to tariffs. Foreign car companies were way down on the expectation of tariffs- Mercedes-Benz down 8%, BMW down 10%, Honda down 8%.
Sector Moves: Steel stocks are up on the expectation of tariffs, while solar stocks (which can’t catch a break, doing poorly under Biden despite big subsidies and big revenue increases) were down 12% in the expectation of falling subsidies. Bank stocks did especially well, with one bank ETF up 12%. This gives us one hint on what to me is now the biggest question about the second Trump administration- who will staff it? I could see Trump appointing free-market types, or wall-streeters in the mold of Steve Mnuchin, or dirigiste nationalist conservatives in the JD Vance / Heritage Foundation mold, or an eclectic mix of political backers like Elon Musk and RFK Jr, or a combination of all of the above. The fact that bank stocks are way up tells me that markets expect the free-marketers and/or the Wall-Street types to mostly win out.
Just Ask Prediction Markets: If you want to know what markets expect from a Presidency, you can do what I just did, look at moves the big traditional markets like stocks and bonds and try to guess what is driving them. But increasingly you can skip this step and just ask prediction markets directly- the same markets that just had a very goodelection night. Kalshi now has markets on both who Trump will nominate to cabinet posts, as well as the fate of specific policies like ‘no tax on tips‘
Typically, the federal government spends more than it takes in. This has been going on for decades. At moderate levels, i.e. moderate debt/GDP ratios, this is not cause for concern. Presumably the national economy will grow enough to service the debt.
Historically, deficit spending would temporarily increase during some crisis like a major recession or major war, then it quickly tapered back down again. There was a general understanding, it seems, among most voters and most politicians that huge deficits were not healthy; one would not want to burden future generations with a lot of debt.
During the 2020-2021 epidemic experience, however, politicians found they got instant popularity by handing out trillions in stimulus money; anyone who squeaked that we couldn’t afford this much largesse got run over. And this spend-big, tax-small mentality has now become entrenched. Both presidential candidates have been traversing the nation promising juicy tax cuts. Apparently, we the people have decided to vote ourselves lots of free money right now, and the heck with future generations.
Here is a forecast from the Congressional Budget Office, with the optimistic assumption that we will never get another recession, showing that the recent levels of deficit are much higher than historical norms:
This is just the yearly deficit, not the exponentially-growing accumulated debt. The influence of the total debt may be seen in the mushrooming interest outlays. Below is another chart with data from the St Louis Fed, displaying both deficit level and unemployment over the past 80 years. Again, deficit spending would ramp up during recessions, due to reduced tax revenue and increased spending on unemployment benefits, etc., but then it would ramp right back down again. It failed to come back down completely after the 2008-2009 recession, and indeed started ramping up around 2016, even with low unemployment.
I don’t see this trend changing, and so investors need to take this into account. Here I will summarize some key points from analyst Lyn Alden Schwartzer in her article on the Seeking Alpha investing site titled Why Nothing Stops The Fiscal Train.
She notes that besides the primary deficit, the interest paid on the federal debt is a transfer of money to mainly the private sector, and so is further stimulus. This is one factor that has helped keep the economy stronger, and inflation higher, than it would otherwise be.
Some key bullet points in the article are
The U.S. faces structurally high fiscal deficits driven by unbalanced Social Security, inefficient healthcare spending, foreign adventurism, accumulated debt interest, and political polarization.
Investment implications suggest favoring equities and scarce assets over bonds, with defensive positions in T-bills, gold, and inflation-protected Treasury notes.
Fiscal dominance will likely lead to persistent inflation, asset price volatility, and potential stagflation, making traditional recession indicators less reliable.
A neutral-to-negative outlook on U.S. stocks in inflation-adjusted terms, with better prospects for international equities and cyclical mid-sized U.S. stocks.
She suggests looking to the recent histories of emerging economies to see what happens in nations with perhaps stagnating real economies kept afloat by ongoing federal deficits. Her tentative five-year outlook for investing is bearish on the major U.S. stock indices (gotten overpriced) and on government bonds (real returns, in light of anticipated ongoing inflation, will be low), but bullish on international stocks, inflation-protected bonds, short-term T-bills, gold, and bitcoin (again, all mainly driven by expected stubborn inflation as the money supply keeps growing):
-For U.S. stocks, I have a neutral-to-negative view on the major U.S. stock indices in inflation-adjusted terms. They’re starting from an expensive baseline, and with a high ratio of household investable assets already stuffed into them. However, I do think that among the universe of more cyclical and/or mid-sized stocks that make up smaller portions of the U.S. indices, there are plenty of reasonably priced ones with better forward prospects.
-For international stocks, I think the 2024-2025 Fed interest rate cutting cycle is one of the first true windows for them to have a period of outperformance relative to U.S. stocks for a change. It doesn’t mean that they certainly will follow through with that, but my base case is for a meaningful asset rotation cycle to occur, with some of the underperforming international equity markets having a period of outperformance. At the very least, I would want some exposure to them in an overall portfolio, to account for that possibility.
-For developed market government bonds, like the U.S. and elsewhere, I don’t have a positive long-term outlook in terms of maintaining purchasing power. A ten-year U.S. Treasury note currently yields about 3.7%, while money supply historically grows by an average of 7% per year, and $20 trillion in net Treasury debt is expected to hit the market over the next decade. So I think the long end of the curve is a useful trading sardine, but not something I want to have passive long exposure to.
-A five-year inflation-protected Treasury note, however, pays about 1.7% above CPI, and I view that as a reasonable position for the defensive portion of a portfolio. T-bills are also useful for the defensive portion of a portfolio. They’re not my favorite assets, but there are worse assets out there than these.
-Gold remains interesting for this five-year period, although it might be tactically overbought in the near-term. It has had a nice breakout in 2024, but is still relatively under-owned by most metrics, and should benefit from the U.S. rate cutting cycle. So I’m bullish as a base case.
-Bitcoin has been highly correlated with global liquidity, and I expect that to continue. My five-year outlook on the asset is very bullish, but the volatility must be accounted for in position sizes for a given portfolio and its requirements.
I’ll add two comments on this list. First, the bond market is usually pretty good about figuring things out, and has evidently realized that endless huge deficits mean endless huge bond issuance and ongoing inflation. Thus, even though the Fed is lowering short-term rates, bond buyers have started demanding higher rates on long-term bonds. And so long-term government bonds may not be as bad as Schwartzer thinks.
Second, for reasons described in The Kalecki Profit Equation: Why Government Deficit Spending (Typically) MUST Boost Corporate Earnings, when you work through the various sectoral balances in the macro economy, most of the huge deficit spend dollars will end up in either corporate earnings or in the foreign trade deficit. So the ongoing deficits will continue to buoy up U.S. corporate earnings, and hence U.S. stock prices.