Academic studies have found that there is a momentum effect with stock prices: a stock which has done well over the past 6-12 months is likely to continue to do better than average over the next six months or so. A number of funds (ETFs) have been devised which try to take advantage of this factor. This is a relatively effortless exercise: running calcs on stock price movements is way easier than doing a deep fundamental dive into a company’s future earnings potential.
Here we will compare several momentum ETFs against the S&P 500 index. In order to make it an apples-to-apples comparison, I am looking mainly at major momentum funds that primarily draw from the S&P 500 large cap universe of stocks, excluding small-cap or tech only funds. These large cap momentum funds are MTUM, JMOM, and SPMO, plus the newer FMTM. These funds all select stocks according to various rules. Besides trying to identify stocks with raw price momentum, these rules typically aim to minimize risk or volatility.
I excluded the momentum fund GMOM, since it draws from a different universe of holdings. That fund does not hold individual stocks. Rather, it draws on some 50 different ETFs, including funds that focus on fixed income, commodities, or international or small cap as well as large cap US stocks, seeking to hold funds that show good relative momentum. (In a previous look at momentum funds, we found that GMOM did well in 2022, suffering less of a drawdown than the other funds, but it has lagged ever since; diversifying away from U.S. large caps was a big drag).
A plot of total returns over the past five years (which includes the 2022 correction) is shown below. The returns at the halfway mark (2.5-year mark, 4/1/2024) are shown on the chart. FMTM only started 18 months ago, so it has no five-year returns. SPMO is orange, and the reference S&P500 line is blue. JMOM (purple) tracks fairly closely to S&P500 most of the time. MTUM (green line) fell well behind during 2023, though it caught up by August, 2026. SPMO was close to S&P500 for the first two years, then steadily roared ahead over the next three years.
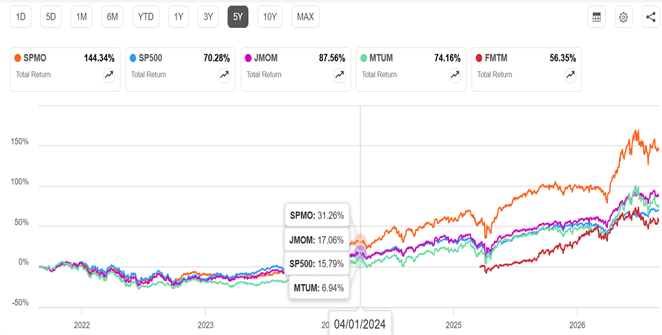
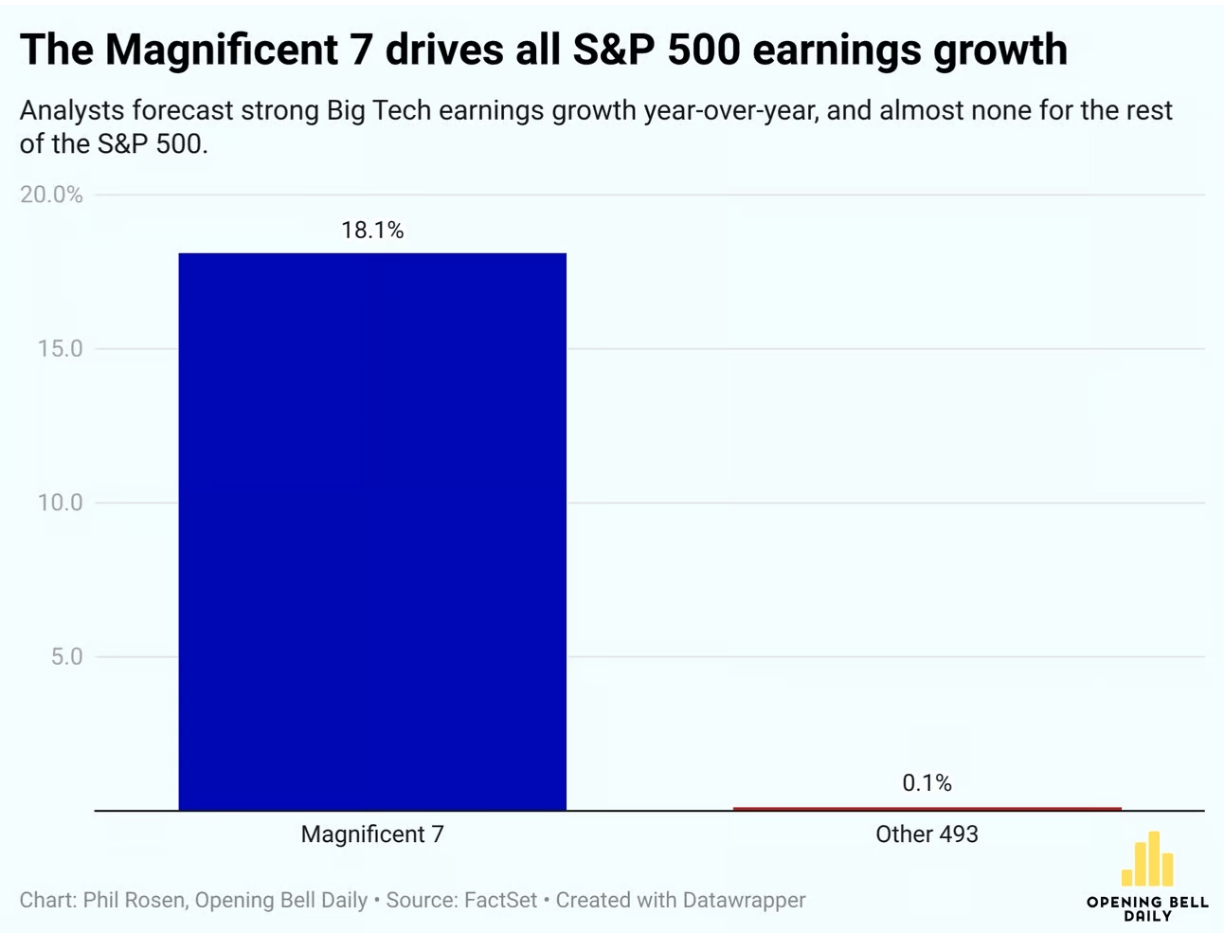
Plain SPY (blue line) held its own against most of these momentum funds in this timeframe. This is partly explained by the fact that SPY itself is a sort of momentum fund: the more a given stock’s price goes up, the bigger its representation in this capital-weighted fund. Also, over the past ten years or so, simply the biggest companies (the big tech quasi-monopolies like Google, Microsoft, etc.) have been generating more and more earnings, leaving the traditional auto and oil and consumer product companies, etc., in the dust – – and the S&P index incorporates this effect.
Key aspects of the funds’ strategies are listed in the table (thanks, Claude) below. JMOM includes the whole Russell 1000 universe of stocks, while SPMO is limited to the top 500 stocks. We note that JMOM is sector neutral, so it cannot be hugely overweight on sector, such as tech. On the other hand, SPMO has no such constraint, and so its major holdings for some time have consisted almost entirely of the giant AI darlings Nvidia, Micron, Broadcom, AMD, Google, etc. That has been the right bet over the past several years (although you pay for it in high volatility). SPMO also has perhaps the longest effective look-back period for calculating momentum. It uses a 12-month period, but excludes the most recent month (to avoid paying too much for a quick, temporary stock price run-up). SPMO is clearly doing something right, since its five-year total return (144 %) is nearly double that of the S&P 500; this is a stunning achievement.
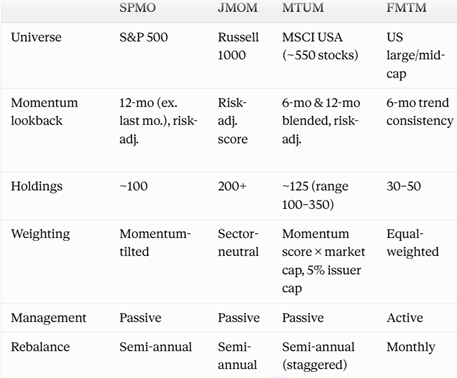
The new entry FMTM has its own quirks: it holds mid-caps as well as large-caps, and it has a significantly shorter time frame for calculating momentum (six months, vs the usual 12 months), AND it reconstitutes every month (instead of six months). So, it reacts very quickly to a rising stock. This sounds great, but it might end up acting on false, short-lived surges in prices. Time will tell.
Turning now to the 1-year results, where FMTM gets a chance to strut its stuff, we find that the new upstart has soundly beaten them all, even SPMO:
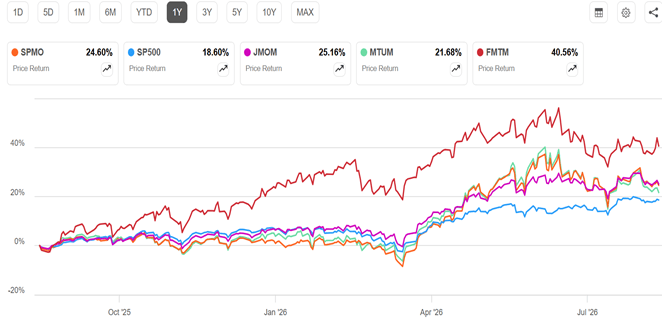
But this FMTM outperformance was very inconsistent. The one-year performance of FMTM was driven by a huge surge in late 2025/early 2026. But a six-month plot shows FMTM dead last among all these funds, while SPMO comes out on top (again). FMTM looks interesting as a smaller “satellite” holding, that may outperform in some regimes, but SPMO seems to be the more solid performer.
Boilerplate disclaimer: Nothing here should be taken as advice to buy or sell any security.