It seems to be an accepted fact that there is a momentum effect with stock prices: a stock which has done well over the past 6-12 months is likely to continue to do better than average over the next six months or so. A number of funds (ETFs) have been devised which try to take advantage of this factor.
On the other hand, sometimes trends reverse, and stock that was hot twelve months ago has now run up in price, and may be due for a pause.
Here we will compare several momentum ETFs against the plain S&P 500 fund, SPY. In order to make it an apples-to-apples comparison, I am looking mainly at momentum funds that primarily draw from the S&P 500 large cap universe of stocks, excluding small-cap or tech only funds. [1] These large cap momentum funds are MTUM, JMOM, and SPMO. These funds all select stocks according to various rules. Besides trying to identify stocks with raw price momentum, these rules typically aim to minimize risk or volatility. I added one outlier, GMOM, that is very diversified. This fund does not hold individual stocks. Rather, it draws on some 50 different ETFs, including funds that focus on fixed income, commodities, or international or small cap as well as large cap US stocks, seeking to hold funds that show good relative momentum.
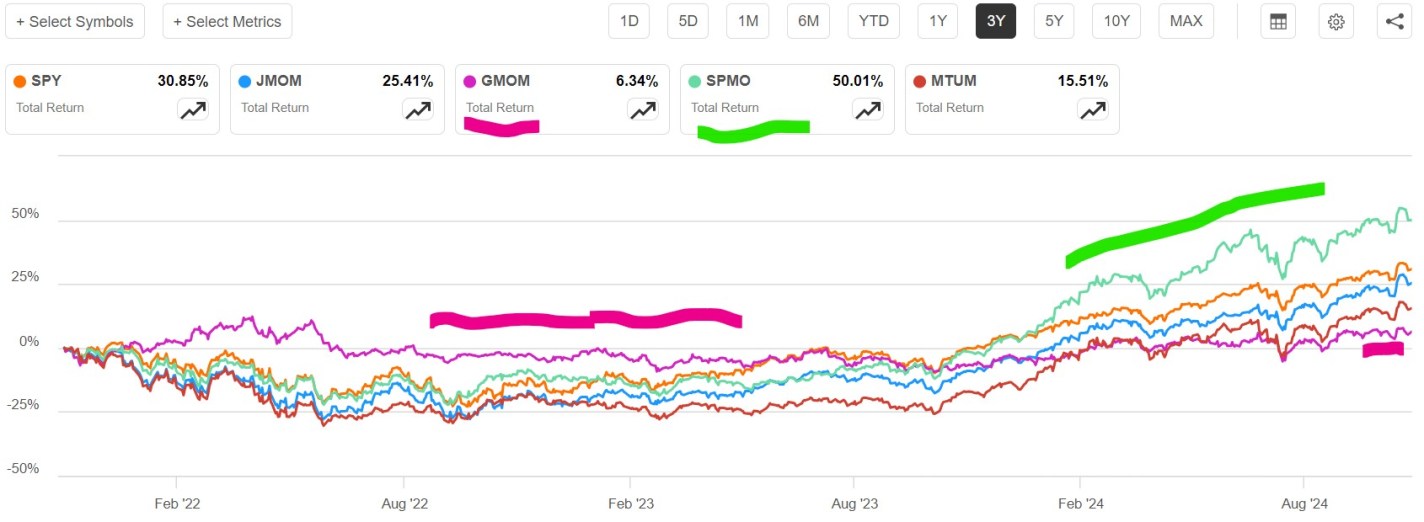
A plot of total returns over the past three years for these funds is shown below. It can be seen that plain SPY (orange line) beat all of the momentum funds except for SPMO (green line) in this timeframe. This is partly explained by the fact that SPY itself is a sort of momentum fund: the more a given stock’s price goes up, the bigger its representation in this capital-weighted fund. Also, over the past ten years or so, simply the biggest companies (the big tech quasi-monopolies like Google, Microsoft, etc.) have been generating more and more earnings, leaving the traditional auto and oil companies and banks, etc., in the dust.
By not focusing on U.S. large cap stocks, the diversified GMOM (marked with purple highlighter line) is less volatile. Its price did not drop nearly as much as the other funds in 2022, but it missed out on the great 2023-2024 stock run-up. SPMO (marked with green highlighter) really took off in that 2023-2024 big tech fiesta, by virtue of being concentrated in stocks like Nvidia, which went up roughly 10X in this timeframe. But this outperformance may be something of a one-off lucky strike. SPMO is still about the best of the momo funds, normally at least keeping up with SPY, but it does not consistently outperform it.
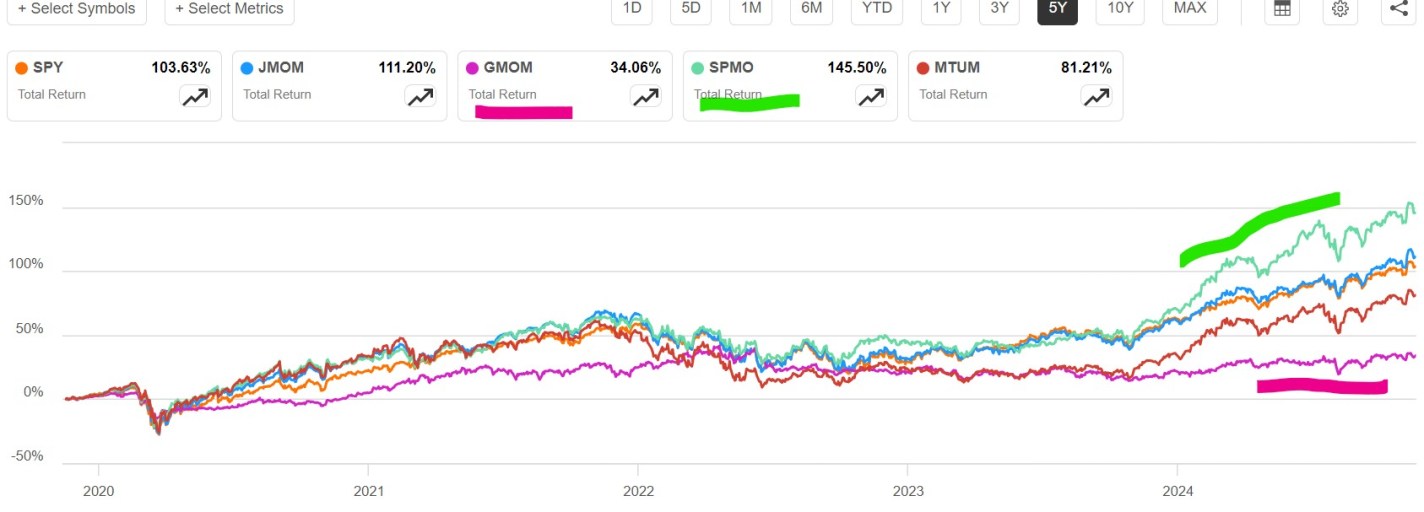
The five-year plot below illustrates similar trends, though it is a bit harder to read. Again, SPMO (green highlighter) largely keeps up with SPY, with a big outperformance spurt at the end. And GMOM is pretty flat; that really hurt it in the big 2020-2021 runup of big tech stocks. Over this five-year timeframe, JMOM kept up with SPY, and actually edged a bit ahead. MTUM, like most of the stock momo funds, actually ran ahead of SPY in the 2020-2021 runup, but fell somewhat more in 2022, and then got left in the dust in 2023. It is likely that it fell prey to trend reversal, which is a constant hazard for momentum funds. For most of 2022, the “best” stocks were dull value stocks, while tech stocks did terribly. Thus, a plain momentum algo fund would come into 2023 loaded with non-tech stocks. I suspect that is what happened to MTUM.
It happens that the SPMO algo has features that try to protect it from loading up on non-growth stocks during a bear market. So, it seems to be the best general momentum stock fund. It selects stocks which have shown positive momentum over the past twelve months, with the most recent month excluded (so as not to discriminate against a stock which had a temporary drop). Its chief vulnerability is that it only updates its holdings once every six months (mid-March and mid-September), so it is often acting on very old information. (Supposedly, it is better to update a momentum fund every three months).
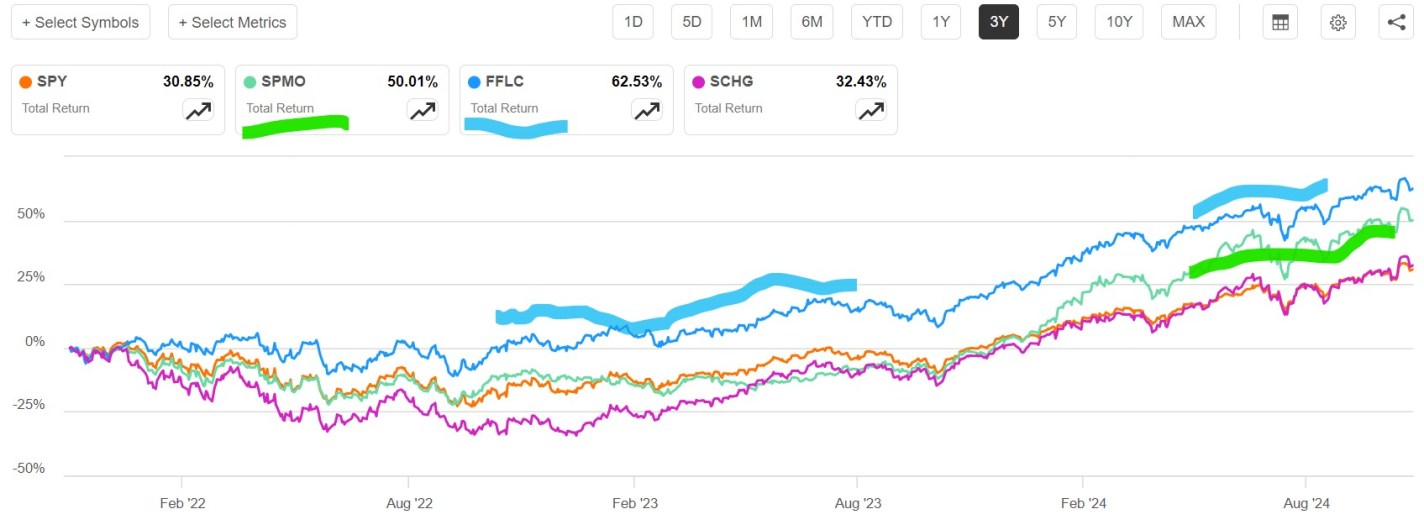
How does SPMO compare to a top actively-managed fund like FFLC or plain growth stock fund SCHG? The three-year plot below shows that FFLC (blue line, 63% total return) beat SPMO (green line, 50% return). Although SPMO had an impressive surge in the past year, FFLC just kept steadily outperforming SPY over the whole three-year period. This suggests that having good human judgement at the helm, able to adapt to differing market environments (2022 bear vs. 2023-2024 tech bull) can do better than a single, focused algorithm. I prefer a fund which keeps steadily outperforming “the market” (i.e., S&P 500) rather than one which only occasionally has moments of glory, so I hold more FFLC than SPMO.
In the plot above, the growth fund SCHG suffered more in 2022 when the tech high-flyers fell to earth, but made up for it in 2023-2024, to end up matching SPY over three years. On longer time-frames, SCHG handily beats SPY, as we noted in an earlier article on growth stocks.
[1] See this Insider Monkey article for a listing of ten best U.S. stock momentum funds. Some of these focus on small cap, mid cap, or technology stocks.
I thought this was going to be another election post, but it didn’t turn out that way.
My plan was to do another annual portfolio review, with a focus on changes I’ll make to my portfolio as a result of how the election impacts various market themes, and how my take on the election differs from the market’s take. But as I looked at my portfolio, what struck me wasn’t how the election changes things, but instead how severely my stock picks underperformed the incredible 26% return the S&P has posted so far this year.
My first couple years of stock picking tended to match the S&P, roughly what you’d expect if markets are efficient and I’m just throwing darts. But more recently so much of the overall return of the market has been driven by just 7 mega-cap stocks, the “Magnificent 7”, that if you don’t own them you are probably underperforming big time.
Of course buying a broad index, especially a market-cap-weighted one like the S&P, is a way to ensure you own at least a piece of the big winners, which is one reason economists usually recommend buying the broad index. And I did this with 80% of my portfolio, to match my 80% belief in the efficient markets hypothesis. But I’m now back up to 90% belief in efficient markets, at least for stocks.
This efficiency seems to change a lot over time. Probably fewer than 10% of US stocks have obvious mis-pricings right now; really none stand out as super mispriced to a casual observer like me. Instead, it seems like every 10 years or so a broad swathe of the market is driven crazy by a bubble or a crash, and you get lots of mispricing- like tech in 2000, forced/panic selling at the bottom in 2009, or meme stocks in 2021. The rest of the time, the stock market is quite efficient. So, in typical times, just be boring and buy and hold a broad index fund.
Of course, you might think that AI is a bubble now. I certainly don’t love the 68 P/E on NVIDIA, but this doesn’t strike me as a true bubble driven by irrational hope- peoples’ hopes have proven well justified so far, with AI performing miracles and the Mag 7 delivering huge profits. So like Scott, I’m finally giving up on being overweight value stocks. Perhaps our capitulation is the sign that growth’s decade-plus run is finally about to reverse; but if so, I’ll try not to regret it. After all, the S&P has plenty of value stocks too.
Will Growth Stocks Continue to Trounce Value Stocks?
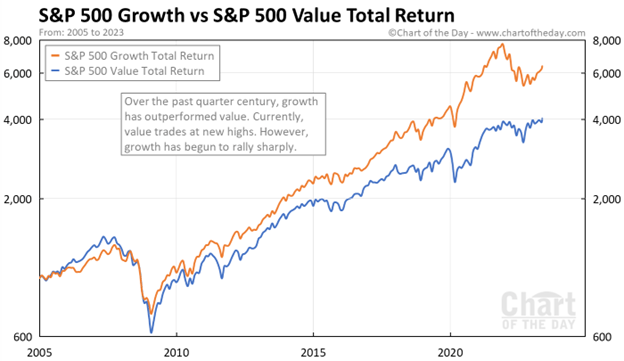
It’s no secret that growth stocks, mainly big tech companies like Apple and Microsoft, have massively out-performed so-called value stocks in the past fifteen years. Value stocks tend to have lower price/earnings and steady earnings and low price/earnings. They include sectors such as petroleum, utilities, traditional banks, and consumer products. These companies often pay substantial dividends from their cash flow.
Here are some charts which make the point. This 2005-early 2023 chart shows value stocks (blue curve) having a small edge 2005-2008, then the growth stocks (orange curve) keep ripping higher and higher. Financial stocks, which mainly fall in the value category, were hit particularly hard in the 2008-2009 downturn.
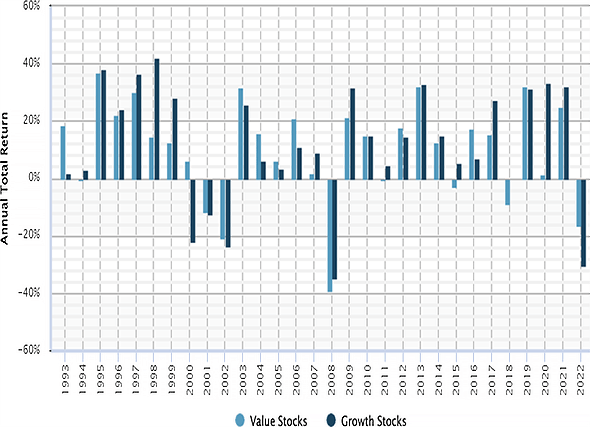
Here is a bar chart display of annual returns of value stocks (blue bars) and of growth stocks for the years 1993-2022. In 1997-1999 growth stocks outperformed. This was the great tech bubble – I remember it well, investors were shoveling money into any enterprise with a customer-facing website, whether or not there was any reasonable path to profitability. Reality caught up in 2000 (“What was I thinking??”), tech stock prices crashed and then tech was hated for a couple of years. But by 2009 or so, today’s big tech firms had emerged and established their quasi-monopolies, and started actually making money and even more money.
So, is the answer to just allocate all your equity portfolio to big tech and walk away? This is a question I have been asking myself. Even as growth stocks dominate year after year, there have continued to be voices warning that this is anomaly; historically, value stocks have performed better. So, with the sky-high valuations of today’s big tech, there is due to be a big mean reversion where the “Magnificent 7” get crushed, and Big Banks and Big Oil and Proctor & Gamble and even humble utilities finally get to shine.
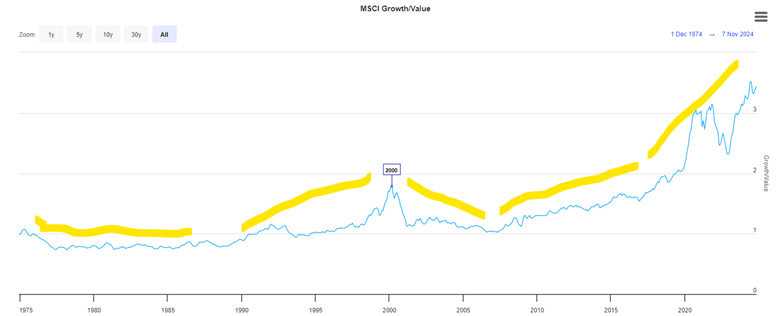
I don’t have a chart that goes that far back, but I have read that over the past 100 years, value has usually beat “growth”. Here is a hard-to-read plot of value vs growth for 1975-2024. I have added yellow highlighter lines to mark major trend periods. Growth underperformed 1975-1990, then growth picked up steam and culminated in the peak in the middle of the chart at 2000. Growth then underperformed 2000-2008, as noted earlier, as the excesses of the tech bubble were unwound, and people made paper fortunes in the real estate bubble of 2001-2007.
Growth has dominated since 2009, excerpt for 2022. That was the year the Fed raised interest rates, which tends to punish growth stocks. However, with their unstoppable increases in earnings (accounting for the vast majority of the earnings in the whole S&P 500), big tech has come roaring back. Yes, they sport high P/E ratios, but they have the earnings and the growth to largely justify their high valuations.
I have been influenced by the continual cautions about growth stocks becoming overvalued. Many an expert has advocated for value stocks. In June of this year, Bank of America head of US equity strategy Savita Subramanian told an audience at the Morningstar Investment Conference: “I have one message to you: Buy large-cap value.” So, for the past couple of years, I have gone relatively light on big tech and have over-allocated to “safer” investments like fixed income and value stocks. Silly me.
In the last few months, I finally decided to give up fighting the dominant trend, and so I put some funds into SCHG, which is specifically large cap growth, and in other growth-heavy funds. As you may imagine, these funds are loaded with Nvidia and Meta and other big tech. They have done very well since then.
How about going forward? Will the growth dominance continue, or will the dreaded mean reversion strike at last? At some point, I suspect that big tech earnings will slow down to where their high valuations can no longer be supported. But I don’t know when that will be, so I will just stay diversified.
Boilerplate disclaimer: Nothing here should be taken as advice to buy or sell any security.
Last week I laid out my own expectations for what economic policy would look like in a Trump or Harris presidency. Now after yesterday’s market reaction, we can infer what market participants as a whole expect by roughly doubling the size of yesterday’s market moves. Prediction markets had a 50-60% change of Trump winning as of Tuesday morning’s market close, which moved to a 99+% chance by Wednesday morning. Look at how other markets moved over the same time, multiply it by 2-2.5x, and you get the expected effect of a Trump presidency relative to a Harris presidency. So what do we see?
Stocks Up Overall: S&P 500 up 2%, Dow up 3%, Russell 2000 (small caps) up 6%. My guess this is mostly about avoiding tax increases- the odds that most of the Tax Cuts and Jobs Act gets renewed when it expires in 2025 just went way up. Lower corporate taxes boost corporate earnings directly, while lower taxes on households mean that they have more money to spend on their stocks and their products. Lower regulation and looser antitrust rules are also likely to boost corporate earnings.
Bond Prices Down (Yields Up): 10yr Treasury yields rose from 4.29% to 4.4%. This is the flip side of the tax cuts- they need to be paid for, and markets expect they will be paid for through deficits rather than cutting spending. The government will issue more bonds to borrow the money, lowering the value of existing bonds.
Dollar Up: The US dollar is up 2% against a basket of foreign currencies. I think this is mostly about the expected tariffs. People like the sound of the phrase “strong dollar” but it isn’t necessarily a good thing; it makes it cheaper to vacation abroad, but makes it harder to export, even before we consider potential retaliatory tariffs.
Crypto Way Up: Bitcoin went up 7% overnight, Ethereum is now 15% up since Tuesday. Crypto exchange Coinbase was up 31%. Markets anticipate friendlier regulation of crypto, along with a potential ‘strategic Bitcoin reserve’.
Single Stock Moves: Private prison stocks are up 30%+. Tesla is up 15%, mostly due to Elon Musk’s ties to Trump, but also due to tariffs. Foreign car companies were way down on the expectation of tariffs- Mercedes-Benz down 8%, BMW down 10%, Honda down 8%.
Sector Moves: Steel stocks are up on the expectation of tariffs, while solar stocks (which can’t catch a break, doing poorly under Biden despite big subsidies and big revenue increases) were down 12% in the expectation of falling subsidies. Bank stocks did especially well, with one bank ETF up 12%. This gives us one hint on what to me is now the biggest question about the second Trump administration- who will staff it? I could see Trump appointing free-market types, or wall-streeters in the mold of Steve Mnuchin, or dirigiste nationalist conservatives in the JD Vance / Heritage Foundation mold, or an eclectic mix of political backers like Elon Musk and RFK Jr, or a combination of all of the above. The fact that bank stocks are way up tells me that markets expect the free-marketers and/or the Wall-Street types to mostly win out.
Just Ask Prediction Markets: If you want to know what markets expect from a Presidency, you can do what I just did, look at moves the big traditional markets like stocks and bonds and try to guess what is driving them. But increasingly you can skip this step and just ask prediction markets directly- the same markets that just had a very goodelection night. Kalshi now has markets on both who Trump will nominate to cabinet posts, as well as the fate of specific policies like ‘no tax on tips‘
Typically, the federal government spends more than it takes in. This has been going on for decades. At moderate levels, i.e. moderate debt/GDP ratios, this is not cause for concern. Presumably the national economy will grow enough to service the debt.
Historically, deficit spending would temporarily increase during some crisis like a major recession or major war, then it quickly tapered back down again. There was a general understanding, it seems, among most voters and most politicians that huge deficits were not healthy; one would not want to burden future generations with a lot of debt.
During the 2020-2021 epidemic experience, however, politicians found they got instant popularity by handing out trillions in stimulus money; anyone who squeaked that we couldn’t afford this much largesse got run over. And this spend-big, tax-small mentality has now become entrenched. Both presidential candidates have been traversing the nation promising juicy tax cuts. Apparently, we the people have decided to vote ourselves lots of free money right now, and the heck with future generations.
Here is a forecast from the Congressional Budget Office, with the optimistic assumption that we will never get another recession, showing that the recent levels of deficit are much higher than historical norms:
This is just the yearly deficit, not the exponentially-growing accumulated debt. The influence of the total debt may be seen in the mushrooming interest outlays. Below is another chart with data from the St Louis Fed, displaying both deficit level and unemployment over the past 80 years. Again, deficit spending would ramp up during recessions, due to reduced tax revenue and increased spending on unemployment benefits, etc., but then it would ramp right back down again. It failed to come back down completely after the 2008-2009 recession, and indeed started ramping up around 2016, even with low unemployment.
I don’t see this trend changing, and so investors need to take this into account. Here I will summarize some key points from analyst Lyn Alden Schwartzer in her article on the Seeking Alpha investing site titled Why Nothing Stops The Fiscal Train.
She notes that besides the primary deficit, the interest paid on the federal debt is a transfer of money to mainly the private sector, and so is further stimulus. This is one factor that has helped keep the economy stronger, and inflation higher, than it would otherwise be.
Some key bullet points in the article are
The U.S. faces structurally high fiscal deficits driven by unbalanced Social Security, inefficient healthcare spending, foreign adventurism, accumulated debt interest, and political polarization.
Investment implications suggest favoring equities and scarce assets over bonds, with defensive positions in T-bills, gold, and inflation-protected Treasury notes.
Fiscal dominance will likely lead to persistent inflation, asset price volatility, and potential stagflation, making traditional recession indicators less reliable.
A neutral-to-negative outlook on U.S. stocks in inflation-adjusted terms, with better prospects for international equities and cyclical mid-sized U.S. stocks.
She suggests looking to the recent histories of emerging economies to see what happens in nations with perhaps stagnating real economies kept afloat by ongoing federal deficits. Her tentative five-year outlook for investing is bearish on the major U.S. stock indices (gotten overpriced) and on government bonds (real returns, in light of anticipated ongoing inflation, will be low), but bullish on international stocks, inflation-protected bonds, short-term T-bills, gold, and bitcoin (again, all mainly driven by expected stubborn inflation as the money supply keeps growing):
-For U.S. stocks, I have a neutral-to-negative view on the major U.S. stock indices in inflation-adjusted terms. They’re starting from an expensive baseline, and with a high ratio of household investable assets already stuffed into them. However, I do think that among the universe of more cyclical and/or mid-sized stocks that make up smaller portions of the U.S. indices, there are plenty of reasonably priced ones with better forward prospects.
-For international stocks, I think the 2024-2025 Fed interest rate cutting cycle is one of the first true windows for them to have a period of outperformance relative to U.S. stocks for a change. It doesn’t mean that they certainly will follow through with that, but my base case is for a meaningful asset rotation cycle to occur, with some of the underperforming international equity markets having a period of outperformance. At the very least, I would want some exposure to them in an overall portfolio, to account for that possibility.
-For developed market government bonds, like the U.S. and elsewhere, I don’t have a positive long-term outlook in terms of maintaining purchasing power. A ten-year U.S. Treasury note currently yields about 3.7%, while money supply historically grows by an average of 7% per year, and $20 trillion in net Treasury debt is expected to hit the market over the next decade. So I think the long end of the curve is a useful trading sardine, but not something I want to have passive long exposure to.
-A five-year inflation-protected Treasury note, however, pays about 1.7% above CPI, and I view that as a reasonable position for the defensive portion of a portfolio. T-bills are also useful for the defensive portion of a portfolio. They’re not my favorite assets, but there are worse assets out there than these.
-Gold remains interesting for this five-year period, although it might be tactically overbought in the near-term. It has had a nice breakout in 2024, but is still relatively under-owned by most metrics, and should benefit from the U.S. rate cutting cycle. So I’m bullish as a base case.
-Bitcoin has been highly correlated with global liquidity, and I expect that to continue. My five-year outlook on the asset is very bullish, but the volatility must be accounted for in position sizes for a given portfolio and its requirements.
I’ll add two comments on this list. First, the bond market is usually pretty good about figuring things out, and has evidently realized that endless huge deficits mean endless huge bond issuance and ongoing inflation. Thus, even though the Fed is lowering short-term rates, bond buyers have started demanding higher rates on long-term bonds. And so long-term government bonds may not be as bad as Schwartzer thinks.
Second, for reasons described in The Kalecki Profit Equation: Why Government Deficit Spending (Typically) MUST Boost Corporate Earnings, when you work through the various sectoral balances in the macro economy, most of the huge deficit spend dollars will end up in either corporate earnings or in the foreign trade deficit. So the ongoing deficits will continue to buoy up U.S. corporate earnings, and hence U.S. stock prices.
For many people nowadays, investing in “stocks” means buying a fund like SPY or VOO which tracks the large cap S&P 500 index, or maybe QQQ or QQQM which track the tech-heavy NASDAQ 100 index. These types of funds are exchange-traded funds (ETFs), which very low annual fees (around 0.2% or so). These are so-called passive funds, which mechanically buy and sell stocks such that their holdings match what is in their respective indices. No extra judgment on stock picking is required.
An alternative is to pick stocks yourself, or to buy into a fund with active management, where humans (and their algorithms) try to buy stocks which will beat the passive indices, and try to avoid losing stocks. The active versus passive debate has been going on for decades. There will always be some active funds that outperform in any given year. These successes help keep the allure of active management alive. On average, though, the performance of active funds (before fees) is generally not much different than the passive funds. Thus, with their added fees, the active funds are net losers.
However, there are always cheerful fund managers with a story on how they have a plan to kill it this year, and there are investors willing to buy those stories. Sometimes these fund managers take financial advisors out for expensive lunches, and, behold, said advisors then recommend these actively managed funds to their clients. And so, there are plenty of active funds that still exist. New ones are minted every year, even as some older ones go out of business.
A problem with benchmarking against a cap-weighted fund like SPY or QQQ is that these passive indices are actually very effective. These work as closet momentum-rewarding funds: as the share price of, say, Microsoft goes up and up (presumably because of accelerating earnings), its representation among the biggest 500 companies (by stock capitalization) goes up. Thus, the better, growing companies automatically keep making bigger contributions to the indices, while fading companies sink to lower and lower per cent weighting. That works well to relentlessly home in on the relatively few stocks that account for the gains of the entire market, and to weed down all those other firms, most of which are net losers on stock price over time. This algorithm governing the cap weighted funds is tough for active management to beat.
Having stated these challenges, I’d like to compare performance of some actively-managed funds that have shown enhanced performance in recent years. The problem is, of course, we cannot know if this outperformance will continue. But hopefully looking at performance and discussing the underlying strategies of the funds may help investors decide if they would like to participate in any of them.
Two broad categories of stock funds are growth and value. Growth looks at how fast a firm is increasing revenues, earnings, etc. Most tech stocks command high share prices because of their growth prospects, rather than current earnings (although many of the current big tech leaders generate gobs of cash). Value looks at measures such as price/earnings and price/sales and price/book value, hoping to find undervalued firms whose price does not yet reflect the underlying value. Tech funds are generally under-represented in the value category.
Here we will look at five good actively-managed ETFs, and compare total returns (with dividends reinvested) to the S&P 500 fund SPY. They all claim to incorporate both growth and value into their stock picking. These five funds are:
SPGP – This is a supposed “growth at a reasonable price” fund, which seems to weight value more than growth. In top ten holdings, there is only one tech stock, a 2.7% weighting of Nvidia. There are four petroleum companies, and diverse smattering of other types of firms.
GARP – Another “growth at a reasonable price” (note “G.A.R.P.”) fund. This tilts heavily toward growth: seven of the top ten holdings are tech, with 5.43% Nvidia.
PVAL – As indicated in the name (Putnam Focused Large Cap Value), this is a value fund, but with some growth considerations – – The top ten are: Walmart (retail), Exxon Mobil (petro), Thermo Fisher Scientific, Citigroup, Bank of America (finance), Oracle (tech), UnitedHealth Group (healthcare), Coca-Cola, NXP Semiconductors, and PulteGroup (homebuilder).
MOAT – – “VanEck Morningstar Wide Moat” – This fund seeks to replicate the performance of the Morningstar® Wide Moat Focus Index, which in turn tries to identify a diverse group of U.S. large companies with wide “moats”, that give them sustainable advantages over competitors. Four measures are used to determine a corporation’s dominance: Intangible Assets (brands, patents, proprietary technologies); Switching Costs (inconvenient for the customer to find an alternative); Network Effect (when customers use one service, they adopt additional company services); Cost Advantage.
FFLC – This fund uses “fundamental analysis” and looks for companies that can take advantage of trends in “technological advances, product innovation, economic plans, demographics, social attitudes, and other factors”. An analysis of the fund’s holdings (heavy in big tech; 6% Nvidia) shows a strong focus on growth and momentum, with a moderate value weighting.
All these funds have plausible rationales for choosing the stocks they do. A big question is always: how much of a company’s promise is already reflected in its stock price? If everyone else has already figured out that, say, Microsoft will have high sustained earnings growth, then maybe the current share price is so high that it will not go up any faster than the broad market.
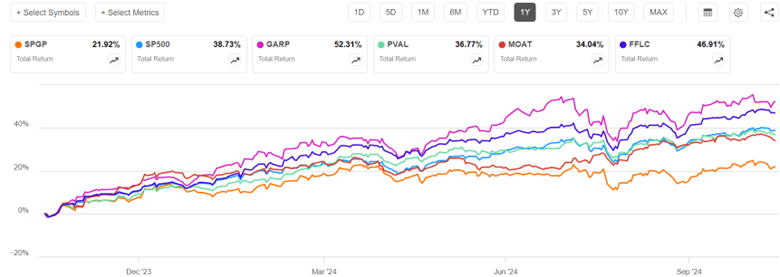
Now for the charts. I will discuss 1-year, 3-year, and 5-year charts, so we can see how the fund strategies worked in different market regimes. The one-year chart covers the raging bull market of the past twelve months, especially in AI-related tech/growth stocks. The 3-year chart encompasses a lengthy bear episode that occupied most of 2022, in reaction to the raising of interest rates to tamp down inflation. The 5-year chart includes the brief but sharp pandemic panic March-April 2020, sandwiched in a huge rise in internet-related big tech stocks 2019-2021.
One-Year Chart
Over the past one year, GARP (52% return) soared way above S&P 500 (blue line, 39%), but with high volatility, consistent with its heavy growth/tech exposure. FFLC steadily pulled ahead of SP500 over the past twelve months, racking up a 47% return. PVAL and MOAT finished close to SP500, while tech-poor SPGP flat-lined in the most recent six months and so got left far behind.
Three-Year Chart (End Oct 2021-end Oct 2024)
The defining features of the past three years were a roughly 21% bear market decline in S&P 500 during Jan-Oct 2022, followed by a strong recovery, which was interrupted by a moderate slump July-Oct 2023. FFLC and PVAL performed nearly identically for the first third of this time period (through early March, 2023). They dropped much less than SP500 in 2022, and so by early March, 2023 they were some 15% ahead of SP500. PVAL’s lead over SP500 shrank a bit over the next twelve months, and then widened March-July 2024, to give PVAL (43%) a 16% advantage over SP500 (27%) at the end of three years. FFLC just kept steadily widening its lead over SP500, ending with a 58% return over this three-year time period. MOAT and SPGP also fell less than SP500 in 2022, but fell more than PVAL and FFLC, and they did not keep pace with the tech-led surge in 2023-2024. In the end, MOAT finished essentially even with SPY, and SPGP finished lower (18%). Tech-heavy GARP crashed harder than SP500 in 2022, but more than made up for it with the 2024 tech-fest, finishing well above SP500 and tied with PVAL at 43%.
I won’t show the full five-year chart, since some of the funds did not start prior to that period. But I will make a few semi-quantitative comments. The five-year time period is a little kinder to SPGP – this fund showed a fairly consistent lead over SP500 in 2021 as well as 2022, and so got rave reviews then in the investing literature. It was only in the past six months that it performed so poorly.
FFLC got off to a rocky start, falling about 10% behind SP500 in 2020-2021, although its winning ways since then gave it the overall best 5-year performance. GARP and MOAT pretty much kept pace with SP500 Oct 2019-Oct 2021, so their five-year performance vs SP500 is about the same as for three-year (GARP soundly beat SP500, MOAT roughly tied).
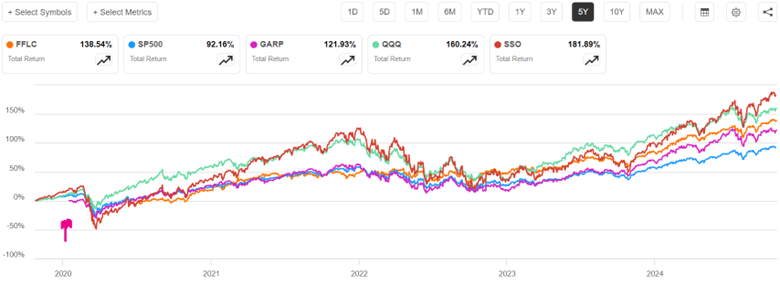
One more chart (below), a five-year comparison of SP500 to FFLC (overall winner among the active funds discussed above) and GARP (tech-heavy) to QQQ (passive, tech-heavy, tracks NASDAQ 100 stocks) and SSO (its stock price moves up and down 2X the daily price movement of S&P500). GARP didn’t start operation till early 2020 (marked by red arrow on chart), to its curve should be shifted up to make a fair comparison with the others; with this correction, it would end up roughly tied with FFLC, with both these funds beating SP500 by about 33% (135% return vs 92%). But even these stellar active funds were soundly beaten by QQQ and even more by the passive 2X fund SSO. Holders of SSO, however, would have suffered heart-stopping drawdowns along the way (e.g. over 50% loss in market value in early 2020).
Readers can draw their own conclusions from this flyover of results. Just like you can fool people some of the time, any active fund may beat “the market” (e.g., S&P 500) some of the time. Some active funds seem to beat the market most of the time. But it is most unlikely that any given fund will beat it all of the time. The S&P 500 algorithm is actually pretty effective. It may behoove the investor to make their own judgement as to what market regime we are in or are about to be in, and to choose active funds which are more likely to thrive in that regime.
I am motivated to include some FFLC (for overall consistent good performance) and PVAL (for a bit of crash protection) in my holdings. But I recognize that their performance could deteriorate in the future, if their investing style no longer works in some new market regime. SPGP is a cautionary example, going from rock star in 2021-2022 to awful in 2024. Even FFLC had an unfavorable first year of operation. The tech giants that dominate QQQ continue to also dominate earnings growth, so QQQ may continue to outpace SP500.
As far as SSO, I earlier wrote on strategies for 2X returns using 2X funds or call options. If you think stocks are going to keep going up, it can make sense to hold these 2X funds. Many advisors, though, recommend against just buy and hold because of the enormous possible losses in a crash; too many investors panic and sell at a low price in that situation. I hold some QLD, which is a 2X QQQ fund, but only as a minor component of my portfolio. Also, if I can overcome fear in the moment, I plan to swap out of plain vanilla stock funds and into a 2X fund like SSO after the next big dip in the market, and then swap back out of SSO after the market recovers.
Disclaimer: Nothing here should be considered advice to buy or sell any security.
This week at my university the Economics Department Co-hosted an event titled “Interest Rates and Student Loans” with the Office of Financial Aid. I discussed interest rates for a broad audience of young adults. Below is my talk on interest rates.
I focus much of my investing energy in the “high yield” area, finding stocks that pay out highish yields (8-12%, these days). Unless the company really hits hard times and has to cut its payout, I know I will make those returns over the next twelve months. But with ordinary stocks, you cannot count on any particular returns. The price of any stock a year from now will be the earnings per share (which can be forecasted with some degree of accuracy) times the price/earnings ratio, which is largely dependent on the emotions (“animal spirits”, in the words of Keynes) of the millions of market participants. Will I find a “greater fool” to buy my Amazon stock in a year for 20% more than I paid for it??
I have never gotten really comfortable with that as an investing model, and so I have erred on the side of caution and generally held less than the recommended 60% or so of my portfolio in plain stocks. In hindsight, that was a mistake. Every $10,000 put into the plain, dumb S&P500 fund SPY twenty years ago has turned into roughly $200,000. One reason for my caution has been a steady stream of articles that always warn that stocks are overvalued; after going up so much in the past X years, surely returns will be poor for the next several years.
But I try to learn from my mistakes, and I am now forcing myself to hold more equities than I “feel” like. To support this hopefully rational behavior, I am paying more attention to articles that present bull cases for stocks. One author on the Seeking Alpha investing site who has been consistently and correctly bullish for the past two years is Lawrence Fuller. Here I will summarize his Oct 9 article with the tongue-in-cheek title Be Afraid, Be Very Afraid. (To read articles on Seeking Alpha, you may have to start a free account, where you just have to give them an email address; I use my secondary “junk” email for these sorts of applications, which tend to send a lot of junky (not malicious) notifications).
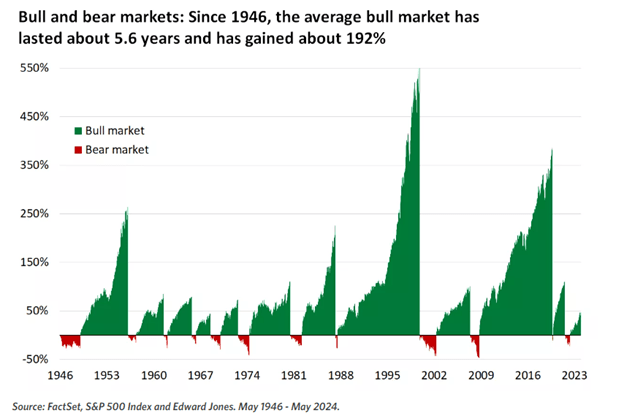
He first addressed the angst that says, “Stocks have already run up so much, they are due for a crash”, by means of this chart showing cumulative returns in preceding bull markets:
It is obvious that, compared to the average bull market, we are still in early innings with the present bull which started in Oct 2022.
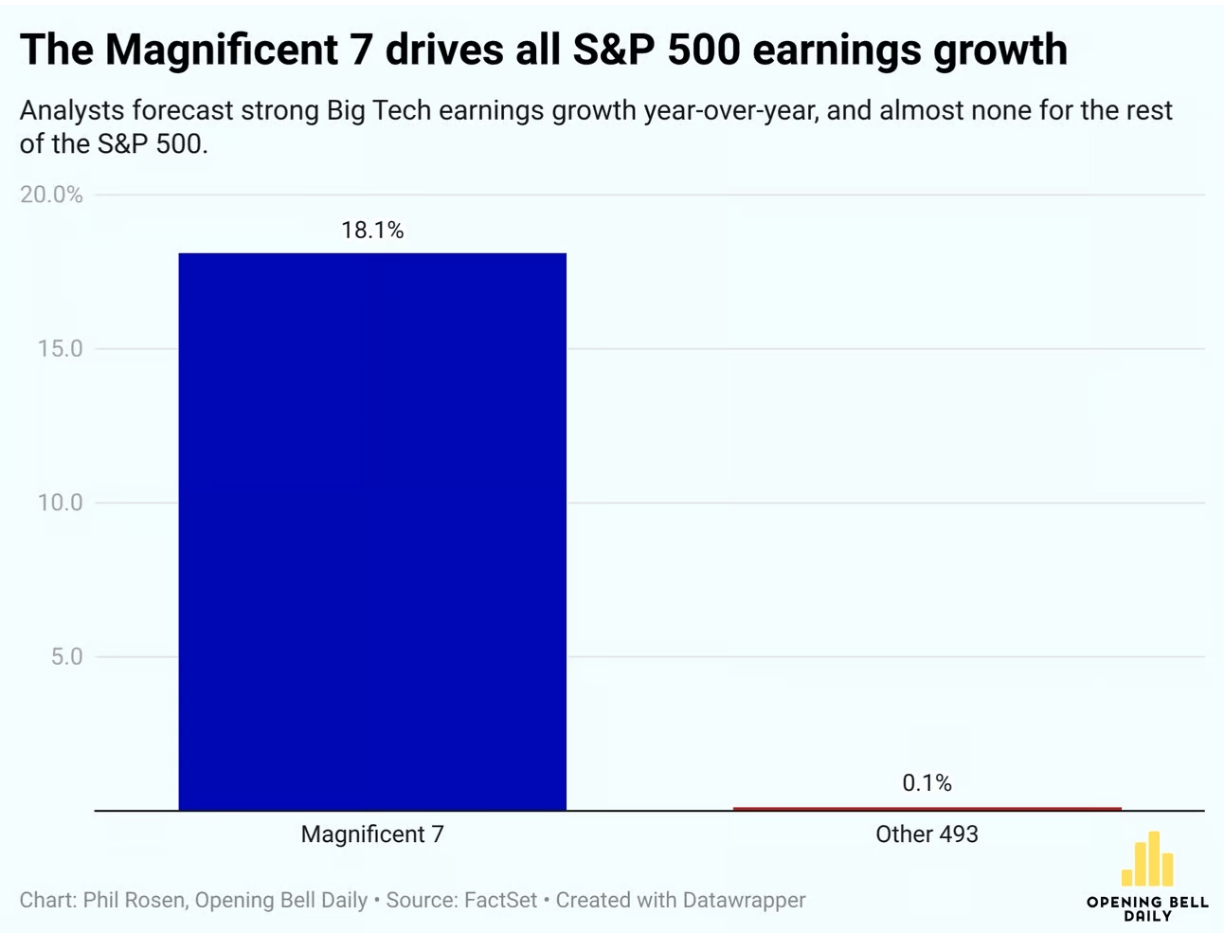
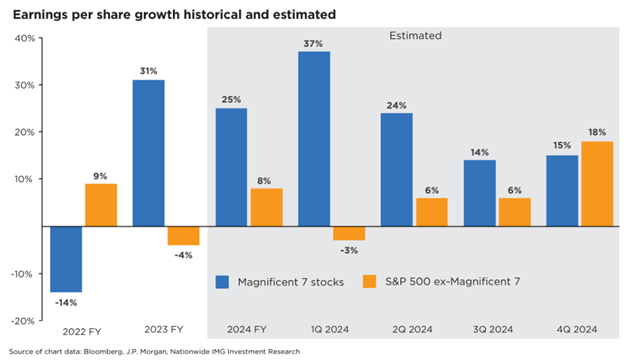
Fuller also makes the case that the good news on earnings has spread recently from the so-called Magnificent Seven big tech stocks (Microsoft, Apple, Nvidia, etc.) to the broader market. This should serve to support further price rises in the broad indices:
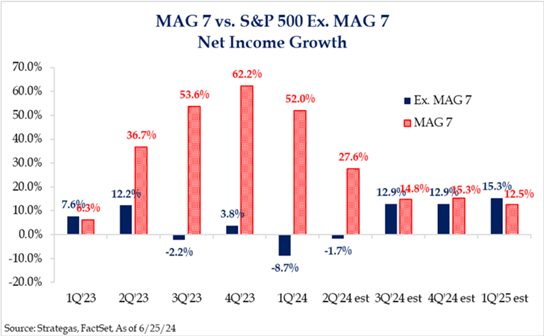
The chart below, which shows a similar story, in terms of net income growth:
He concludes:
“It is also important to recognize that the valuation of the S&P 500 is far more reasonable when we exclude the exceedingly expensive Magnificent 7 and focus on the remaining 493. In fact, we don’t have the valuation problem that bears purport we have today. Hence, I advised investors to avoid the market-cap-weighted indexes and focus on equal weight or look at sectors that had been left behind during the bull market to date…Therefore, I suggest not succumbing to fear. Instead, focus on whether the weight of evidence suggests we should be in wealth accumulation mode or wealth preservation mode.”
In a follow-up article, Are You Worried About An Overvalued Market? , Fuller notes that small cap stocks (as defined by the Russel 2000 index, which is held by the IWM fund) are more reasonably valued than big tech, and so are likely to outperform over the next year.
Economic data will appear alarming due to hurricane impacts, but the economy is growing at 3% with strong corporate profit prospects and low recession risk.
Inflation is on track to fall to 1.8% by May, with real wage growth outpacing pre-pandemic trends. Future inflation is expected to remain stable at 2.1% over the next 30 years.
Market valuation is not as overvalued as feared, with potential for significant upside (up to 30% to 38%) based on corporate profit growth and falling interest rates.
Short-term market volatility is normal; long-term investors should embrace corrections for potential high returns as fundamentals remain strong.
The average 2-year return after a 10+% correction is 35%, meaning long-term investors should embrace corrections as wonderful buying opportunities. Buy with confidence in the face of any short-term market weakness, as long as you stick to your optimal personal asset allocation, based on your specific risk profile and financial needs.
This article has a number of interesting and informative sections, including on why cash flow/enterprise value is a better metric for assessing the valuation of a stock than price/earnings.
Kalshi just announced that they will begin paying interest on money that customers keep with them, including money bet on prediction market contracts (though attentive readers here knew was in the works). I think this is a big deal.
First, and most obviously, it makes prediction markets better for bettors. This was previously a big drawback:
The big problem with prediction markets as investments is that they are zero sum (or negative sum once fees are factored in). You can’t make money except by taking it from the person on the other side of the bet. This is different from stocks and bonds, where you can win just by buying and holding a diversified portfolio. Buy a bunch of random stocks, and on average you will earn about 7% per year. Buy into a bunch of random prediction markets, and on average you will earn 0% at best (less if there are fees or slippage).
This big problem just went away, at least for election markets (soon to be all markets) on Kalshi. But the biggest benefit could be how this improves the accuracy of certain markets. Before this, there was little incentive to improve accuracy in very long-run markets. Suppose you knew for sure that the market share of electric vehicles in 2030 would over 20%. It still wouldn’t make sense to bet in this market on that exact question. Each 89 cents you bet on “above 20%” turns into 1 dollar in 2030; but each 89 cents invested in 5-year US bonds (currently paying 4%) would turn into more than $1.08 by 2030, so betting on this market (especially if you bid up the odds to the 99-100% we are assuming is accurate) makes no financial sense. And that’s in the case where we assume you know the outcome for sure; throwing in real-world uncertainty, you would have to think a long-run market like this is extremely mis-priced before it made sense to bet.
But now if you can get the same 4% interest by making the bet, plus the chance to win the bet, contributing your knowledge by betting in this market suddenly makes sense.
This matters not just for long-run markets like the EV example. I think we’ll also see improved accuracy in long-shot odds on medium-run markets. I’ve often noticed early on in election markets, candidates with zero chance (like RFK Jr or Hillary Clinton in 2024) can be bid up to 4 or 5 cents because betting against them will at best pay 4-5% over a year, and you could make a similar payoff more safely with bonds or a high-yield savings account. Page and Clemen documented this bias more formally in a 2012 Economic Journal paper:
We show that the time dimension can play an important role in the calibration of the market price. When traders who have time discounting preferences receive no interest on the funds committed to a prediction-market contract, a cost is induced, with the result that traders with beliefs near the market price abstain from participation in the market. This abstention is more pronounced for the favourite because the higher price of a favourite contract requires a larger money commitment from the trader and hence a larger cost due to the trader’s preference for the present. Under general conditions on the distribution of beliefs on the market, this produces a bias of the price towards 50%, similar to the so-called favourite/longshot bias.
We confirm this prediction using a data set of actual prediction markets prices from 1,787 market representing a total of more than 500,000 transactions.
Hopefully the introduction of interest will correct this, other markets like PredictIt and Polymarket will feel competitive pressure to follow suit, and we’ll all have more accurate forecasts to consult.
There’s so much to say about interest rates. Many people think about them in the context of whether they should refinance or in terms of their impact on borrowing. But interest rates also matter for production beyond impacting loans for new productive projects. Interest rates aren’t just a topic for debtors.
Interest rates impact all production that takes time. That’s the same as saying that interest rates affect all production – but the impact is easier to see for products that require more time to produce.
There’s this nice model called ‘Portfolio Theory’. Taken literally, it says that everything you own can be evaluated in terms of its liquidity, the time until it will be sold, its expected returns, and the volatility and correlation of those returns. Once you start to look at the world with this model, then it’s much easier to interpret. Buying a car? That’s usually a bad investment. It’s better to tie up a smaller amount of money into that depreciating asset rather than to let a larger sum of money experience dependably negative returns. Of course, this assumes that there are alternative uses for your money and alternative places to invest your resources – hopefully in assets with growing rather than decaying value. People often recommend purchasing used cars rather than new cars. Both new and used cars are bad investments and you can choose to invest a lot or a little.
Producers make a similar calculation. All kinds of things motivate them: love, tradition, excellence… But everyone responds to incentives. Consider vintners. They might be a farmer of grapes and a manufacturer and seller of wine. They might like to talk about nostalgia, forward notes, a peppery nose, and other finer things. But even they respond to prices and opportunity cost.