Several recent tweets(xeets) about tech talent re-ignited the conversation about native-born STEM workers and American policy. For the Very Online, Christmas 2024 was about the H-1B Elon tweets.

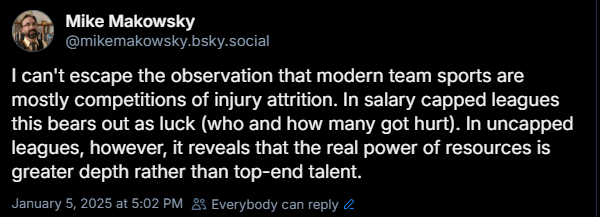
Elon Musk implies that “elite” engineering talent cannot be found among Americans. Do Americans need to import talent?
What would it take to home grow elite engineering talent? Some people interpreted this Vivek tweet to mean that American kids need to be shut away into cram schools.

The reason top tech companies often hire foreign-born & first-generation engineers over “native” Americans isn’t because of an innate American IQ deficit (a lazy & wrong explanation). A key part of it comes down to the c-word: culture. Tough questions demand tough answers & if we’re really serious about fixing the problem, we have to confront the TRUTH:
Our American culture has venerated mediocrity over excellence for way too long (at least since the 90s and likely longer). That doesn’t start in college, it starts YOUNG. A culture that celebrates the prom queen over the math olympiad champ, or the jock over the valedictorian, will not produce the best engineers.
– Vivek tweet on Dec. 26, 2024
My (Joy’s) opinion is that American culture could change on the margin to grow better talent (and specifically tech talent) resulting in a more competitive adult labor force. This need not come at the expense of all leisure. College students should spend 10 more hours a week studying, which would still leave time for socializing. Elementary school kids could spend 7 more hours a week reading and still have time for TV or sports.
I’ve said in several places that younger kids should read complex books before the age of 9 instead of placing a heavy focus on STEM skills. Narratives like The Hobbit are perfect for this. Short fables are great for younger kids.
The flip side of this, which creates the puzzle, is: Why does it feel difficult to get a job in tech? Why do we see headlines like “Laid-off techies face ‘sense of impending doom’ with job cuts at highest since dot-com crash” (2024)
Which is it? Is there a glut of engineering talent in America? Are young men who trained for tech frustrated that employers bring in foreign talent to undercut wages? Is there no talent here? Are H-1B’s a national security necessity to make up the deficit of quantity?
Previously, I wrote an experimental paper called “Willingness to be Paid: Who Trains for Tech Jobs?” to explore what might push college students toward computer programming. To the extent I found evidence that preferences matter, culture could indeed have some impact on the seemingly more impersonal forces of supply and demand.
For a more updated perspective, I asked two friends with domain-specific knowledge in American tech hiring for comments. I appreciate their rapid responses. My slowness, not theirs, explains this post coming out weeks after the discourse has moved on. Note that there are differences between the “engineers” whom Elon has in mind in the tweet below versus the broader software engineering world.

Software Engineer John Vandivier responds:
Continue reading