It’s been a while since I updated my generational wealth chart, and we now have estimates through the 2nd quarter of 2026, so here’s the latest chart:
Figure 1
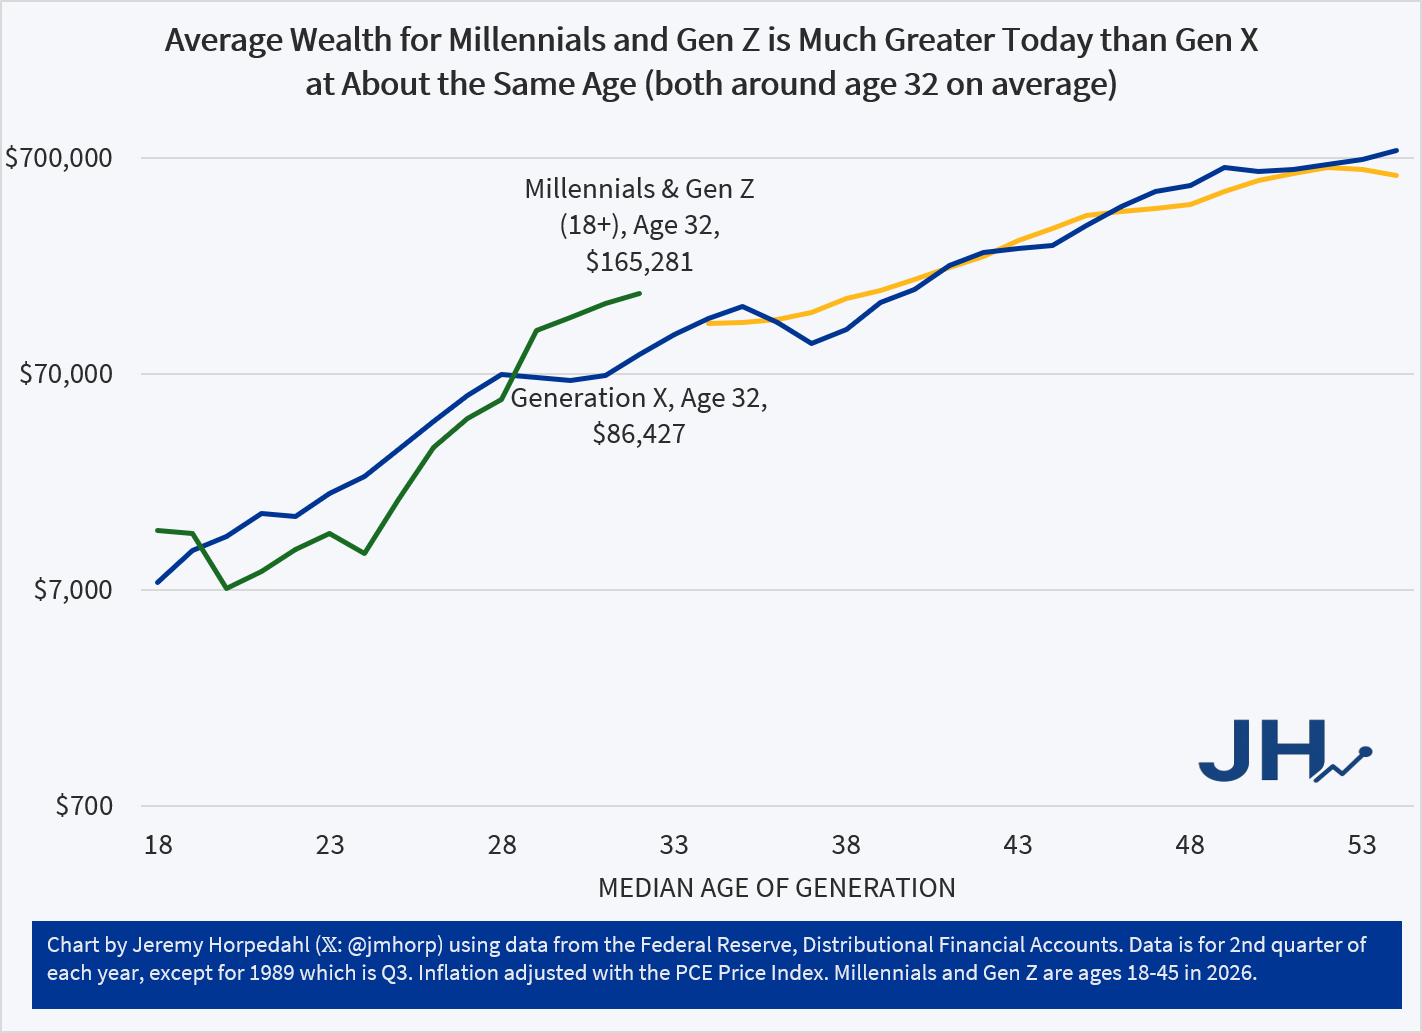
Wealth for younger Americans continues to grow substantially, but let me make two caveats:
- Yes, I know median data is better. I’m writing a book that uses median wealth data! But the latest median wealth data from the Fed’s SCF is currently only available through 2022, so it’s not super relevant to current conversations. We should have the 2025 data soon.
- Because of the way the data in my chart is produced in the Fed’s DFA, it groups everyone under age 45 together. That’s a mighty big group, and it because it encompasses both Millennials and a lot of Gen Z, it makes it hard to directly compare to earlier generations.
So, until we have 2025 median wealth data, and until the Fed’s DFA starts breaking out Millennials and Gen Z, here is my current best compromise chart:
Figure 2
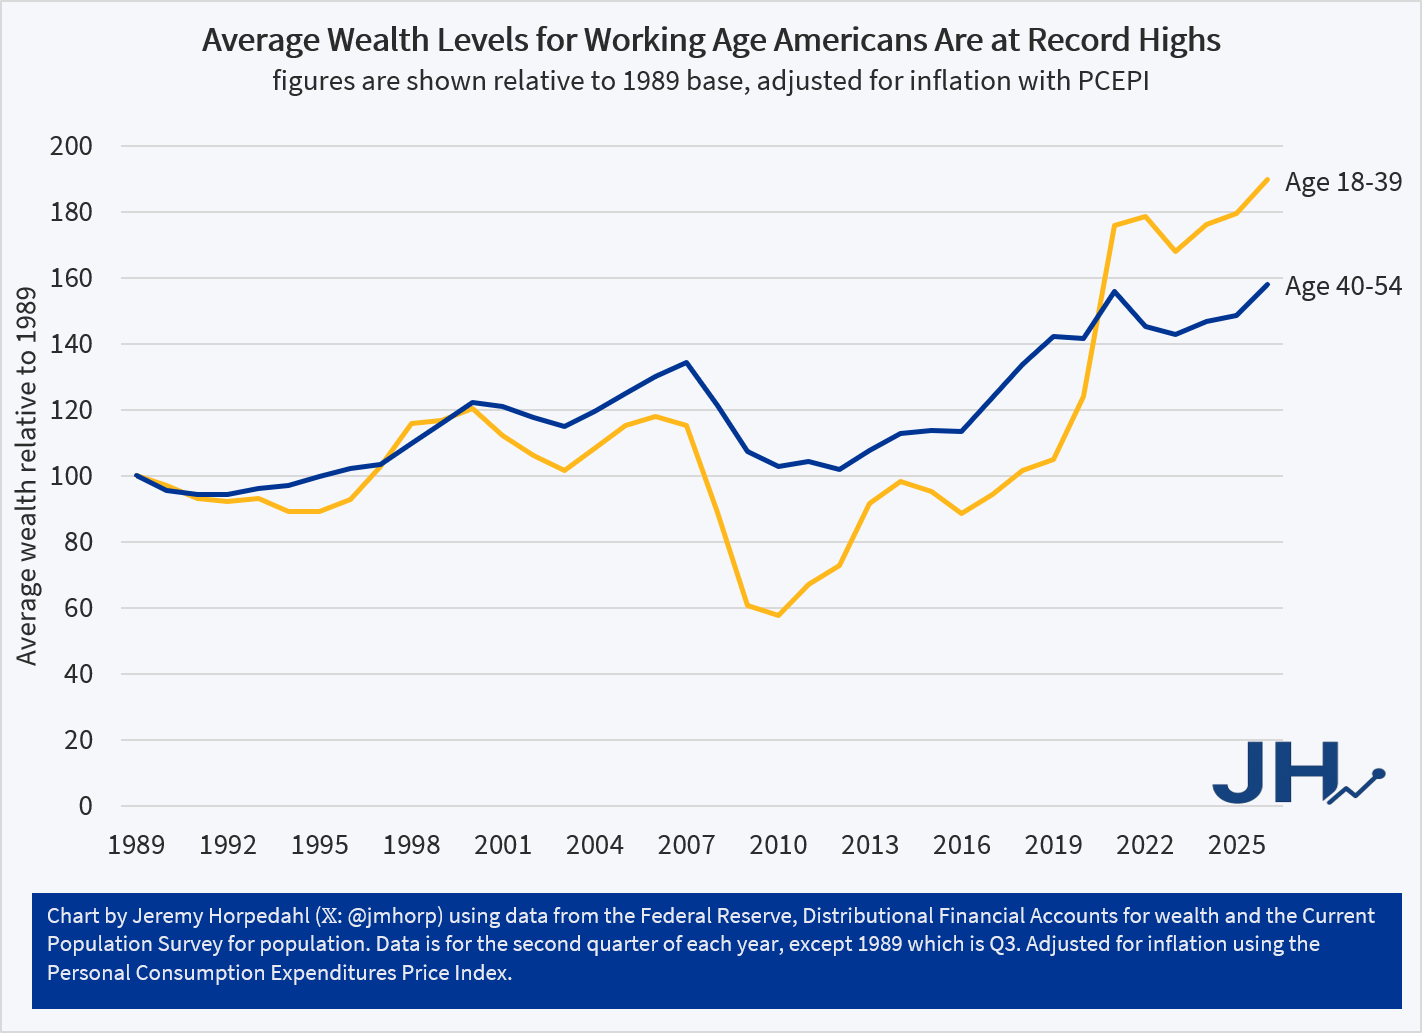
In Figure 2, I have used the Fed DFA data for age groups, which are still pretty large groups, but you can consistently compare them over time. The average wealth level of both the 18-39 group and the 40-54 group have seen substantial gains. In fact, the gains for younger cohorts have been even better than middle-aged Americans, though both saw substantial gains.
And this chart shouldn’t be affected by the lack of household formation among some younger Americans: I am using the full population as the denominator, so if anything, this will understate growth rates. Even so, the growth rate from the depths of Financial Crisis in 2010 have been substantial: 228 percent growth from 2010 to 2026 for ages 18-39. The growth rate for ages 40-54 was less dramatic, though they also didn’t experience as large of a slump from 2007-2010.
While we can always hope and work towards growth rates being better, average wealth for Americans of working age is currently at record highs, having fully recovered from both the Financial Crisis and the inflation slump of 2022.

