Following up on my recent post on country GDP growth rates and mortality in 2020, we now have the first look at state GDP growth rates for 2020 from the BEA.
As with the national data, I would look to caution against over-interpreting this data. I’m presenting it here to give a picture of how 2020 went for states (including a few months of 2021 for morality data). One thing you will notice is that there appears to be little correlation with the raw data between GDP declines and mortality. Lots of important factors (policy, behavior, demographics, weather, luck) aren’t controlled for here. Still, I think it’s useful to see all the data in one picture, given how much many of us have been following the daily, weekly, and monthly releases.
Here is the data. Below I’ll explain more how I created this chart, especially the excess mortality data.
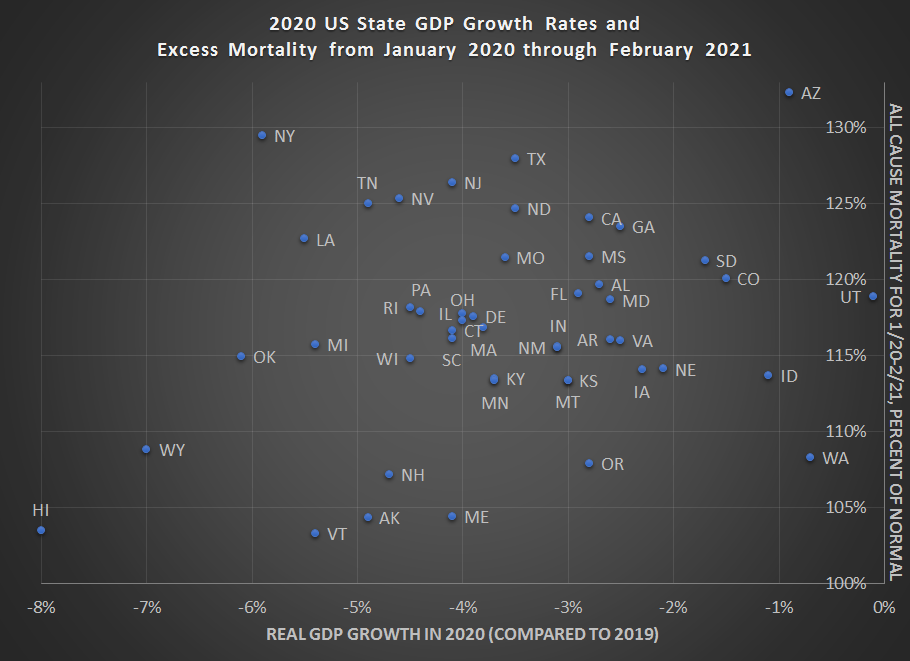
The GDP data comes straight from the BEA. It is the total economic activity in a state in 2020 compared with the total economic activity in 2019 (as always, adjusted for inflation). While there was quite a range for US states, not a single state avoided a decline for all of 2020 (the overall decline in the US was -3.5%). Utah was oh-so-close, but everyone was hurt. Did more stringent government restrictions lead to more deep economic declines? You can’t answer that question very easily. But it is worth asking, though most of the attempts out there right now I would say are… well, less than rigorous.
But even the worst performing states, Hawaii and Wyoming, fare well when compared with many major European countries. We might say they are worse than Germany, roughly equal to France, and much better than the UK in terms of economic performance.
The mortality data requires more of an explanation. To construct it, I used CDC monthly death data for each state.* I compared the 14 months from January 2020 through February 2021 (March data is very incomplete right now). I compared these 14 months with a “normal” 14 months, which I also estimated using CDC data from prior years. This isn’t a perfect approach, but I think it does have a nice logic.
I think it’s also superior to the officially reported “COVID deaths” in a few ways. First, states might have different criteria by which they code deaths as COVID-related (though the CDC has tried to get them to standardize, it isn’t perfect). Some states may under-report, other may over-report. Second, there are a number of excess deaths that occurred in the past year plus that aren’t directly from the virus, but are in some way related to the pandemic, as well as both the personal and policy responses to the pandemic. I will not wade into the debate as to whether it was personal behavior or government policy that was more responsible for the recession. But when a recession hits, we get various categories of deaths that also increase.
Sorting all that out will take much better data than we have right now, and it’s an important question, but be wary of anyone who strongly claims that they definitively know the answer to the “lockdowns or pandemic?” question right now.
All that background aside, notice that we do have a lot of variation in the excess deaths during the pandemic. Some states are between 5% and 10% above normal, and a few are more than 25% normal. Most states are clustered in the roughly 12.5% to 20% above normal range.
There are two ways to interpret this variation. One, it’s possibly all just random. The number of deaths a state experienced could be largely outside of their control, determined mostly by background demographics and pure luck (good or bad). The alternative interpretation, which I suspect is likely to be the case, is that some factors mattered. A LOT. Are these factors personal behavioral response? Government policies (for good and ill)? Some combination of the two?
Once again, these are excellent social scientific questions. I won’t claim to know the answer right now. The data is too incomplete. But it’s undoubtedly a question many economists and other social scientists will be trying to answer for years to come.
*Note: I have excluded North Carolina and West Virginia from the chart. For some reason, they are 3-4 months behind other states in reporting mortality data to the CDC, so deaths appear to be below normal for these states.

One thought on “The Impact of the Pandemic on US States: GDP and Deaths”