The latest CPI inflation data was released this morning. Mostly the new data just confirms what we’ve seen the past few months: consumer price inflation is at the highest levels in decades, and it is now very broad based.
To see how broad based the inflation is, we can look at any of the “special aggregates” that the BLS produces. CPI less food. CPI less shelter. CPI less food, shelter, energy, used cars and trucks (what a mouthful!). All of these are up substantially over the past year. The lowest number you can get is that last aggregate I listed, which excludes almost 60% of consumer spending, and even it is up 4.7% over the past year — the largest increase since 1991 for that particular special index.
Or, you can just look at food. We all have probably observed that meat prices are way up recently — about 15% over the past year. But it’s not just meat. It’s fruit, vegetables, grains, dairy… the whole darn food pyramid. In fact, there are only two food categories (hot dogs and cheese) and two drinks (tea and wine) that are actually down since December 2020.
I’ve covered the symbolic importance of hot dog prices before, but the fact that only four food or drink categories had price decreases are indications that food-price inflation is extremely broad-based.
So what’s causing the inflation?
This is a question I’ve tried to address before. Yesterday, my co-blogger Scott argued that the primary driver is surging demand, fueled by COVID payments, which are paid for with deficits financed with increases in the money supply. In other words, inflation is primarily a monetary phenomenon.
Given that I downplayed the role of monetary policy too much 6 months ago, and focused on supply-chain issues, I should be cautious when arguing against the importance of monetary policy. But let’s look at the data in a little more detail.
This chart from the CEA remains one of my favorites:
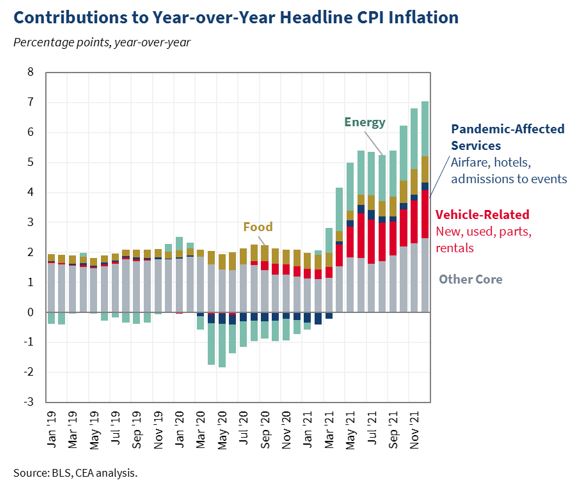
For inflation over the past year, we can say that roughly 1/4 comes from energy, 1/4 is “vehicle related” plus pandemic-affected services, and the remaining 1/2 is… everything else.
For each factor, is it most accurate to say these changes are due to supply chains, monetary inflation, or a combination?
For the 1/4 of the increase from vehicle prices and pandemic-affected services, these seem like the best case for supply chain problems.
For the 1/4 from energy prices, I’d say it is a mix. Energy prices are primarily set globally, though the US is a big part of global demand. Put there are undoubtedly supply-chain issues for energy as well. Let’s call this one roughly half caused by each.
And finally, for the half of inflation caused by everything else? Some of this is supply-chain issues, for certain particular goods, but here I would agree that this is mostly an increase in demand. Some of that demand may be “pent up,” both in the sense of people having saved during the pandemic and just a desire to buy stuff they weren’t able to during the worst of the pandemic. But a lot of it too is because people have more money in their pockets as a result of fiscal stimulus (paid for with deficit-financed new dollars).
So what’s the bottom line? I’m inclined to agree with Scott’s argument that the primary cause, meaning more than half of the total effect, of inflation is monetary policy. But there’s still a lot of impact from supply chain issues and other pandemic peculiarities.
As always, we’ll wait for more data, and reevaluate in a month or two.

The supply chain costs or Covid dollars probably both seems likely. In the UK we are seeing price inflation rise too but there hasn’t been any helicopter money yet inflation likely to be similar. We need to be wary of rushing to blame monetary policy.
LikeLike