While we know that COVID primarily affects the elderly, the mortality and other effects on the non-elderly aren’t trivial. I have explored this in several past posts, such as this November 2021 post on Americans in their 30s and 40s. But now we have more complete (though not fully complete) mortality data for 2021, so it’s worth revisiting the question of COVID and the non-elderly again.
For this post, I will primarily focus on the 12-month period from November 2020 through October 2021. While data is available past October 2021 on mortality for most causes, data classified by “intent” (suicides, homicides, traffic accidents, and importantly drug overdoses) is only fully current in the CDC WONDER data through October 2021. This timeframe also conveniently encompasses both the Winter 2020/21 wave and the Delta wave of COVID (though not yet the Omicron wave, which was quite deadly).
First, let’s look at excess mortality using standard age groups. For this calculation, I use the period November 2018 through October 2019 as the baseline. The chart shows the increase in all-cause deaths in percentage terms. It is also adjusted for population growth, though for most age groups this was +/- 1% (the 65+ group was 3% larger than 2 years prior).
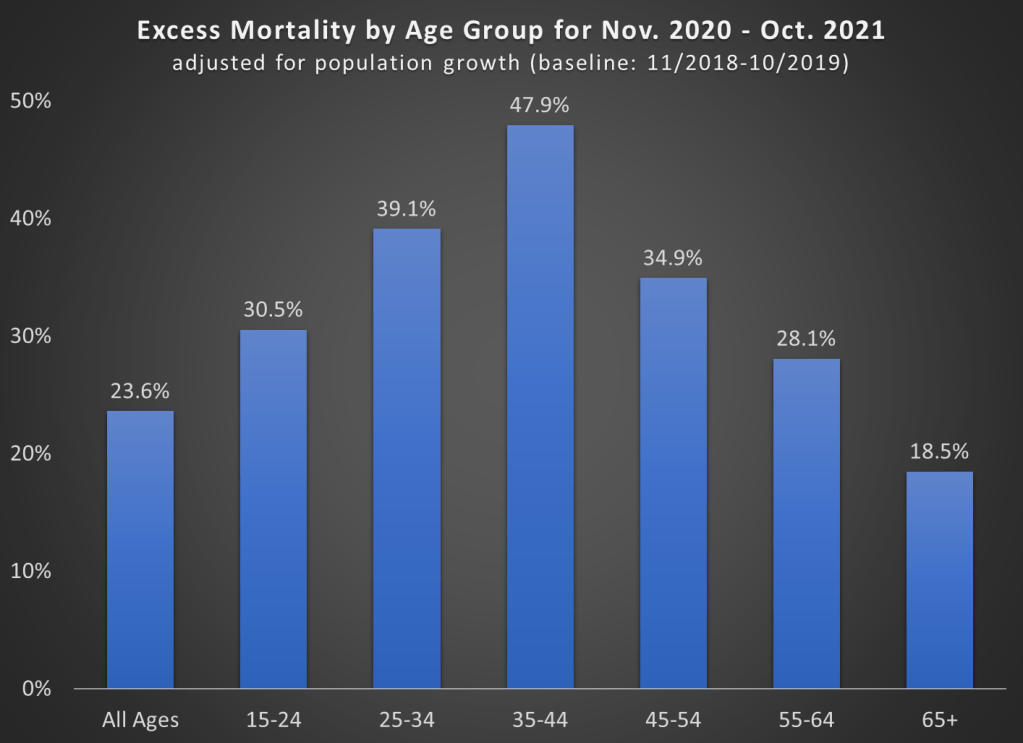
A few things jump out here. First notice the massive increase in mortality for the 35-44 age group (much more on this later). Almost 50% more deaths! To put that in raw numbers, deaths increased from about 82,000 to 122,000 for the 35-44 age group, and population growth was only about 1%. And while that is the largest increase, there were huge increases for every age group that includes adults.
Also notice that the 65+ age group certainly saw an increase, but it is the smallest increase among adults! Of course, in raw numbers the 65+ age group had the most excess deaths: about 450,000 of the 680,000 excess deaths during this time period. But since the elderly die at such high rates in every year, the increase was as large in percentage terms.
One related fact that doesn’t show up in the chart: while there were about 680,000 excess deaths during this time frame in the US in total, there were only about 480,000 deaths where COVID-19 was listed as the underlying cause of death. That means we have about 200,000 additional deaths in this 12-month time period to account for, or a 24% increase (population growth overall was only 0.4%).
That’s a lot of other, non-COVID deaths! What were those deaths? Let’s dig into the data.
Here’s one way to look at the increase in mortality. The table below shows the 15 leading causes of death in the US (by underlying cause of death, meaning each death is only counted once with just one cause) for the period from Nov. 2020 through Oct. 2021. It also shows the increase from 2 years prior, as well as what percent of the non-COVID excess deaths each cause accounts for. In total, there were about 198,000 non-COVID excess deaths.

Of those 198,000 non-COVID excess deaths, we can account for about 2/3 of them using just these 15 causes of death (or really 14 causes of death, since I’m excluding COVID from this calculation). Over half of the non-COVID mortality increase is from heart disease, accidents (which includes both ODs and traffic accidents, as well as others), and diabetes.
What if we do a similar look at the increase in deaths for the 35-44 age group, which saw the biggest increase in percentage terms? The table below shows that data.

For this age group, only about 15,000 of the 40,000 excess deaths can be explained by COVID. And of those non-COVID excess deaths, almost 2/3 can be explained by accidents, heart diseases, and chronic liver diseases.
Accidents and heart disease show up as being main drivers of the increase in mortality for almost every age group. And for accidents, we are primarily talking about accidental drug overdoses: 34,000 of the 49,000 excess accidental deaths for all ages were drug ODs, and for age 35-44 it was 9,300 of the 11,700 excess accidental deaths. Digging further into these two areas will give us some more information on why there are so many excess deaths. Between COVID-19, accidental drug ODs, and heart disease, we can explain over 80% of the excess deaths in the US (and 2/3 of the excess deaths for age group 35-44).
Accidental Drug Overdoses

The one major thing we know is that accidental drug overdoses have been rising in the US for years. And while the spike in April and May 2020 is undeniable, there was already a suggestion in late 2019 that the already-historic-highs were continuing to rise at an elevated rate.
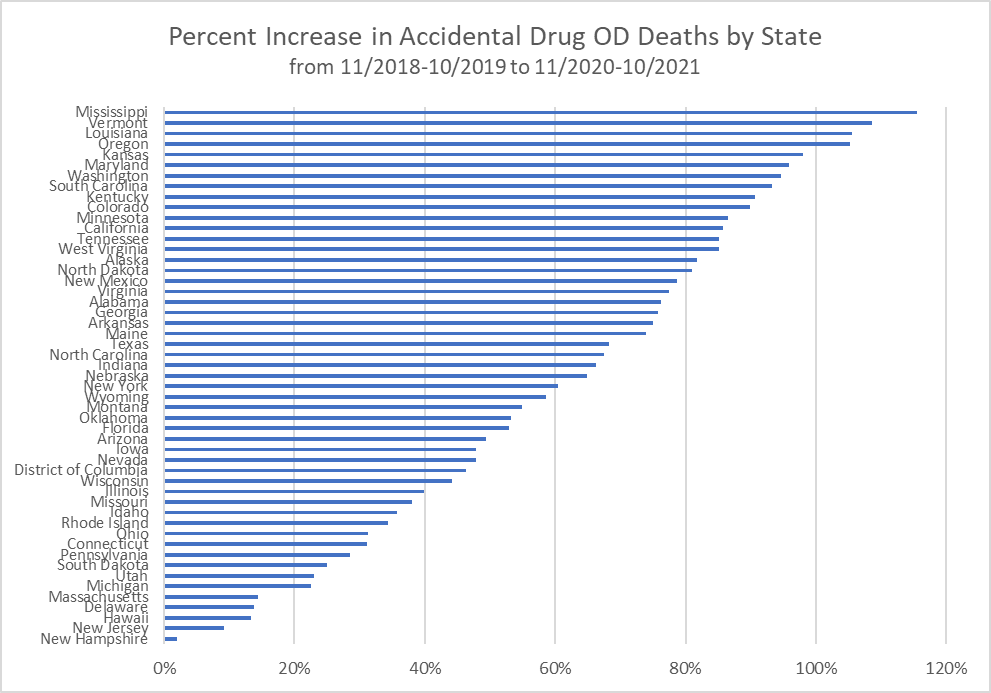
It is also worth exploring whether states with different levels of COVID restrictiveness had a larger increase in accidental drug overdoses. Perhaps lockdowns are to blame?
This question is worth exploring in a lot more detail, and I hope other researchers do. But a quick look at accidental drug OD deaths by state doesn’t show any clear pattern. States are all over the board, from basically no increase in New Hampshire and New Jersey, to 110% increases in Vermont and Mississippi. Overdoses are clearly an on-going, rapidly increasing social problem, it was clearly exacerbated by the pandemic, but to what extent government policy during the pandemic affected this trend is not clear.
Heart Disease
Finally, a brief discussion of heart disease. Since this is the single biggest non-COVID cause of excess mortality with 37,000 of the 198,000 deaths that need to be accounted for, it deserves more than a brief discussion. And as with ODs, I know others will dive even deeper. But I want to make two points about heart disease.
First, some of the heart disease increase is likely due to COVID-19. There were over 13,000 deaths during this time period where heart disease was the underlying cause, but COVID-19 was also listed as a contributing cause. Of course, that’s just 2% of all heart disease deaths during this period, but we shouldn’t discount the possibility that COVID is contributing importantly to the rise in heart disease deaths.
The last point though is an important one: are vaccines causing the increase in heart disease? This is an important question, and there have been a wide variety of reports, mostly anecdotal but some more serious, suggesting that vaccinations could be cause heart problems in some people. Is this a plausible explanation?
I think not. Here’s one reason why: heart disease deaths were elevated in 2020 as well, before vaccines were available, and the increase was slightly larger in 2020 than in 2021 (when vaccines were being administered). This chart shows the monthly number of heart disease deaths in the US, population adjusted.
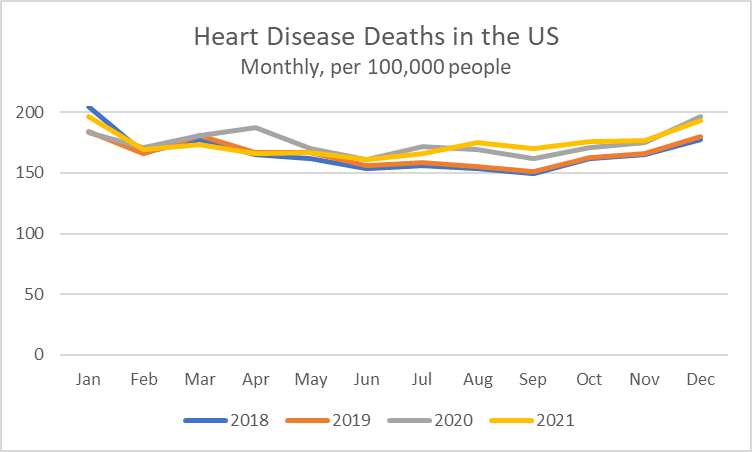
Heart disease deaths start to diverge from normal levels (2018 and 2019 counting as “normal”) in April 2020. This can’t be explained by vaccines. They continue to be elevated through the rest of 2021 (we can use all of 2021 here, rather than just through October as above, since this is not an “intent” category). Once again, I know this will be looked at with more depth by researchers who know more about it, but based on the chart above, something about the pandemic or the disease COVID-19 itself seems to be explained the elevated heart disease deaths, not the distribution of vaccines.
But at the very least, could the vaccines explain the rise in heart disease deaths among the 35-44 age group that we are interested in? While drug ODs were the main category of death increase for this group, the extra 2,000 heart disease deaths (for the 12-month period I’ve focused on) seems like it could be very worrisome for an age group that shouldn’t have many heart deaths. But once again, the chart below suggests that the vaccines aren’t the explanation.
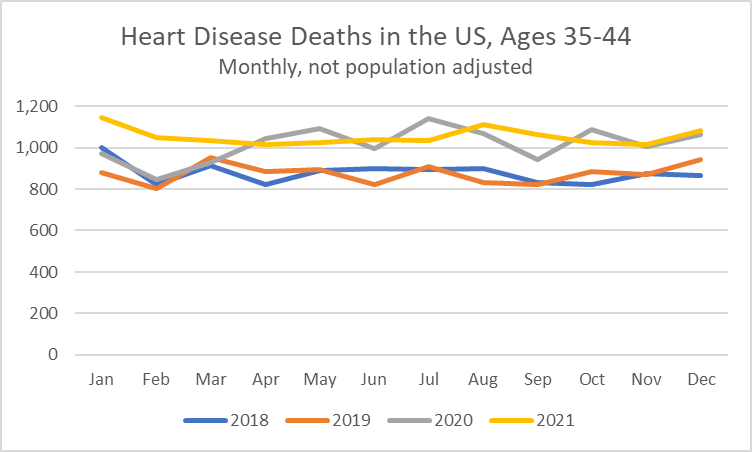
These numbers aren’t population adjusted (I couldn’t easily find monthly population data by age that is current), but you can still clearly see that the rise in heart deaths for ages 35-44 begins in April 2020, and it remains elevated without too much variation up through the rest of 2020 and all of 2021. There’s a little more monthly variation in this data, given that small numbers can fluctuate more randomly, but April 2020-December 2021 looks like one long period of elevated mortality, not something that just start in 2021.
That’s a lot of data for one post. And some very grim data indeed, as the US has just passed 1,000,000 confirmed COVID deaths (not all of these will have COVID as the underlying cause, but roughly 90% will). Trying to understand what caused all deaths, not just COVID deaths, is extremely important. But I hope that this post pushes back against two narratives I see quite frequently: the lockdowns increased drug ODs, and that vaccines increased heart disease deaths. Both of those seem unlikely given that data I’ve shared here.

Jeremy,
Nice work.
Now do fat people.
I understand that obesity was the primary co-morbidity.
Best,
Gale
LikeLike
Obesity was only a co-morbidity in 49,000 COVID deaths throughout the pandemic. The most common contributing conditions were influenza/pneumonia, respiratory failure, and hypertensive diseases. There were 15 contributing conditions that were more important than obesity.
Source: https://www.cdc.gov/nchs/nvss/vsrr/covid_weekly/index.htm#Comorbidities
LikeLike
You missed an important group–those 85+ y.o. Their deaths DECLINED in 2021 relative to 2020. However, heart disease, cancer and stroke remained level, so who was dying from heart disease, cancer, and stroke in 2021? Your graph shows the answer. There was a 17% increase in 2021 relative to 2020 of working age deaths in what primarily had been elderly diseases. Vaccines have been accused of increasing heart disease, cancer, and stroke. That is the simplest explanation.
I figure that about 1/3 of the increase in working age deaths in 2021 was due to covid, 15% was due to delayed health care, and the balance to vaccines.
LikeLike
The last chart I posted shows heart disease deaths for ages 35-44. There is no increase in 2021 relative to 2020 pandemic months.
LikeLike
Except for Jan. & Feb., where the increase was marked.
The stats for drug ODs will always be a bit weird, won’t they? Overall, there was no increase in drug OD’s for 2021 over 2020.
And you have no comment about the 85+ y.o. group and which group is replacing them in elderly disease deaths?
I use deadorkicking.
LikeLike
The Jan/Feb 2021 numbers are elevated above Jan/Fed 2020 because those were pre-pandemic months. Jan/Feb 2021 are in line with all other pandemic months.
I don’t understand what you mean by “replacing them in elderly disease deaths.”
LikeLike
“I don’t understand what you mean by “replacing them in elderly disease deaths.””
Ceteris paribus, with 85+ y.o. deaths falling 14%, the 85+ y.o. drop in contribution to heart disease, cancer, and stroke should have resulted in a decline in heart disease, cancer, and stroke, but that didn’t happen. Who was dying from heart disease, cancer, and stroke?
The 75-84 y,.o. group mortality was down 4%, so it wasn’t them. The 65-74 y.o. mortality was up 7%, most of which was likely due to covid. So who was dying from heart disease, cancer, and stroke (which are the diseases of the elderly)?
“The Jan/Feb 2021 numbers are elevated above Jan/Fed 2020 because those were pre-pandemic months”
So you’re claiming that the pandemic resulted in more heart disease deaths in Jan.-Feb. 2021? That seems strange. Maybe some health care workers 35-44 were dying from heart disease following vaccination? And when were vaccines rolled out to the 35-44 y.o. group?
“December
December 18, 2020
FDA issued the second EUA for use of the Moderna COVID-19 vaccine in persons aged 18 years and older for the prevention of COVID-19.
December 14, 2020
The first deliveries of the COVID-19 vaccines began.
December 11, 2020
FDA issued the first emergency use authorization (EUA) for use of the Pfizer-BioNTech COVID-19 vaccine in persons aged 16 years and older for the prevention of COVID-19.”
LikeLike
Nice work, important and clear
LikeLike