Back in April I wrote about GDP growth rates and inflation rates in G7 countries and the OECD broadly. James also wrote about a broader set of countries (182!) using these two measures. Since the economic scene is evolving so quickly, and we now have 6 more months of data, I wanted to provide an update on the US and our other large peer nations.
Here’s the data, showing cumulative real GDP growth and cumulative core inflation since the right before the pandemic (please note that I flipped the x- and y-axis from the previous post — sorry for the confusion, but this way makes more sense).
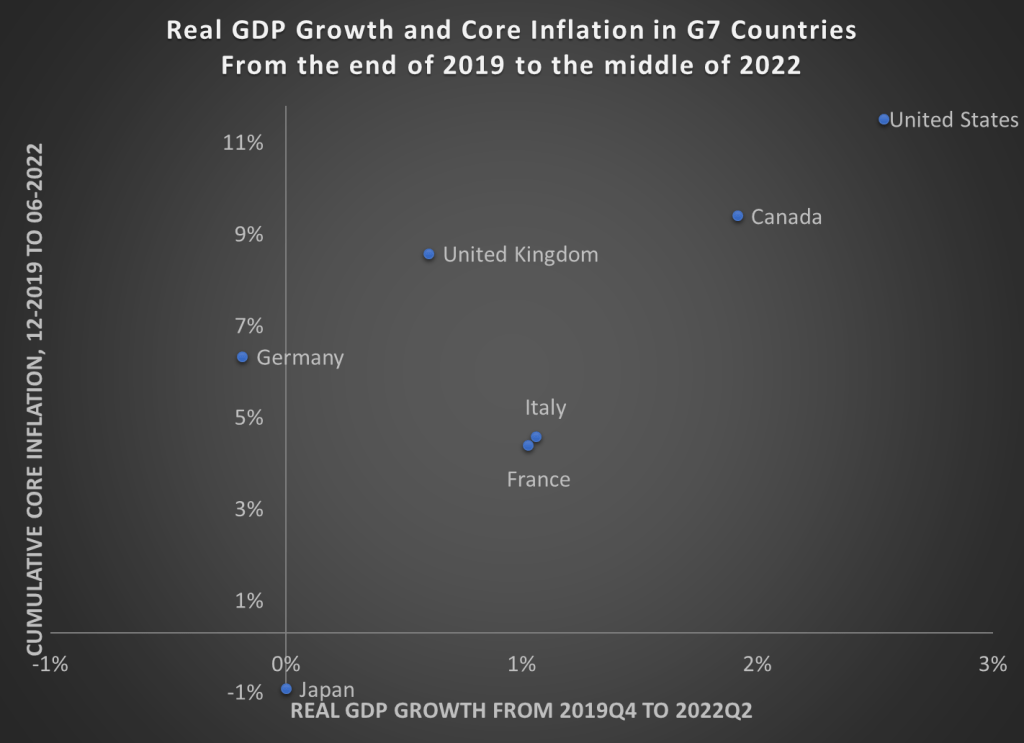
The picture looks roughly the same, but here are a few notable changes:
- Despite the slight slowdown in GDP growth in the first half of 2022, the US still clearly has the highest rate of economic growth
- UK, Italy, and Canada have now moved into positive territory for cumulative economic growth (yes, it’s all inflation adjusted)
- But Japan and Germany still have had no net economic growth during the pandemic — and even worse for Germany, they have had a healthy dose of inflation too
The US once again stands out as having both the best economic performance and the worst inflation performance in the G7. Are these two things connected? That’s a question that is unanswerable from a simple scatterplot, and may be unanswerable completely. But I think it’s fair to say that the US hasn’t taken an obviously inferior economic path relative to other countries, even if our path has been inferior compared to some ideal policy. But don’t commit the Nirvana Fallacy!
Finally, we should recognize that the GDP is not the only important measure of how an economic is performing. For example, the US labor market has not recovered as well as some other peer nations have. Still, GDP is one of the important broad measures to look at, even if it is not ideal for diagnosing recessions.
