Did 818,000 jobs vanish?

This morning the Bureau of Labor Statistics released the latest quarterly data for their Quarterly Census of Employment and Wages for the first quarter of 2024. Along with this release is the announcement of their preliminary “benchmark estimate” for March 2024, which will eventually (next year) be used to revise employment data for the Current Employment Statistics program. To keep all of the alphabet soup of programs clear in year head, CES is the more familiar “nonfarm jobs” data that is released each month, usually with some media fanfare.

Benchmarking is an important part of the process for many data releases, because the monthly CES data is based on a survey of employers, a subset of the total. But the QCEW data is the universe of employees — at least the universe of the those covered by Unemployment Insurance law, which is something like 97-98% of workers in the US. So the numbers will never match exactly (CES is supposed to be measuring all workers, not just the 97-98% covered by UI), but they should be pretty close. The media reports the CES monthly data more prominently, because it is more timely and usually pretty close to correct — but benchmarking is the process to see just how correct those initial surveys were.

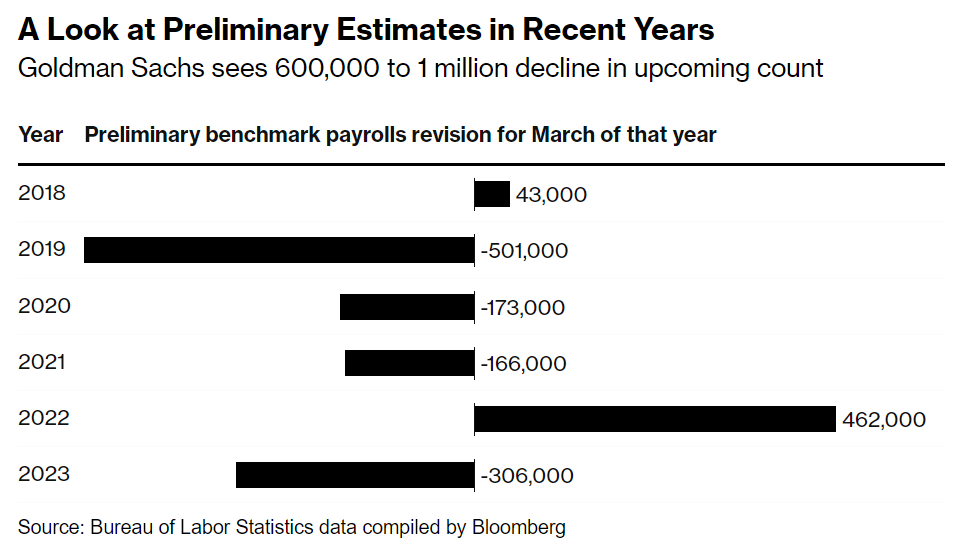
That brings us to the release today, which is the preliminary estimate of the benchmark adjustment for March 2024 (it will be finalized early in 2025). And that preliminary estimate was a big number, with a downward revision projected of 818,000 jobs. To put this in perspective, the current CES data shows 2.9 million jobs were added between March 2023 and March 2024, so this estimate suggest that the job growth was overstated by perhaps 40 percent. That’s a big revision, though large revisions are not unheard of: the same figure for March 2022 was an estimated 468,000 jobs higher, while March 2019 was 501,000 jobs lower. But this year is a big one (largest absolute number since 2009). Here’s a chart summarizing recent years revisions from Bloomberg:

I’ve covered this topic before, such as an April 2024 post where I noted that as of September 2023, there was an 880,000 gap in job growth between the CES and QCEW over the prior year. So this was not unexpected, and in the days leading up to the report, close followers of the data were forecasting that the revision could be up to 1 million jobs.

Continue reading

Services, and Goods, and Software (Oh My!)

When I was in high school I remember talking about video game consumption. Yes, an Xbox was more than two hundred dollars, but one could enjoy the next hour of that video game play at a cost of almost zero. Video games lowered the marginal cost and increased the marginal utility of what is measured as leisure. Similarly, the 20th century was the time of mass production. Labor-saving devices and a deluge of goods pervaded. Remember servants? That’s a pre-20th century technology. Domestic work in another person’s house was very popular in the 1800s. Less so as the 20th century progressed. Now we devices that save on both labor and physical resources. Software helps us surpass the historical limits of moving physical objects in the real world.


There’s something that I think about a lot and I’ve been thinking about it for 20 years. It’s simple and not comprehensive, but I still think that it makes sense.

  • Labor is highly regulated and costly.
  • Physical capital is less regulated than labor.
  • Software and writing more generally is less regulated than physical capital.


I think that just about anyone would agree with the above. Labor is regulated by health and safety standards, “human resource” concerns, legal compliance and preemption, environmental impact, and transportation infrastructure, etc. It’s expensive to employ someone, and it’s especially expensive to have them employ their physical labor.

Continue reading

On Average, American Wage Earners are Better Off Than They Were Four Years Ago

As I wrote last November, the question “are you better off than you were four years ago?” is a common benchmark for evaluating Presidential reelection prospects. And even though Biden is no longer running for reelection, voters will no doubt be considering the economic performance of his first term when thinking about their vote in November.

The good news for American wage earners (and possibly Harris’ election prospects) is that average wages have now outpaced average price inflation since January 2021. Despite some of that time period containing the worst price inflation in a generation, wages have continued to grow even as price growth has moderated. Key chart:

For most of Biden’s term, it was true that prices had outpaced wages. But no longer.

The real growth in wages, admittedly, is not very robust, despite being slightly positive. How does this compare to past performance under recent Presidents? Surprisingly, pretty well! (Lots of caveats here, but this is what the raw data shows.)

Recession Prospecting & Fed Tea Leaves

Will a recession happen? It’s famously hard/impossible to predict. Personally, I have a relatively monetarist take. I consider the goals of the Federal reserve, what tools they have, and how they make their decisions. I also think about the very recent trend in the macroeconomy and how it’s situated relative to history. Right now, the yield curve has been inverted for quite some time and the Sahm rule has been satisfied, both are historical indicators of recession.

Recessions are determined by the NBER’s Business Cycle Dating Committee. They always make their determination in hindsight and almost never in real time. They look at a variety of indicators and judge whether each declines, for how long, how deeply, and the breadth of decline across the economy. So plenty of ‘bad’ things can happen without triggering a recession designation.

In my expert opinion, recessions can largely be prevented by maintaining expected and steady growth in NGDP. This won’t solve real sectoral problems, but it will help to prevent contagion and spirals.  The Fed can control NGDP to a great degree. In doing so, they can affect unemployment and growth in the short run, and inflation in the medium to long run.

One drawback of the NGDP series is that it’s infrequent, published only quarterly. It’s hard to know whether a dip is momentary, a false signal that will later be updated, or whether there is a recession coming. So, what should one examine? One could examine leading indicators or the various high-frequency indicators of economic activity. But those are a little too much like tarot cards and fortune telling for my taste.

Continue reading

A Continually Updated Bernanke-Taylor Rule

Despite its many flaws*, I always like to check in on what the Taylor Rule suggests for the Fed. Its virtues are that it gives a definite precise answer, and that it has been agreed upon ahead of time by a variety of economists as giving a decent answer for what the Fed should do. Without something like the Taylor Rule, everyone tends to grasp for reasons that This Time Is Different. Academics seek novelty, so would rather come up with some new complex new theory of what to do instead of something undergrads have been taught for years. Finance types tend to push whatever would benefit them in the short term, which is typically rate cuts. Political types push whatever benefits their party; typically rate cuts if they are in power and hikes if not, though often those in power simply want to emphasize good economic news while those out of power emphasize the bad news.

The Taylor Rule can cut through all this by considering the same factors every time, regardless of whether it makes you look clever, helps your party, or helps your returns this quarter. So what is it saying now? It recommends a 6.05% Fed funds rate:

Fed Funds Rate Suggested by the Bernanke Version of the Taylor Rule
Source: My calculation using FRED data, continually updated here

I continue to use the Bernanke version of the Taylor Rule, which says that the Fed Funds rate should be equal to:

Core PCE + Output Gap + 0.5*(Core PCE – 2) +2

*What are the flaws of the Taylor Rule? It sees interest rates as the main instrument of monetary policy; it relies on the Output Gap, which can only really be guessed at; and it incorporates no measures of expectations. If I were coming up with my own rule I would probably replace the Output Gap with a labor market measure like unemployment, and add measures of money supply shifts and inflation expectations. Perhaps someday I will, but like everyone else I would naturally be tempted to overfit it to the concerns of the moment; I like that the Taylor Rule was developed at a time when Taylor had no idea what it might mean for, say, the 2024 election or the Q3 2024 returns of any particular hedge fund.

That said, people have now created enough different versions of the Taylor Rule that they can produce quite a range of answers, undermining one of its main virtues. The Atlanta Fed maintains a site that calculates 3 alternative versions of the rule, and makes it easy for you to create even more alternatives:

Two of their rules suggest that Fed Funds should currently be about 4%, implying a major cut at a time that the Bernanke version of the rule suggests a rate hike. On the other other hand, perhaps this variety is a virtue in that it accurately indicates that the current best path is not obvious; and the true signal comes in times like late 2021 when essentially every version of the rule is screaming that the Fed is way off target.

Taxes, Children, and the Zero Bracket

Recently there has been some discussion in the Presidential race about the taxation of parents vs. childless taxpayers. The discussion has been ongoing, but it was kicked up again when a 2021 video of J.D. Vance resurfaced where he said that taxpayers with children should be lower tax rates than those without children. There was some political back-and-forth about this idea, much of it tied up in the framing of the issue, with the usual bad faith on both sides about the fundamental issue (in short: most Democrats and a small but growing number of Republicans support increasing the size of the Child Tax Credit).

Let’s leave the politicking aside for a moment and focus on policy. As many pointed out in response to Vance’s idea, we already do this. In fact, we have almost always done this in the history of the US income tax — “this” meaning giving taxpayers at least some break for having kids. For most of the 20th century, this was done through personal exemptions which usually included some tax deduction for children, and later in the century the Child Tax Credit was added (after 2017, the exemptions were eliminated in favor of a large CTC). Other features of the tax code also make some accounting for the number of children, most notably the size of the Earned Income Credit.

The chart below is my attempt to show how the tax breaks for children have affected four sample taxpaying households. What I show here is sometimes called the “zero bracket” — that is, how much income you can earn without paying any federal income taxes. The four households are: a single person with no children, a married couple with no children, a single person with two children (“head of household”), and a married couple with two children. All dollar amounts are inflation-adjusted to current dollars

Continue reading

IPUMS Data Intensive Workshop & Conference

I just returned from the Full Count IPUMS data workshop at the Data-Intensive Research Conference that was hosted by the Network on Data Intensive Research on Aging and IPUMS. The theme of this conference was “Linking Records”.

It was the best workshop and conference that I’ve ever attended. I’d attended the conference remotely in the past. But attending the workshop was exceptional. Myself and about 20 other people were flown to the Minneapolis Population Center and put up in a hotel during our stay (that made the conference a low-stress affair). The whole workshop was well organized, the speakers built on one another’s content, and there was a hands-on lab for us to complete. I felt my human capital growing by the hour.  

Continue reading

Venezuelans Vote Overwhelmingly Against Maduro

Venezuela held an election this week; President Maduro says he won, while the opposition and independent observers say he lost. Disputed elections like this are fairly common across the world, but where Venezuela really stands out is not how people vote at the ballot box- it is how they vote with their feet.

Reuters notes that “A Maduro win could spur more migration from Venezuela, once the continent’s wealthiest country, which in recent years has seen a third of its population leave.”

I don’t think we emphasize enough how crazy the scale of this is. After every US Presidential election, you hear some people who supported the losing side talk about leaving the country, but they almost never do. Leaving your home country behind is a dramatic step, one people only want to take if they think things are much better elsewhere. The US, even with a party you don’t like in power, has generally stayed a good place to live. The total number of Americans who have moved abroad for any reason (I would guess most feel more pulled by the host country rather than pushed by the US) is about 3 million. That is less than 1% of all Americans; by contrast more than 46 million people have immigrated to the US from other countries, and many more would come if we allowed it.

Even in poor countries, seeing anything like one third of the population leave is dramatic, especially when almost all the migration happens in only 10 years as in Venezuela:

Source. Note this only goes through 2020, and emigration has grown since

This makes Venezuela the largest refugee crisis in the history of the Americas, and depending on how you count the partition of India, perhaps the largest refugee crisis in human history that was not triggered by an invasion or civil war.

Instead, it has been triggered by the Maduro regime choosing terrible policies that have needlessly and dramatically impoverished the country:

I hope that the Venezuelan government will soon come to represent the will of its people. I’m not sure how that is likely to happen, though I guess positive change is mostly likely to come from Venezuelans themselves (perhaps with help from Colombia and Brazil); when the US tries to play a bigger role we often make things worse. But what has happened in Venezuela for the past 10 years is clearly much worse than the “normal” bad economic policies and even democratic backsliding that we see elsewhere. People everywhere complain about election results and economic policy, but nowhere else have I seen such a case of people going past simple cheap talk, taking the very expensive step of voting against the regime with their feet.

Fiscal Illusion: It’s Real (People Underestimate How Much They Pay in Taxes)

The concept of “fiscal illusion” has long existed in public finance, but it is difficult to test. The basic theory is that people will underestimate how much they pay in taxes, as well as underestimate government expenditures. A forthcoming paper in Public Choice by Kaetana Numa uses survey data from the United Kingdom to test the theory, and finds support. From the abstract of “Fiscal illusion at the individual level“:

“providing personalized fiscal information reduces support for higher taxes and spending and increases support for lower taxes and spending. These findings indicate that taxpayers underestimate both their tax liabilities and the costs of public services.”

The paper uses a “novel personalized fiscal calculator” to estimate how much tax an individual would actually owe. It then randomizes which taxpayers get this information, and finds that “the treated respondents… were less supportive of raising taxes and more supportive of cutting taxes than the respondents in the control condition.”

And the results are large. For all taxes, in the treated group that saw their personalized fiscal calculator, 61 percent support cutting taxes, versus just 50 percent in the control group. The differences show up across the major taxes that individuals pay in the UK, including the income tax, national insurance contributions (both employer and employee sides), and the VAT. There is no tax category where the treatment group is more likely to want to increase the tax, though the VAT and the smaller Fuel duty and Council tax are about equal on the percent wanting an increase (but the median response for these last two is to decrease the tax — in both the control and treatment groups).

Do these results from the UK hold up in other developed nations? Possibly. In a 2014 Eurobarometer survey, the percent of EU citizens that could correctly identify their nation’s VAT rate varied widely. The high was 89 percent in Germany correctly identifying the rate, down to 31 percent in Ireland. The average was 65 percent — though the UK was at the low end with only about 47 percent correctly identifying the VAT rate.

Fiscal illusion appears to be a real issue, and probably an important one in the UK.

Sources on AI use of Information

  1. Consent in Crisis: The Rapid Decline of the AI Data Commons

Abstract: General-purpose artificial intelligence (AI) systems are built on massive swathes of public web data, assembled into corpora such as C4, Refined Web, and Dolma. To our knowledge, we conduct the first, large-scale, longitudinal audit of the consent protocols for the web domains underlying AI training corpora. Our audit of 14, 000 web domains provides an expansive view of crawlable web data and how consent preferences to use it are changing over time. We observe a proliferation of AI specific clauses to limit use, acute differences in restrictions on AI developers, as well as general inconsistencies between websites’ expressed intentions in their Terms of Service and their robots.txt. We diagnose these as symptoms of ineffective web protocols, not designed to cope with the widespread re-purposing of the internet for AI. Our longitudinal analyses show that in a single year (2023-2024) there has been a rapid crescendo of data restrictions from web sources, rendering ~5%+ of all tokens in C4, or 28%+ of the most actively maintained, critical sources in C4, fully restricted from use. For Terms of Service crawling restrictions, a full 45% of C4 is now restricted. If respected or enforced, these restrictions are rapidly biasing the diversity, freshness, and scaling laws for general-purpose AI systems. We hope to illustrate the emerging crisis in data consent, foreclosing much of the open web, not only for commercial AI, but non-commercial AI and academic purposes.

AI is taking out of a commons information that was provisioned under a different set of rules and technology. See discussion on Y Combinator 

2. “ChatGPT-maker braces for fight with New York Times and authors on ‘fair use’ of copyrighted works” (AP, January ’24)

3. Partly handy as a collection of references: “HOW GENERATIVE AI TURNS COPYRIGHT UPSIDE DOWN” by a law professor. “While courts are litigating many copyright issues involving generative AI, from who owns AI-generated works to the fair use of training to infringement by AI outputs, the most fundamental changes generative AI will bring to copyright law don’t fit in any of those categories…” 

4. New gated NBER paper by Josh Gans “examines this issue from an economics perspective”

Joy: AI companies have money. Could we be headed toward a world where OpenAI has some paid writers on staff? Replenishing the commons is relatively cheap if done strategically, in relation to the money being raised for AI companies. Jeff Bezos bought the Washington Post. It cost a fraction of his tech fortune (about $250 million). Elon Musk bought Twitter. Sam Altman is rich enough to help keep the NYT churning out articles. Because there are several competing commercial models, however, the owners of LLM products face a commons problem. If Altman pays the NYT to keep operating, then Anthropic gets the benefit, too. Arguably, good writing is already under-provisioned, even aside from LLMs.