Back in April I wrote about 4 different estimates of GDP growth and how well they have performed since 2023. With the 2nd quarter of 2025 GDP data coming out next week, what do the best performing predictors currently say?
In that last post, I showed that the Atlanta Fed GDPNow model and the Kalshi betting market were generally the best performers. And furthermore, averaging these two improves the predictive power a little more. As of today, the GDPNow model is predicting 2.4% growth and Kalshi is… also predicting 2.4%!
There will be a few more updates to GDPNow over the next week, and of course Kalshi is constantly updating as more people bet. But as of right now, 2.4% growth seems like a reasonable prediction. That may surprise some people, especially given all of the pessimism surrounding tariffs and policy uncertainty generally. But despite all of this, the US economy appears to be just continuing to chug along.
Iowa recently joined the growing list of states where midwives or obstetricians can open a freestanding birth center without needing to convince a state board that it is economically necessary. The Des Moines Register provides an excellent summary:
A Des Moines midwife who sued the state for permission to open a new birthing center may have lost a battle in court, but ultimately, she has won the war.
Caitlin Hainley of the Des Moines Midwife Collective sought to open a standalone birthing center in Des Moines, essentially a single-family home repurposed with birthing tubs and other equipment needed to give birth in a comfortable, home-like environment.
To do so, the collective alleged in its 2023 lawsuit, would have required going through a lengthy, expensive regulatory process that would give already established maternity facilities, such as local hospitals, the chance to argue against granting what is known as a certificate of need for the new facility, essentially vetoing competition.
A federal district judge ruled in November that Iowa’s certificate-of-need law is constitutional, finding that legislators had a rational interest in protecting existing hospitals and health care providers.
But while losing the first round in court, the collective’s cause was winning support in a more important venue: the Iowa Capitol. Iowa legislators in their 2025 session passed a bill, which Gov. Kim Reynolds signed on May 1, removing birth centers from the definition of health facilities covered by the certificate-of-need law. The law will formally take effect July 1.
I’m honored to have played a small part in this as the expert witness in the lawsuit.
If you’d like to get involved in making sure birth options are available your state, a great place to start would be to attend the Zoom seminar Roadmap For Reform: Advancing Birth Freedom on July 23rd. It is hosted by the Pacific Legal Foundation, which represented the midwives pro-bono in the Iowa case.
There is strong momentum here with Connecticut, Kentucky, Michigan, Vermont, and West Virginia also recently repealing Certificate of Need requirements for birth centers, but a variety of other barriers remain. States often require freestanding birth centers to obtain a transfer agreement with a nearby hospital before opening to ensure that the hospital will take their emergency cases, even though hospitals are legally required to take all emergency cases. The problem is that hospitals provide both complementary services (emergency care) and substitute services (labor and delivery), and they often choose not to sign transfer agreements in order to prevent competition from a partial substitute. This whole area would benefit both from more academic study, as well as more investigation from antitrust enforcement.
But for today, congratulations to Caitlin Hainley and to Iowa on their victory.
Here’s a somewhat niche measure of inflation: 6-month CPI excluding food, shelter, and energy. It might seem like a weird measure, as it excludes over half of the CPI. But there is a logic to at least considering it along with other measures.
Food and energy are both volatile, so they can give us a lot of noise. That’s why “core CPI” and other core measures are followed closely by the Fed and inflation watchers. But excluding shelter might also make sense, because increasing housing prices are largely due to supply constraints, and will move independently of monetary policy to some extent. Six-month inflation is also useful for a more timely measure than 12 months, the headline number.
As you can see in the chart above, this niche measure of inflation has been stuck for two and a half years. It has oscillated between about 0.5% and 1.5% since December 2022. And right now it’s almost exactly in the middle of that range. It has come down from 6 months ago, but higher than 1 year ago.
As you can see in the pre-2020 years, it generally oscillated between 0% and 1%. So 6-month inflation is stuck about 0.5% higher than we had become used to, which translates into roughly 1% higher annually.
In the grand scheme of things, 1% higher inflation isn’t the end of the world. But we do seem to be stuck at a slightly elevated rate of inflation relative to the decade before 2020.
I’m a big fan of Friedrich Hayek. I first read his work in an academic setting. But many people first encounter him via The Road to Serfdom, his book that outlines the political and social consequences of state economic controls. I always meant to go back and read it, but it usually took a back seat to other works. Now, I’m slowly making my way through.
A lovely snippet includes Hayek explaining the popular sentiment that “it’s only money” or that money-related concerns are base or superficial. Such an attitude is especially common when people recount their childhood or family life during times of financial difficulty. The story often goes “times were hard, but we had each other”. Similarly, a popularly derisive trope is that economists ‘only care about money’ [, rather than the more important things].
When every frontier AI model can pass your tests, how do you figure out which model is best? You write a harder test.
That was the idea behind Humanity’s Last Exam, an effort by Scale AI and the Center for AI Safety to develop a large database of PhD-level questions that the best AI models still get wrong.
The effort has proven popular- the paper summarizing it has already been cited 91 times since its release on March 31st, and the main AI labs have been testing their new models on the exam. xAI announced today that its new Grok 4 model has the highest score yet on the exam, 44.4%.
Current leaderboard on the Humanity’s Last Exam site, not yet showing Grok 4
The process of creating the dataset is a fascinating example of a distributed academic mega-project, something that is becoming a trend that has also been important in efforts to replicate previous research. The organizers of Humanity’s Last Exam let anyone submit a question for their dataset, offering co-authorship to anyone whose question they accepted, and cash prizes to those who had the best questions accepted. In the end they wound up with just over 1000 coauthors on the paper (including yours truly as one very minor contributor), and gave out $500,000 to contributors of the very best questions (not me), which seemed incredibly generous until Scale AI sold a 49% stake in their company to Meta for $14.8 billion in June.
Here’s what I learned in the process of trying to stump the AIs and get questions accepted into this dataset:
The AIs were harder than I expected to stump because they used frontier models rather than the free-tier models I was used to using on my own. If you think AI can’t answer your question, try a newer model
It was common for me to try a question that several models would get wrong, but at least one would still get right. For me this was annoying because questions could only be accepted if every model got them wrong. But of course if you want to get a correct answer, this means trying more models is good, even if they are all in the same tier. If you can’t tell what a correct answer looks like and your question is important, make sure to try several models and see if they give different answers
Top models are now quite good at interpreting regression results, even when you try to give them unusually tricky tables
AI still has weird weaknesses and blind spots; it can outperform PhDs in the relevant field on one question, then do worse than 3rd graders on the next. This exam specifically wanted PhD-level questions, where a typical undergrad not only couldn’t answer the question, but probably couldn’t even understand what was being asked. But it specifically excluded “simple trick questions”, “straightforward calculation/computation questions”, and questions “easily answerable by everyday people”, even if all the AIs got them wrong. My son had the idea to ask them to calculate hyperfactorials; we found some relatively low numbers that stumped all the AI models, but the human judges ruled that our question was too simple to count. On a question I did get accepted, I included an explanation for the human judges of why I thought it wasn’t too simple.
I found this to be a great opportunity to observe the strengths and weaknesses of frontier models, and to get my name on an important paper. While the AI field is being driven primarily by the people with the chops to code frontier models, economists still have lot we can contribute here, as Joy has shown. Any economist looking for the next way to contribute here should check out Anthropic’s new Economic Futures Program.
The 23 blue-shaded MSAs in this map produce half of US GDP:
You might be tempted to think this map, like so many maps, is just a map of US population. It kind of is, but not completely. These 23 MSAs have 133 million people (as of the 2020 Census), or about 40% of the US population. That’s a lot, but it’s much less than half, which the GDP proportion they account for. In other words, these MSAs also tend to have above-average per capita income.
The three largest MSAs by population (NY, LA, Chicago) are also the three largest by GDP. But after the first three there are some interesting discrepancies. The San Francisco MSA is the 4th largest by GDP, but only the 12th largest by population — San Fran has a population similar to the Phoenix MSA, but almost double the GDP. San Francisco MSA has a very high GDP per capita (the third highest).
The San Jose MSA is also among these 23 largest MSAs for GDP, and also sticks out — it is the 13th largest by total GDP, but only the 36th largest by population. San Jose has a population similar to Cleveland and Nashville, but well over double the GDP of these two MSAs individually. In fact, there are 12 MSAs larger in population than San Jose, but that aren’t among these 23 MSAs that produce half of US GDP: places like St. Louis, Orlando, San Antonio, Pittsburgh, and Columbus. Silicon Valley really pulls up San Jose: it has the 2nd largest GDP per capita among MSAs, only beaten by much smaller Midland, Texas and its oil income.
A bit over 40% of current U.S. farm workers are illegal immigrants. In some regions and sectors, the percentage is much higher. The work is often uncomfortable and dangerous, and far from the cool urban centers. This is work that very few U.S. born workers would consider doing, unless the pay was very high, so it would be difficult to replace the immigrant labor on farms in the near term. I don’t know how much the need for manpower would change if cheap illegal workers were not available, and therefore productivity was supplemented with automation.
It apparently didn’t occur to some members of the administration that deporting a lot of these workers (and frightening the rest into hiding) would have a crippling effect on American agriculture. Sure enough, there have recently been reports in some areas of workers not showing up and crops going unharvested.
It is difficult for me as a non-expert to determine how severe and widespread the problems actually are so far. Anti-Trump sources naturally emphasize the genuine problems that do exist and predict apocalyptic melt-down, whereas other sources are more measured. I suspect that the largest agribusinesses have kept better abreast of the law, while smaller operations have cut legal corners and may have that catch up to them. For instance, a small meat packer in Omaha reported operating at only 30% capacity after ICE raids, whereas the CEO of giant Tyson Foods claimed that “every one who works at Tyson Foods is authorized to do so,” and that the company “is in complete compliance” with all the immigration regulations.
With at least some of these wholly predictable problems from mass deportations now becoming reality, the administration is undergoing internal debates and policy adjustments in response. On June 12, President Trump very candidly acknowledged the issue, writing on Truth Social, “Our great Farmers and people in the hotel and leisure business have been stating that our very aggressive policy on immigration is taking very good, long-time workers away from them, with those jobs being almost impossible to replace…. We must protect our Farmers, but get the CRIMINALS OUT OF THE USA. Changes are coming!”
The next day, ICE official Tatum King wrote regional leaders to halt investigations of the agricultural industry, along with hotels and restaurants. That directive was apparently walked back a few days later, under pressure from outraged conservative supporters and from Deputy White House Chief of Staff Stephen Miller. Miller, an immigration hard-liner, wants to double the ICE deportation quota, up to 3,000 per day.
This issue could go in various ways from here. Hard-liners on the left and on the right have a way of pushing their agendas to unpalatable extremes. It can be argued that the Democrats could easily have won in 2024 had their policies been more moderate. Similarly, if immigration hard-liners get their way now, I predict that the result will be their worst nightmare: a public revulsion against enforcing immigration laws in general. If farmers and restaurateurs start going bust, and food shortages and price spikes appear in the supermarket, public support for the administration and its project of deporting illegal immigrants will reverse in a big way. Some right-wing pundits would not be bothered by an electoral debacle, since their style is to stay constantly outraged, and (as the liberal news outlets currently demonstrate), it is easier to project non-stop outrage when your party is out of power.
An optimist, however, might see in this controversy an opening for some sort of long-term, rational solution to the farm worker issue. Agricultural Secretary Brooke Rollins has proposed expansion of the H-2A visa program, which allows for temporary agricultural worker residency to fill labor shortages. This is somewhat similar to the European guest worker programs, though with significant differences. H-2A requires the farmer to provide housing and take legal responsibility for his or her workers. H-2B visas allow for temporary non-agricultural workers, without as much employer responsibility. A bill was introduced into Congress with bi-partisan support to modernize the H-2A program, so that legislative effort may have legs. Maybe there can be a (gasp!) compromise.
President Trump last week came out strongly in favor of this sort of solution, with a surprisingly positive take on the (illegal) workers who have worked diligently on a farm for years. By “put you in charge” he is seems to refer to the responsibilities that H-2A employers undertake for their employers, and perhaps extending that to H-2B employers. He acknowledges that the far-right will not be happy, but hopes “they’ll understand.” From Newsweek:
“We’re working on legislation right now where – farmers, look, they know better. They work with them for years. You had cases where…people have worked for a farm, on a farm for 14, 15 years and they get thrown out pretty viciously and we can’t do it. We gotta work with the farmers, and people that have hotels and leisure properties too,” he said at the Iowa State Fairgrounds in Des Moines on Thursday.
“We’re gonna work with them and we’re gonna work very strong and smart, and we’re gonna put you in charge. We’re gonna make you responsible and I think that that’s going to make a lot of people happy. Now, serious radical right people, who I also happen to like a lot, they may not be quite as happy but they’ll understand. Won’t they? Do you think so?”
A black swan is a crisis that comes out of nowhere. A gray rhino, by contrast, is a problem we have known about for a long time, but can’t or won’t stop, that will at some point crash into a full-blown crisis.
The US national debt is a classic gray rhino. The problem has slowly been getting worse for 25 years, but the crisis still seems far enough off that almost no one wants to incur real costs today to solve the problem. During the 2007-2009 financial crisis and the 2020-2021 Covid pandemic we had good reasons to run deficits. But we’ve ignored the Keynesian solution of paying back the deficits incurred in bad times with surpluses in good times.
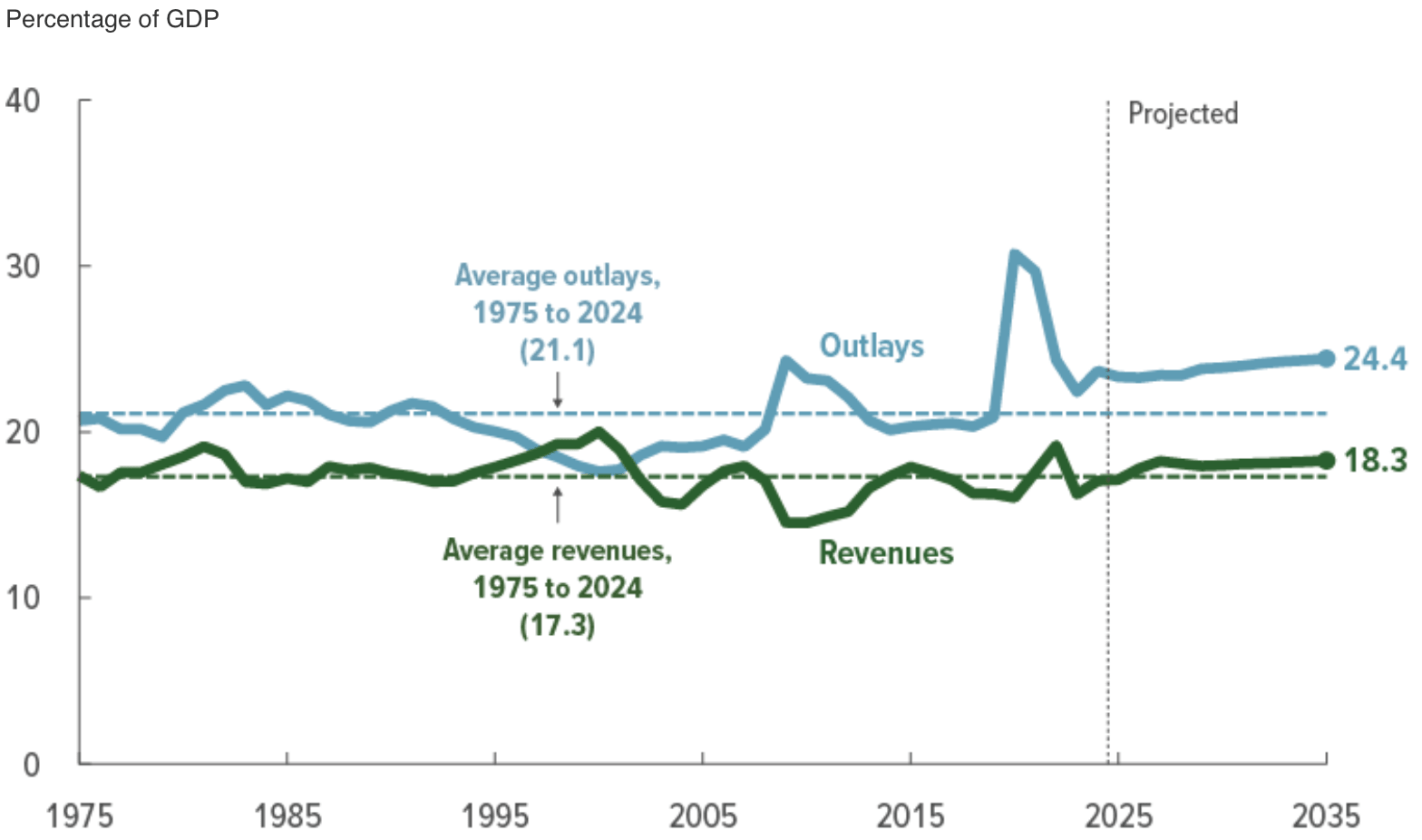
We are currently in reasonably good economic times, but about to pass a mega-spending bill that blows the deficit up from its already-too-high-levels. At a time when we should be running a surplus, we are instead running a deficit around 6% of GDP:
Source: Congressional Budget Office
Our ‘primary deficit’ is lower, a more manageable 3% of GDP. But if interest rates go higher, either for structural reasons or because of a loss of confidence in the US government’s willingness to pay its debts, the total deficit could spiral higher rapidly. The CBO optimistically assumed that the interest rate on 10-year treasuries will fall below 4% in the 2030s, from 4.3% today:
Source: Congressional Budget Office
But their scoring of H.R. 1 (“One Big Beautiful Bill Act”) shows it adding $3 trillion to the debt over the next 10 years, increasing the deficit by ~1% of GDP per year.
I already suspected this gray rhino would eventually cause a crisis, but this bill and the milieu that produced turn it into a near guarantee- nothing stops the deficit train until we hit a full blown crisis. That crisis is no longer just a long-term issue for your kids and grandkids to worry about- you will see it in 7 years or so. Unfortunately, that is still far enough away that current politicians have no incentive to take costly steps to avoid it. In fact, deficits will probably make the economy stronger for a year or two before they start making things worse- convenient for all the Congresspeople up for election in less than 2 years.
Here are the ways I see this playing out, from most to least likely:
By around 2032, either the slowly aging population or a sudden spike in interest rates forces the government to touch at least one of the third rails of American politics: cut Social Security, cut Medicare, or substantially raise taxes on the middle class (explicitly or through inflation).
We get bailed out again by God’s Special Providence for fools, drunks, and the United States of America. AI brings productivity miracles bigger than those of computers and the internet, letting GDP grow faster than our debts.
We default on the national debt (but this is a risky option because we will still want to run big deficits, and lenders will only lend if they expect to get paid back).
We do all the smart policy reforms that economists recommend in time to head off the crisis and stop the rhino. Medical spending falls without important services being cut thanks to supply-side reforms or cheap miracle drugs (GLP-1s going off patent?).
I’m hoping of course for numbers 2 and 4, but after this bill I’m expecting the rhino.
In 2023, we gathered the data for what became “ChatGPT Hallucinates Nonexistent Citations: Evidence from Economics.” Since then, LLM use has increased. A 2025 survey from Elon University estimates that half of Americans now use LLMs. In the Spring of 2025, we used the same prompts, based on the JEL categories, to obtain a comprehensive set of responses from LLMs about topics in economics.
What did we find? Would you expect the models to have improved since 2023? LLMs have gotten better and are passing ever more of what used to be considered difficult tests. (Remember the Turing Test? Anyone?) ChatGPT can pass the bar exam for new lawyers. And yet, if you ask ChatGPT to write a document in the capacity of a lawyer, it will keep making the mistake of hallucinating fake references. Hence, we keep seeing headlines like, “A Utah lawyer was punished for filing a brief with ‘fake precedent’ made up by artificial intelligence”
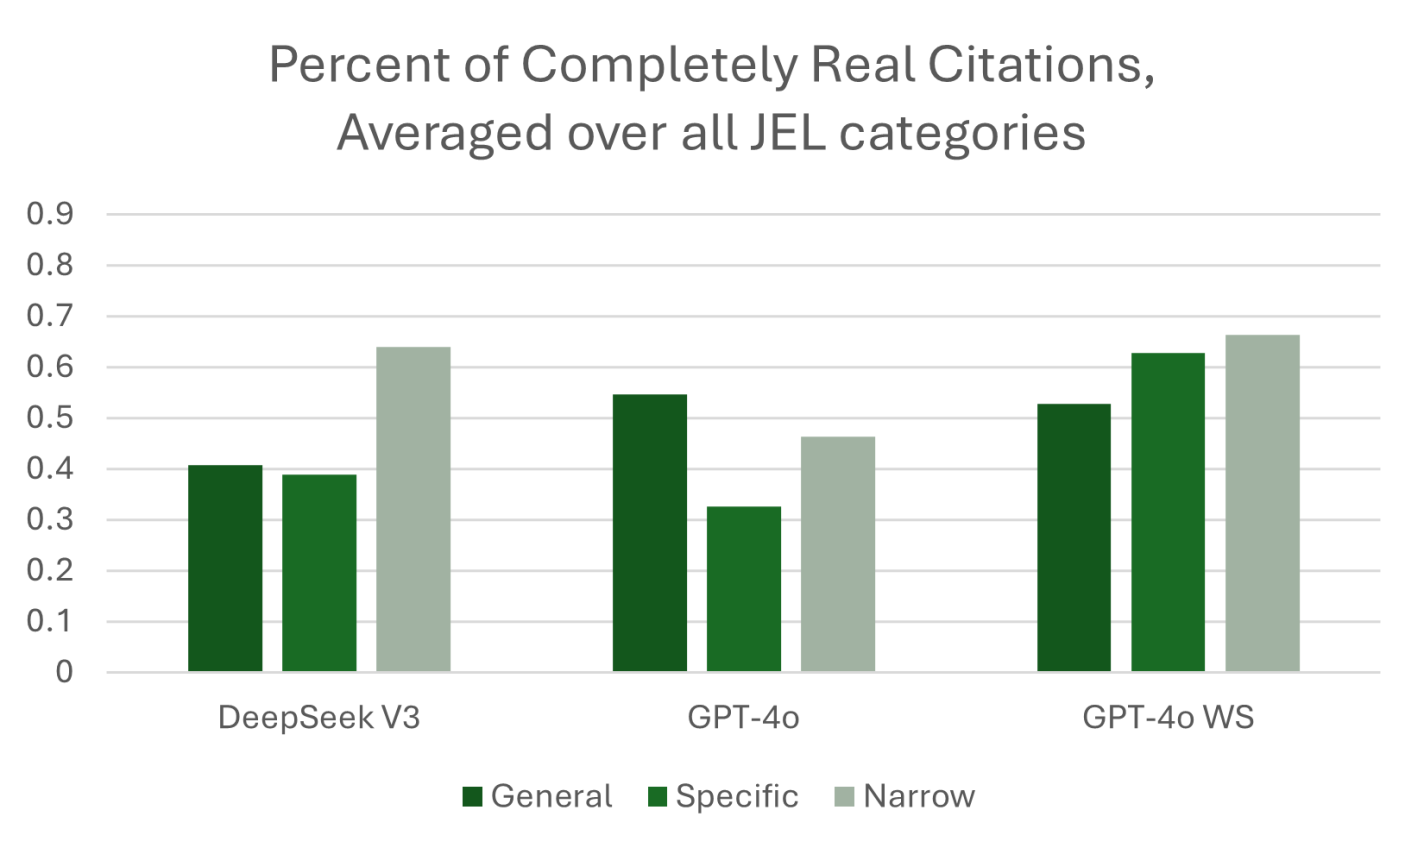
What we call GPT-4o WS (Web Search) in the figure below was queried in April 2025. This “web-enabled” language model is enhanced with real-time internet access, allowing it to retrieve up-to-date information rather than relying solely on static training data. This means it can answer questions about current events, verify facts, and provide live data—something traditional models, which are limited to their last training cutoff, cannot do. While standard models generate responses based on patterns learned from past data, web-enabled models can supplement that with fresh, sourced content from the web, improving accuracy for time-sensitive or niche topics.
At least one third of the references provided by GPT-4o WS were not real! Performance has not significantly improved to the point where AI can write our papers with properly incorporated attribution of ideas. We also found that the web-enabled model would pull from lower quality sources like Investopedia even when we explicitly stated in the prompt, “include citations from published papers. Provide the citations in a separate list, with author, year in parentheses, and journal for each citation.” Even some of the sources that were not journal articles were cited incorrectly. We provide specific examples in our paper.
The best they had was a 60 percent success rate. If I have my baby, and I give her a robot butler that has a 60 percent accuracy rate at holding things, including the baby, I’m not buying the butler.
In macroeconomics we have basic tools to help us talk about economic growth, which is simply the percent change in RGDP per capita. What causes growth? Lot’s of things. All else constant, if more people are employed, then more will be produced. But the productivity of those workers matters too. That’s why we calculate average labor productivity (ALP), which is the GDP per worker. This tells us how much each worker produces. All else constant, more ALP means more GDP.*
What affects ALP? Nearly everything: Technology, demographics, health, culture, and public policy. Most of these have long-term effects. So, it’s better to think in terms of regimes. After all, incurring debt now can result in a lot of investment and production, but there’s no guarantee that it can be sustained year after year. This is why I don’t get terribly excited about individual good or bad policies at any moment. There’s a lot of ruin in a nation. I care more about the long-run policy regime that is fostered over time.
Given the variety of inputs to economic growth, there’s always plenty of room for complaint about policy – even if the economy is doing well. In this post, I’m inspired by a Youtube video that a student shared with me. The OP laments poor policy in Massachusetts. But compared to some other nearby states, MA is doing just fine economically. This is not the same as saying that the OP is wrong about poor policies. Rather, a regime of policy, technology, interests, etc. is built over time and there can be a lot wrong in growing economies.
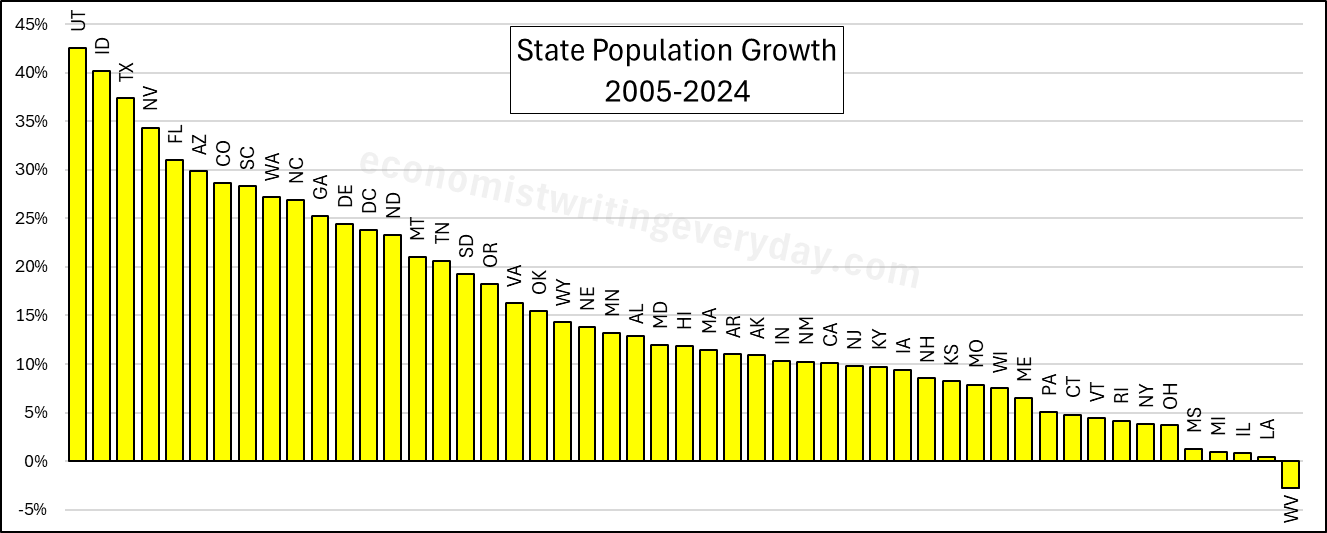
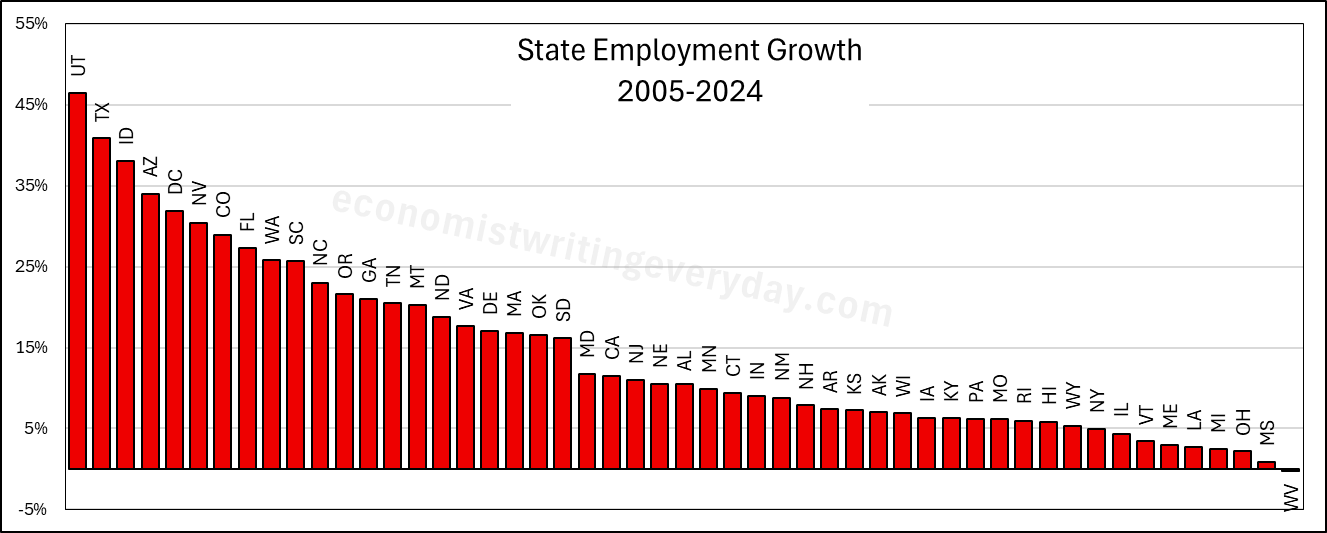
In the interest of being comprehensive, this post includes basic growth stats for all states from 2005 through 2024 (the years of FRED-state GDP).** First, let’s start with the basic building blocks of population, employment, and RGDP. Institutions matter. Policy affects whether people migrate to/from the state, fertility, how many people are employed, and what they can produce.
People like to talk about migration and the flocking to Texas & Florida. But that fails to catch the people who choose to stay in their state. Utah is 43% more populous than it was 20 years ago. But you don’t hear much clamoring for their state policies. Idaho and Nevada also beat Florida in terms of percent change. Where are the calls to be like Idaho? Employment largely tracks population, though not perfectly. The RGDP numbers can change quickly with commodity prices, reflected in the performance of North Dakota. But remember, these numbers cover a 20 year span. So, any one blockbuster or dower year won’t move the rankings much.
Of course, these figures just set the stage. What about the employment-population ratio, ALP, and RGDP per capita? Read on.