For my birthday this year, someone gave me a “smart” plug-in power socket. You plug it into the wall, and then can plug in something, say a lamp, into the smart socket, which you can then control via the internet. Yay, I am now a part of the Internet of Things (IoT). What could possibly go wrong?
However, my Spidey-sense started to tingle, and I chose to give this device away. At that point, I was thinking mainly of the potential for such devices to get hacked and then recruited to be part of a vast bot-net which can then (under the control of bad actors) conduct massive attacks on crucial internet components. For instance,
Mirai [way back in 2016] infected IoT devices from routers to video cameras and video recorders by successfully attempting to log in using a table of 61 common hard-coded default usernames and passwords.
The malware created a vast botnet. It “enslaved” a string of 400,000 connected devices. In September 2016, Mirai-infected devices (who became “zombies”) were used to launch the world’s first 1Tbps Distributed Denial-of-Service (DDoS) attack on servers at the heart of internet services. It took down parts of Amazon Web Services and its clients, including GitHub, Netflix, Twitter, and Airbnb.
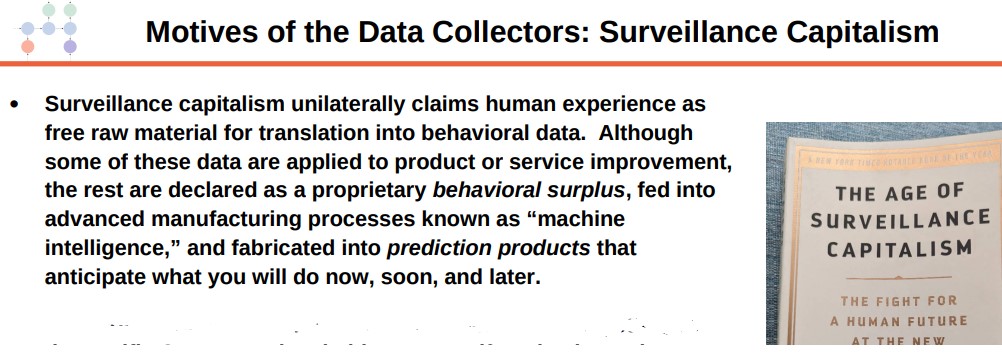
But it turns out the hazards with smart devices are widespread indeed. IoT devices are so useful for bad guys that that they are attacked more than either mobile devices or computers. One layer of hazard is the hacking of specific, poorly-secured devices in a home or institution, with subsequent control of devices and infiltration of broader computing systems. This will be the focus of today’s blog post. Another layer of hazard is the use to which masses of (sometimes private and personal) data snooped from “unhacked” smart devices are put by large corporations and state actors; that will be considered in a part 2 post.
Here are results from one study from nearly three years ago:
A study published in July 2020 analyzed over 5 million IoT, IoMT (Internet of Medical Things), and unmanaged connected devices in healthcare, retail, manufacturing, and life sciences. It reveals an astonishing number of vulnerabilities and risks across a stunningly diverse set of connected objects….
The report brings to light disturbing facts and trends:
Up to 15% of devices were unknown or unauthorized.
5 to 19% were using unsupported legacy operating systems.
49% of IT teams were guessing or had tinkered with their existing IT solutions to get visibility.
51% of them were unaware of what types of smart objects were active in their network.
75% of deployments had VLAN violations
86% of healthcare deployments included more than ten FDA-recalled devices.
95% of healthcare networks integrated Amazon Alexa and Echo devices alongside hospital surveillance equipment.
…Ransomware gangs specifically target healthcare more than any other domain in the United States. It’s now, by far, the #1 healthcare breach root cause in the country. …The mix of old legacy systems and connected devices like patient monitors, ventilators, infusion pumps, lights, and thermostats with very poor security features are sometimes especially prone to attacks.
So, these criminals understand that stopping critical applications and holding patient data can put lives at risk and that these organizations are more likely to pay a ransom.
I know people in organizations which have been brought to their knees by ransomware attacks. And I have read of the dilemma of the guy who was on vacation in the Caribbean or whatever, and got a text from a hacker instructing him to deposit several hundred dollars in a Bitcoin account, or else his “smart” refrigerator/freezer would be turned off and he would come home to a spoiled, moldy mess.
What brought all this IoT stuff to my attention this week was a talk I ran across from retired MIT researcher Timothy Wallace, titled “Effects, Side Effects and Risks of the Internet of Things”, presented at the 2023 American Scientific Affiliation meeting. The slides for his talk are here. I will paste in a few snipped excerpts from his talk, that are fairly self-explanatory:
(My comment: 10 billion is a really, really big number…)
(My comment: this type of catastrophic compromise of computer systems being enabled by hacking some piddling little IoT device that happens to be in the home or institution local network is not uncommon. Which is why I am reluctant to put IoT devices, especially from no-name foreign manufacturers, on my home wireless network).
Many of these vulnerabilities could in theory be addressed by better practices like always resetting factory passwords on your smart devices, but it is easy for forget to do that.
And just to end on a light note (this cartoon also lifted from Wallace’s slides):
Are smartphones bad for kids? Cal walks through the data on this question, including how researchers came to be worried, their findings, critiques of their findings, and where we are today. He then gives recommendations for how to think about technology when it comes to your kids.
In May of 2023, Cal Newport shared well-informed opinions about whether smartphones harm young people. In the first half of the podcast, he talks about depression and loneliness data.
Minute 30 of the podcast: Screentime harms teenagers because they inhibit the development of critical thinking skills. Deep critical thinking skills require training. Reading an analog book is better than screens (see my review of Tyler’s AI generative book and poastmodernism).
See my summary of Emily Oster on video games for kids. She does not clutch her pearls over violent video games. However, she is concerned about what activities get crowded out by screentime. She is especially worried about sleep, because on that topic the data are clear.
Minute 31, Call Newport: Tweens and teens scroll on their phones for too long instead of going to sleep. A 13-year-old boy with a smart phone will “be up until 4 in the morning.” A tween told him that middle school girls arrive at school too exhausted to function because they have been on their phones all night.
FYI, if you are the parent in an Apple device network, you can set time limits on the devices in your family. I filed this report about smart watches last year, incidentally in the same week as the release of Newport’s podcast episode.
One mom told me that Apple Watch is considerably more durable than a Gizmo (I wouldn't know from experience). And, my son described "Watch Jail" where his teacher keeps smart watches overnight if there are usage infractions during the school day.
I’ve discussed the ways to teach supply and demand in the past. Regardless, almost all principles of economics classes require a book. But even digital books are often just intangible versions of the hard copy. Supply and demand are illustrated as static pictures, using arrows and labels to do the leg-work of introducing exogenous changes. There’s often a text block with further explanation, but it lacks the kind of multi-sensory explanation that one gets while in a class.
In a class, the instructor can gesticulate and vary their speech explain the model, all while drawing a graph. That’s fundamentally different from reading a book. Studying a book requires the student to repeatedly glance between the words and the graph and to identify the appropriate part of the graph that is relevant to the explanation. For new or confused students, connected the words to one of many parts of a graph is the point of failure.
This is part of why the Marginal Revolution University videos do well. They’re well produced, with context and audio-overlaid video of graphs. It’s pretty close to the in-person experience sans the ability to ask questions, but includes the additional ability to rewind, repeat, adjust the speed, display captions, and share.
Venture-capital backed startups almost all cluster in the same handful of industries, mostly various types of software. This leaves a variety of large and economically important sectors with almost no venture-capital backed startups. That means those industries see fewer new companies and new ideas; they must rely on either growth from existing firms, which are unlikely to embrace disruptive innovation, or on startups that bootstrap and/or finance with debt, which tend to grow slowly.
Venture capital firm Fifty Years has done a nice job cataloging exactly which industries see the most, and least, investment relative to their size. Here is their picture of the US economy by industry market size:
Now their picture of which industries get the investment (though unfortunately, they aren’t very clear about their data source for it):
They use this to create an “Opportunity Ratio”- current market size divided by current startup funding:
They call the industries with the largest Opportunity Ratios the “Top Underfunded Opportunities”:
I don’t necessarily agree; some industries face shrinking demand, prohibitive regulation, or other fundamental issues making them bad candidates for investment. Conversely, investors haven’t just focused on software randomly or through imitation; they see that it is where the growth is.
Still, herding by investors is real, and I always like the strategy of finding a new game instead of trying to win at the most competitive games, so I do think there is something to the idea of investing in an unsexy industry like paper. Growing up in Maine and watching one paper mill after another close, I always wondered how they managed to lose money in a state that is 90% trees, and whether anyone could find a way to reverse the trend. Perhaps related technology like mass timber or biochar will be the way to take advantage of cheap lumber.
Thanks again to Fifty Years for releasing the data.
There is a new generative AI product called Phind. Does it make up fake citations like ChatGPT? I will report experimentation with the free-tier product from January 7, 2023.
Phind is an intelligent search engine and assistant for programmers.
Prompt: “In less than 10 sentences, explain how the ideas of Hayek are connected to bailing out failed banks, and include citations from published papers as a list. include author, year in parentheses, and journal for the citations.”
Friedrich Hayek, a prominent Austrian economist, advocated for a free market system where businesses and individuals make decisions based on individual knowledge and self-interest, rather than central planning by government or bureaucrats. His ideas suggest that interventions, such as bailing out failed banks, should be minimal and temporary, allowing the market to correct itself.
However, the financial crisis of 2008, including the failure of many banks, led to significant government intervention, including the bailout of banks. This action can be seen as a departure from Hayek’s principles, as it involves direct government intervention to stabilize the financial system.
According to a paper by Todd Zywicki (2009), the Federal Reserve’s artificial lowering of short-term interest rates and the resulting shift by consumers to adjustable rate mortgages (ARMs) triggered the housing bubble and subsequent crisis [Source 1](https://reason.org/wp-content/uploads/files/federal_reserve_monetary_policy_hayek_rule.pdf). This aligns with Hayek’s critique of central banking’s manipulation of interest rates.
Moreover, the Basel Accords, international capital adequacy and liquidity requirements for banks, were designed to encourage banks to hold securitized loans in their portfolios, thereby concentrating risk and leveraging up, thereby increasing their exposure to risk. This approach, contrary to Hayek’s preference for decentralization and competition, may have contributed to the financial crisis [Source 1](https://reason.org/wp-content/uploads/files/federal_reserve_monetary_policy_hayek_rule.pdf). In conclusion, while Hayek’s ideas of minimal government intervention and self-regulating markets provide a useful theoretical framework, practical implementation in complex and interconnected modern economies may require different strategies, including bank bailouts.
Are the citations real and correct? Phind simply is not trying to write with in-text citations and academic references. There is a mention of “Todd Zywicki (2009)” and also a weblink. The weblink is to a policy paper published by Reason. This policy paper is on the correct topic and the paper does exist. The Zywicki citations also exists, in the sense that if you go into the Reason paper it cites a real Wall Street Journal op-ed. So, if you follow the trail, you can see what document Phind learned to cite Zywicki from. It seems like it is stealing the citation more than reading the source documents. To be fair, sometimes human academics work that way, too.
What I was hoping for was in-text citations with a compiled bibliography at the end. Phind did not give me that.
I’ll try another test that I ran on ChatGPT and Bing in 2023.
The prompt is “In what paper did John Duffy propose that economists use experiments to study equilibrium selection?”
Phind does not attempt an in-text citation in the response. The link in the paragraph (link number 2) points to John Duffy’s list of papers, which is better than just making up fake citations but also does not create a literature review for me. Phind is, as with the Hayek test above, providing breadcrumbs of links through which I can discover existent papers.
Is there a paper called “The Transition from Stagnation to Growth: An Adaptive Learning Approach”? Yes. And it is by Duffy.
Phind lists weblinks to sources. Has Phind done more for me than Google, on this search? Not much, in terms of finding and synthesizing references.
Information on the internet was born free, but now lives everywhere in walled gardens. Blogging sometimes feels like a throwback to an earlier era. So many newer platforms have eclipsed blogs in popularity, almost all of which are harder to search and discover. Facebook was walled off from the beginning, Twitter is becoming more so. Podcasts and video tend to be open in theory, but hard to search as most lack transcripts. Longer-form writing is increasingly hidden behind paywalls on news sites and Substack. People have complained for years that Google search is getting worse; there are many reasons for this, like a complacent company culture and the cat-and-mouse game with SEO companies, but one is this rising tide of content that is harder to search and link.
To me part of the value of blogging is precisely that it remains open in an increasingly closed world. Its influence relative to the rest of the internet has waned since its heydey in ~2009, but most of this is due to how the rest of the internet has grown explosively at the expense of the real world; in absolute terms the influence of blogging remains high, and perhaps rising.
The closing internet of late 2023 will not last forever. Like so much else, AI is transforming it, for better and worse. AI is making it cheap and easy to produce transcripts of podcasts and videos, making them more searchable. Because AI needs large amounts of text to train models, text becomes more valuable. Open blogs become more influential because they become part of the training data for AI; because of what we have written here, AI will think and sound a little bit more like us. I think this is great, but others have the opposite reaction. The New York Times is suing to exclude their data from training AIs, and to delete any models trained with it. Twitter is becoming more closed partly in an attempt to limit scraping by AIs.
So AI leads to human material being easier for search engines to index, and some harder; it also means there will be a flood of AI-produced material, mostly low-quality, clogging up search results. The perpetual challenge of search engines putting relevant, high-quality results first will become much harder, a challenge which AI will of course be set to solve. Search engines already have surprisingly big problems with not indexing writing at all; searching for a post on my old blog with exact quotes and not finding it made me realize Google was missing some posts there, and Bing and DuckDuckGo were missing all of them. While we’re waiting for AI to solve and/or worsen this problem, Gwern has a great page of tips on searching for hard-to-find documents and information, both the kind that is buried deep down in Google and the kind that is not there at all.
I have a paper that emphasizes ChatGPT errors. It is important to recognize that LLMs can make mistakes. However, someone could look at our data and emphasize the opposite potential interpretation. On many points, and even when coming up with citations, the LLM generated correct sentences. More than half of the content was good.
Apparently, LLMs just solved an unsolvable math problem. Is there anything they can’t do? Considering how much of human expression and culture revolves around religion, we can expect AI’s to get involved in that aspect of life.
Alex thinks it will be a short hop from Personal Jesus Chatbot to a whole new AI religion. We’ll see. People have had “LLMs” in the form of human pastors, shaman, or rabbis for a long time, and yet sticking to one sacred text for reference has been stable. I think people might feel the same way in the AI era – stick to the canon for a common point of reference. Text written before the AI era will be considered special for a long time, I predict. Even AI’s ought to be suspicious of AI-generated content, just in the way that humans are now (or are they?).
Many religious traditions have lots of training literature. (In our ChatGPT errors paper, we expect LLMs to produce reliable content on topics for which there is plentiful training literature.)
I gave ChatGPT this prompt:
Can you write a Bible study? I’d like this to be appropriate for the season of Advent, but I’d like most of the Bible readings to be from the book of Job. I’d like to consider what Job was going through, because he was trying to understand the human condition and our relationship to God before the idea of Jesus. Job had a conception of the goodness of God, but he didn’t have the hope of the Gospel. Can you work with that?
The Differences-in-Differences literature has blown up in the past several years. “Differences-in-Differences” refers to a statistical method that can be used to identify causal relationships (DID hereafter). If you’re interested in using the new methods in Stata, or just interested in what the big deal is, then this post is for you.
First, there’s the basic regression model where we have variables for time, treatment, and a variable that is the product of both. It looks like this:
The idea is that that there is that we can estimate the effect of time passing separately from the effect of the treatment. That allows us to ‘take out’ the effect of time’s passage and focus only on the effect of some treatment. Below is a common way of representing what’s going on in matrix form where the estimated y, yhat, is in each cell.
Each quadrant includes the estimated value for people who exist in each category. For the moment, let’s assume a one-time wave of treatment intervention that is applied to a subsample. That means that there is no one who is treated in the initial period. If the treatment was assigned randomly, then β=0 and we can simply use the differences between the two groups at time=1. But even if β≠0, then that difference between the treated and untreated groups at time=1 includes both the estimated effect of the treatment intervention and the effect of having already been treated prior to the intervention. In order to find the effect of the intervention, we need to take the 2nd difference. δ is the effect of the intervention. That’s what we want to know. We have δ and can start enacting policy and prescribing behavioral changes.
Easy Peasy Lemon Squeezy. Except… What if the treatment timing is different and those different treatment cohorts have different treatment effects (heterogeneous effects)?* What if the treatment effects change over time the longer an individual is treated (dynamic effects)**? Further, what if the there are non-parallel pre-existing time trends between the treated and untreated groups (non-parallel trends)?*** Are there design changes that allow us to estimate effects even if there are different time trends?**** There’re more problems, but these are enough for more than one blog post.
For the moment, I’ll focus on just the problem of non-parallel time trends.
What if untreated and the to-be-treated had different pre-treatment trends? Then, using the above design, the estimated δ doesn’t just measure the effect of the treatment intervention, it also detects the effect of the different time trend. In other words, if the treated group outcomes were already on a non-parallel trajectory with the untreated group, then it’s possible that the estimated δ is not at all the causal effect of the treatment, and that it’s partially or entirely detecting the different pre-existing trajectory.
Below are 3 figures. The first two show the causal interpretation of δ in which β=0 and β≠0. The 3rd illustrates how our estimated value of δ fails to be causal if there are non-parallel time trends between the treated and untreated groups. For ease, I’ve made β=0 in the 3rd graph (though it need not be – the graph is just messier). Note that the trends are not parallel and that the true δ differs from the estimated delta. Also important is that the direction of the bias is unknown without knowing the time trend for the treated group. It’s possible for the estimated δ to be positive or negative or zero, regardless of the true delta. This makes knowing the time trends really important.
STATA Implementation
If you’re worried about the problems that I mention above the short answer is that you want to install csdid2. This is the updated version of csdid & drdid. These allow us to address the first 3 asterisked threats to research design that I noted above (and more!). You can install these by running the below code:
program fra syntax anything, [all replace force] local from "https://friosavila.github.io/stpackages" tokenize `anything' if "`1'`2'"=="" net from `from' else if !inlist("`1'","describe", "install", "get") { display as error "`1' invalid subcommand" } else { net `1' `2', `all' `replace' from(`from') } qui:net from http://www.stata.com/ end fra install fra, replace fra install csdid2 ssc install coefplot
Once you have the methods installed, let’s examine an example by using the below code for a data set. The particulars of what we’re measuring aren’t important. I just want to get you started with the an application of the method.
local mixtape https://raw.githubusercontent.com/Mixtape-Sessions use `mixtape'/Advanced-DID/main/Exercises/Data/ehec_data.dta, clear qui sum year, meanonly replace yexp2 = cond(mi(yexp2), r(max) + 1, yexp2)
The csdid2 command is nice. You can use it to create an event study where stfips is the individual identifier, year is the time variable, and yexp2 denotes the times of treatment (the treatment cohorts).
The above output shows us many things, but I’ll address only a few of them. It shows us how treated individuals differ from not-yet treated individuals relative to the time just before the initial treatment. In the above table, we can see that the pre-treatment average effect is not statistically different from zero. We fail to reject the hypothesis that the treatment group pre-treatment average was identical to the not-yet treated average at the same time period. Hurrah! That’s good evidence for a significant effect of our treatment intervention. But… Those 8 preceding periods are all negative. That’s a little concerning. We can test the joint significance of those periods:
estat event, revent(-8/-1)
Uh oh. That small p-value means that the level of the 8 pretreatment periods significantly deviate from zero. Further, if you squint just a little, the coefficients appear to have a positive slope such that the post-treatment values would have been positive even without the treatment if the trend had continued. So, what now?
Wouldn’t it be cool if we knew the alternative scenario in which the treated individuals had not been treated? That’s the standard against which we’d test the observed post-treatment effects. Alas, we can’t see what didn’t happen. BUT, asserting some premises makes the job easier. Let’s say that the pre-treatment trend, whatever it is, would have continued had the treatment not been applied. That’s where the honestdid stata package comes in. Here’s the installation code:
local github https://raw.githubusercontent.com net install honestdid, from(`github'/mcaceresb/stata-honestdid/main) replace honestdid _plugin_check
What does this package do? It does exactly what we need. It assumes that the pre-treatment trend of the prior 8 periods continues, and then tests whether one or more post-treatment coefficients deviate from that trend. Further, as a matter of robustness, the trend that acts as the standard for comparison is allowed to deviate from the pre-treatment trend by a multiple, M, of the maximum pretreatment deviations from trend. If that’s kind of wonky – just imagine a cone that continues from the pre-treatment trend that plots the null hypotheses. Larger M’s imply larger cones. Let’s test to see whether the time-zero effect significantly differs from zero.
What does the above table tell us? It gives us several values of M and the confidence interval for the difference between the coefficient and the trend at the 95% level of confidence. The first CI is the original time-0 coefficient. When M is zero, then the null assumes the same linear trend as during the pretreatment. Again, M is the ratio by which maximum deviations from the trend during the pretreatment are used as the null hypothesis during the post-treatment period. So, above, we can see that the initial treatment effect deviates from the linear pretreatment trend. However, if our standard is the maximum deviation from trend that existed prior to the treatment, then we find that the alpha is just barely greater than 0.05 (because the CI just barely includes zero).
That’s the process. Of course, robustness checks are necessary and there are plenty of margins for kicking the tires. One can vary the pre-treatment periods which determine the pre-trend, which post-treatment coefficient(s) to test, and the value of M that should be the standard for inference. The creators of the honestdid seem to like the standard of identifying the minimum M at which the coefficient fails to be significant. I suspect that further updates to the program will come along that spits that specific number out by default.
I’ve left a lot out of the DID discussion and why it’s such a big deal. But I wanted to share some of what I’ve learned recently with an easy-to-implement example. Do you have questions, comments, or suggestions? Please let me know in the comments below.
The above code and description is heavily based on the original author’s support documentation and my own Statalist post. You can read more at the above links and the below references.
*Sun, Liyang, and Sarah Abraham. 2021. “Estimating Dynamic Treatment Effects in Event Studies with Heterogeneous Treatment Effects.” Journal of Econometrics, Themed Issue: Treatment Effect 1, 225 (2): 175–99. https://doi.org/10.1016/j.jeconom.2020.09.006.
**Sant’Anna, Pedro H. C., and Jun Zhao. 2020. “Doubly Robust Difference-in-Differences Estimators.” Journal of Econometrics 219 (1): 101–22. https://doi.org/10.1016/j.jeconom.2020.06.003.
***Callaway, Brantly, and Pedro H. C. Santa Anna. 2021. “Difference-in-Differences with Multiple Time Periods.” Journal of Econometrics, Themed Issue: Treatment Effect 1, 225 (2): 200–230. https://doi.org/10.1016/j.jeconom.2020.12.001.
****Rambachan, Ashesh, and Jonathan Roth. 2023. “A More Credible Approach to Parallel Trends.” The Review of Economic Studies 90 (5): 2555–91. https://doi.org/10.1093/restud/rdad018.
I’ve taught GT a total of 5 time. Below are my average student course evaluations for “I would recommend this class to others” and “I would consider this instructor excellent”. Although the general trend has been improvement, improving ratings and the course along the way, some more context would be helpful. In 2019, my expectations for math were too high. Shame on me. It was also my first time teaching GT, so I had a shaky start. In 2020, I smoothed out a lot of the wrinkles, but I hadn’t yet made it a great class.
In 2021, I had a stellar crop of students. There was not a single student who failed to learn. The class dynamic was perfect and I administered the course even more smoothly. They were comfortable with one another, and we applied the ideas openly. In 2022, things went south. There were too many students enrolled in the section, too many students who weren’t prepared for the course, and too many students who skated by without learning the content. Finally, in 2023, the year of my changes, I had a small class with a nice symmetrical set of student abilities.
Historically, I would often advertise this class, but after the disappointing 2022 performance, and given that I knew that I would be making changes, I didn’t advertise for the 2023 section. That part worked out perfectly. Clearly, there is a lot of random stuff that happens that I can’t control. But, my job is to get students to learn, help the capable students to excel, and to not make students *too* miserable in the process – no matter who is sitting in front of me.
We study whether people will pay for a fact-check on AI writing. ChatGPT can be very useful, but human readers should not trust every fact that it reports. Yesterday’s post was about ChatGPT writing false things that look real.
The reason participants in our experiment might pay for a fact-check is that they earn bonus payments based on whether they correctly identify errors in a paragraph. If participants believe that the paragraph does not contain any errors, they should not pay for a fact-check. However, if they have doubts, it is rational to pay for a fact-check and earn a smaller bonus, for certain.
Abstract: We explore whether people trust the accuracy of statements produced by large language models (LLMs) versus those written by humans. While LLMs have showcased impressive capabilities in generating text, concerns have been raised regarding the potential for misinformation, bias, or false responses. In this experiment, participants rate the accuracy of statements under different information conditions. Participants who are not explicitly informed of authorship tend to trust statements they believe are human-written more than those attributed to ChatGPT. However, when informed about authorship, participants show equal skepticism towards both human and AI writers. There is an increase in the rate of costly fact-checking by participants who are explicitly informed. These outcomes suggest that trust in AI-generated content is context-dependent.
Our original hypothesis was that people would be more trusting of human writers. That turned out to be only partially true. Participants who are not explicitly informed of authorship tend to trust statements they believe are human-written more than those attributed to ChatGPT.
We presented information to participants in different ways. Sometimes we explicitly told them about authorship (informed treatment) and sometimes we asked them to guess about authorship (uninformed treatment).
This graph (figure 5 in our paper) shows that the overall rate of fact-checking increased when subjects were given more explicit information. Something about being told that a paragraph was written by a human might have aroused suspicion in our participants. (The kids today would say it is “sus.”) They became less confident in their own ability to rate accuracy and therefore more willing to pay for a fact-check. This effect is independent of whether participants trust humans more than AI.
We are thinking of fact-checking as often a good thing, in the context of our previous work on ChatGPT hallucinations. So, one policy implication is that certain types of labels can cause readers to think critically. For example, Twitter labels automated accounts so that readers know when content has been chosen or created by a bot.
Suggested Citation: Buchanan, Joy and Hickman, William, Do People Trust Humans More Than ChatGPT? (November 16, 2023). GMU Working Paper in Economics No. 23-38, Available at SSRN: https://ssrn.com/abstract=4635674