Jared Diamond is a polymath (biochemistry, physiology, ornithology, ecology; MacArthur Genius Grant; etc.) perhaps best known for his Guns, Germs and Steel (1997). In that book (which I read) he proposed that shared learnings and practices across the vast Eurasian continent led to optimized food crops and agricultural practices for Eurasian peoples, which in turn led to dense, stratified societies where technical development could progress. This included Chinese and other Asian societies, not just Europeans. This enabled large military forces equipped with formidable weapons, that could dominate non-Eurasian peoples when they came in contact. The rest is history.
In another popular book (which I also read), Collapse: How Societies Choose to Fail or Succeed (2005), Diamond presented explanations for the collapse or (relative) failure of a number of modern and historical societies. These included the Norse settlers in Greenland, the Maya of Central America, and Easter Island.
Easter Island, known as Rapa Nui by its natives, is the most isolated inhabited landmass on Earth. It lies some 2200 miles west of Chile and 1200 miles east of Pitcairn Island (think: mutiny on the Bounty). The first European contacts were brief visits by various ships in the early 1700’s. At that point, there appeared to be several thousand inhabitants, and no large trees. It seems that Polynesian settlers arrived on the island around 1200 A.D., though perhaps as early as 800. The pollen record and carbon-14 dating showed that large palm trees were present on the island, but disappeared around 1650.
Easter Island is perhaps best known for its many large (20-30 ft high) stone carvings called moai:
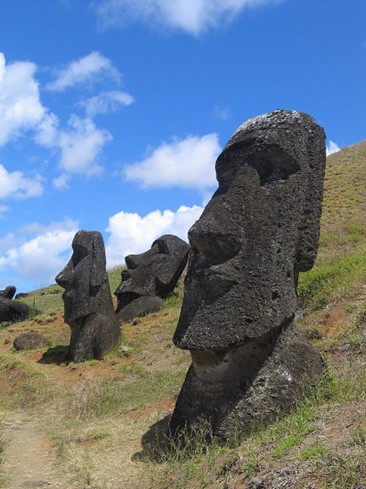
Image: Wikipedia
Scholars have supposed that a large, hierarchical society was needed to produce the some 1000 moai observed on Easter Island. These statues were later deliberately toppled, for reasons unknown.
Following the suggestions of some early anthropologists, Diamond spun a riveting apocalyptic tale of overpopulation and stupidity: supposedly the population grew to some 15,000 souls, mindlessly chopping down all the trees to transport and erect the huge stone carvings. This deforestation, together with exhaustion of nutrients in the soil, led to a downward spiral in the welfare of the community: no trees = soil erosion and water runoff and no edible nuts; no wood= no boats = few fish. Shifts in trade winds or climate were also implicated. Tribal warfare, class struggle and cannibalism erupted, with mass deaths through violence and starvation, all before the Europeans showed up. The account of internecine conflict was supported by the natives’ oral traditions. This whole story arc was taken to be a parable for our times: if you mess with your ecosystem, society may not stand the strain.
Perhaps jealous of upstart Jared Diamond’s success, some fifteen authors from the professional anthropology guild ganged up and published an attack volume titled Questioning Collapse in 2009. They disputed many of Diamond’s assertions, including his Easter Island collapse scenario.
Results from the past several years have swung the consensus firmly against the ecocide collapse theory. For instance, a carbon-14 dating study of bone and wood artifacts by DiNapoli, et al. indicated a steady growth in population up until European contact in the early 1700s. The same conclusion was reached in a recent study by J. Víctor Moreno-Mayar et al., using DNA measurement from native genomes dating between 1670 and 1950. Also, it seems from mariners’ reports that toppling of the statues did not begin until after European contact. The loss of the trees is now attributed mainly to the Polynesian rats brought with the natives; the rats eat the palm seeds.
What actually did the natives in was a series of raids by Peruvian slave-traders in 1862. They abducted about half of the 3000 inhabitants, including the leaders and cultural carriers. After a public outcry o\in 1865 by the bishop of Tahiti, the embarrassed Peruvian government repatriated the surviving slaves, but they carried back a smallpox infection which killed off most of the rest. “1868 saw the entire social order of Easter Island collapse, there were no more standing Moai statues… In 1877, only 110 impoverished and disheartened inhabitants remained.” Ouch. So, the social order did collapse, but not from climate change or ecological stupidity.
In 1888, Chile took over Easter Island as a protectorate, shielding the inhabitants from further slaver attacks. That began a fitful recovery for the Rapa Nui people, who as of 2017 numbered 3,512. This is roughly the population prior to European contact.


