What Are the Effects of TCJA? It’s A Little Hard to Say

The Tax Cuts and Jobs Act was passed in late 2017 and went into effect in 2018. For academic research to analyze the effects, that’s still a very recent change, which can make analyzing the effects challenging. In this case the challenge is especially important because major portions of the Act will expire at the end of next year, and there will be a major political debate about renewing portions of it in 2025.

Despite these challenges, a recent Journal of Economic Perspectives article does an excellent job of summarizing what we know about the effects so far. In “Sweeping Changes and an Uncertain Legacy: The Tax Cuts and Jobs Act of 2017,” the authors Gale, Hoopes, and Pomerleau first point out some of the obvious effects:

  1. TCJA increased budget deficits (i.e., it did not “pay for itself”)
  2. Most Americans got a tax cut (around 80%), which explains #1 — and only about 5% of Americans saw a tax increase (~15% weren’t affected either way)
  3. Following from #2, every quintile of income saw their after-tax income increase, though the benefits were heavily skewed towards the top of the distribution ($1,600 average increase, but $7,600 for the top quintile, and almost $200,000 for the top 0.1%)

Beyond these headline effects, it seems that most of the other effects were modest or difficult to estimate — especially given the economic disruptions of 2020 related to the pandemic.

For example, what about business investment? Through both lowering tax rates for corporations and changing some rules about deductions of expenses, we might have expected a boom in business investment (it was also stated goal of some proponents of the law). Many studies have tried to examine the potential impact, and the authors group these studies into three buckets: macro-simulations, comparisons of aggregate data, and using micro-data across industries (to better get at causation).

In general, the authors of this paper don’t find much convincing evidence that there was a boom in business investment. The investment share of GDP didn’t grow much compared to before the law, and other countries saw more growth in investment as a share of GDP. Could that be because GDP is larger, even though the share of investment hasn’t grown? Probably not, as GDP in the US is perhaps 1 percent larger than without the law — that’s not nothing, but it’s not a huge boom (and that’s not 1 percent per year higher growth, it’s just 1 percent).

Ultimately though, it is hard to say what the correct counterfactual would be for business investment, even with synthetic control analyses (the authors discuss a few synthetic control studies on pages 21-22, but they aren’t convinced).

What’s important about some of the main effects is that these were largely predictable, at least by economists. The authors point to a 2017 Clark Center poll of leading economists. Almost no economists thought GDP would be “substantially higher” from the tax changes, and economists were extremely certain that it would increase the level of federal debt (no one disagreed and only a few were uncertain).

The Dietary Salt Wars

For many years, it has been stated as settled science that Americans need to cut back their sodium intake from the current averages of about 3400 mg/day to less than  2400 mg sodium (about 1 teaspoon of table salt). The 2400 mg figure is endorsed by the National Academies, as described in the 164-page (we’re from the government and we’re here to help) booklet Dietary Guidelines for Americans published by USDA and HHS. The reason given is that supposedly there is a roughly linear relationship between salt intake and blood pressure, with higher blood pressure correlating to heart disease. The World Health Organization (WHO) recommends less than 2000 mg.

The dietary salt boat has been rocked in the past several years by studies claiming that cutting sodium below about 3400 mg does not help with heart disease (except for patients who already incline toward hypertension), and that cutting it much below 2400 mg is actually harmful.

The medical establishment has come out swinging to attack these newer studies. A 2018 article (Salt and heart disease: a second round of “bad science”? ) in the premier British medical journal The Lancet acknowledged this controversy:

2 years ago, Andrew Mente and colleagues, after studying more than 130000 people from 49 different countries, concluded that salt restriction reduced the risk of heart disease, stroke, or death only in patients who had high blood pressure, and that salt restriction could be harmful if salt intake became too low. The reaction of the scientific community was swift. “Disbelief” was voiced that “such bad science” should be published by The Lancet.  The American Heart Association (AHA) refuted the findings of the study, stating that they were not valid, despite the AHA for many years endorsing products that contain markedly more salt than it recommends as being “heart healthy”.

This article went on to note that, “with an average lifespan of 87·3 years, women in Hong Kong top life expectancy worldwide despite consuming on average 8–9 g of salt per day, more than twice the amount recommended by the AHA recommendation. A cursory look at 24 h urinary sodium excretion in 2010 and the 2012 UN healthy life expectancy at birth in 182 countries, ignoring potential confounders, such as gross domestic product, does not seem to indicate that salt intake, except possibly when very high, curtails lifespan.”

A more recent (2020) article by salt libertarians, Salt and cardiovascular disease: insufficient evidence to recommend low sodium intake, stated in its introduction:

In 2013, an independent review of the evidence by the National Academy of Medicine (NAM) concluded there to be insufficient evidence to support a recommendation of low sodium intake for cardiovascular prevention. However, in 2019, a re-constituted panel provided a strong recommendation for low sodium intake, despite the absence of any new evidence to support low sodium intake for cardiovascular prevention, and substantially more data, e.g. on 100 000 people from Prospective Urban Rural Epidemiology (PURE) study and 300 000 people from the UK-Biobank study, suggesting that the range of sodium intake between 2.3 and 4.6 g/day is more likely to be optimal.

… In this review, we examine whether the recommendation for low sodium intake, reached by current guideline panels, is supported by robust evidence. Our review provides a counterpoint to the current recommendation for low sodium intake. We suggest that a specific low sodium intake target (e.g. <2.3 g/day) for individuals may be unfeasible, have uncertain consequences for other dietary factors, and have unproven effectiveness in reducing cardiovascular disease. We contend that current evidence, despite methodological limitations, suggests that most of the world’s population consume a moderate range of dietary sodium (1–2 teaspoons of salt) that is not associated with increased cardiovascular risk, and that the risk of cardiovascular disease increases when sodium intakes exceed 5 g/day.

The keepers of orthodoxy fired back the following year in an article with an ugly title Sodium and Health: Old Myths and a Controversy Based on Denial  and making ugly accusations:

Some researchers have propagated a myth that reducing sodium does not consistently reduce CVD but rather that lower sodium might increase the risk of CVD. These claims are not well-founded and support some food and beverage industry’s vested interests in the use of excessive amounts of salt to preserve food, enhance taste, and increase thirst. Nevertheless, some researchers, often with funding from the food industry, continue to publish such claims without addressing the numerous objections.

Ouch.

I don’t have the expertise to dig down and make a ruling on who is right here. But I do feel better about eating my tasty salty chips, knowing I have at least some scholarly support for my habit.

Sept 2026 update: Dr. Mark Hyman, FWIW, weighs on on the side of low salt is likely not helpful: https://drhyman.com/blogs/content/downside-low-salt-diet

It won’t be liberals that kill the Cybertruck

The rise of large pickup trucks and SUVs in the US is generally tied to the implicit subsidy borne of their exemption from Corporate Average Fuel Economy (CAFE) standards. The seemingly ever-growing scale of these vehicles has produced a perfect example of negative externalities in the form of increased risk to other drivers, cyclists, and pedestrians (yes, a pedestrian is in danger from any vehicle, but the decreased maneuverability from greater carriage remains relevant).

This particular negative externality is not wholly uninternalized by large truck drivers, however. They pay higher premiums to the insurance companies that must cover the payouts to negligent and catastrophic loss of life when their customers are found at fault in collisions. Without the internalizing of these externalities through civil cases, trucks would likely be even larger and more dangerous.

Which brings me to the Cybertruck. I don’t care for it as a vehicle for a variety of reasons, but I similarly don’t care for Lamborghinis. My tastes are irrelevant. What is relevant is that it is made out of 30-times cold-rolled steel, a design choice I believe reflects its ambition to appeal as a sort of post-apocalyptic survivor’s vehicle that can literally physically dominate other vehicles.

This is likely to be a very, very expensive choice.

It will probably take a while for the insurance market to internalize the externality, but as the number of Cybertrucks on the street increase, so will the number of collisions and, in turn, fatalities. Fatal accidents are high variance, high cost events that loom large in the vision of insurers. The actuaries will crunch the numbers and premiums will increase. And not just because of short term increases in fatalities. Insurance companies are in the forecasting business as well. If they anticipate that courts may respond to a vehicle whose makeup makes it a disproportionate threat to others on the road by tilting the scales of fault towards their drivers, then its entirely possible that there remains no feasible premium that remains profitable. There’s a reason Jackie Chan can’t get life insurance.

What happens when a $90k, 6,800 pound steel battering ram requires that it’s drivers be self-insured? What happens in states that don’t allow drivers to self-insure? Even if there remains a small number of companies that offer “exotic” vehicle insurance, the premiums will turn push prospective ownership further up the demand curve, turning the Cybertruck into the kind of road oddity you see every few years. I have seen a Lotus Exos exactly once.

It won’t be liberals that kill the Cybertruck. Hell, if they manage to repeal the CAFE exemption it’ll be the single biggest boost a giant EV truck could hope for. No, it’s going to be the market that kills the Cybertruck.

Writing with ChatGPT Buchanan Seminar on YouTube

I was pleased to be a (virtual) guest speaker for Plateau State University in Nigeria. My host was (Emergent Ventures winner) Nnaemeka Emmanuel Nnadi. The talk is up on Youtube with the following timestamp breakdown:

During the first ten minutes of the video, Ashen Ruth Musa gives an overview called “The Bace People: Location, Culture, Tourist Attraction.”

Then I introduce LLMs and my topic.

Minute 19:00 – 29:00 is a presentation of the paper “ChatGPT Hallucinates Nonexistent Citations: Evidence from Economics“

Minute 23:30 – 34 is summary of my paper “Do People Trust Humans More Than ChatGPT?”

Continue reading →

Florida Ballot Initiatives 2024

The November election in Florida will include 6 proposed amendments to the Florida State Constitution. They only pass if at least 60% of voters vote YES. Here are some brief takes from an economic perspective.

Amendment 1: Partisan Election of Members of District School Boards

Currently, school district boards are locally elected and they do not have a party affiliation listed on the ballot. If passed, the amendment would permit party affiliation to be on the ballot. Partisan primaries would also be introduced, reducing the number of candidates in the general elections. The argument in favor is that party affiliation itself communicates information to voters. Removing that information forces voters to abstain, vote randomly, or to vote based on other information.

An argument against is that, in Florida, only registered party members may vote in primaries. If passed, parties will endorse particular candidates according to the primary results, winnowing the field. I happen to live in a county with an overwhelming republican majority, so the party-endorsed candidate will probably win. The outcome will be that the median republican primary-voter will choose the winning candidate in the primary rather than the median voter during the election. Voting “YES” aggregates information from a smaller set of voters.

I’ll vote NO.

Continue reading →

Forecasting Swing States with Economic Data

Ray Fair at Yale runs one of the oldest models to use economic data to predict US election results. It predicts vote shares for President and the US House as a function of real GDP growth during the election year, inflation over the incumbent president’s term, and the number of quarters with rapid real GDP growth (over 3.2%) during the president’s term.

Currently his model predicts a 49.28 Democratic share of the two-party vote for President, and a 47.26 Democratic share for the House. This will change once Q3 GDP results are released on October 30th, probably with a slight bump for the dems since Q3 GDP growth is predicted to be 2.5%, but these should be close to the final prediction. Will it be correct?

Probably not; it has been directionally wrong several times, most recently over-estimating Trump’s vote share by 3.4% in 2020. But is there a better economic model? Perhaps we should consider other economic variables (Nate Silver had a good piece on this back in 2011), or weight these variables differently. Its hard to say given the small sample of US national elections we have to work with and the potential for over-fitting models.

But one obvious improvement to me is to change what we are trying to estimate. Presidential elections in the US aren’t determined by the national vote share, but by the electoral college. Why not model the vote share in swing states instead?

Doing this well would make for a good political science or economics paper. I’m not going to do a full workup just for a blog post, but I will note that the Bureau of Economic Analysis just released the last state GDP numbers that they will prior to the election:

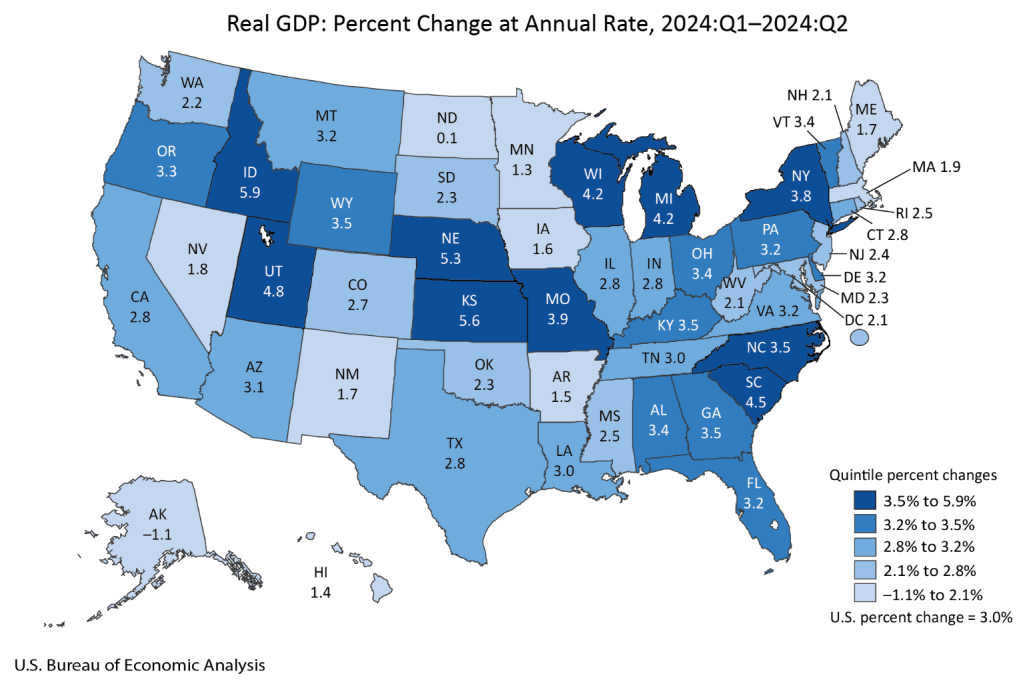
Mostly this strikes me as a good map for Harris, with every swing state except Nevada seeing GDP growth above the national average of 3.0%. Of course, this is just the most recent quarter; older data matters too. Here’s real GDP growth over the past year (not per capita, since that is harder to get, though it likely matters more):

RegionReal GDP Growth Q2 2023 – Q2 2024
US3.0%
Arizona2.6%
Georgia3.5%
Michigan2.0%
Nevada3.4%
North Carolina4.4%
Pennsylvania2.5%
Wisconsin3.3%

Still a better map for Harris, though closer this time, with 4 of 7 swing states showing growth above the national average. I say this assuming as Fair does that the candidate from the incumbent President’s party is the one that will get the credit/blame for economic conditions. But for states I think it is an open question to what extent people assign credit/blame to the incumbent Governor’s party as opposed to the President. Georgia and Nevada currently have Republican governors.

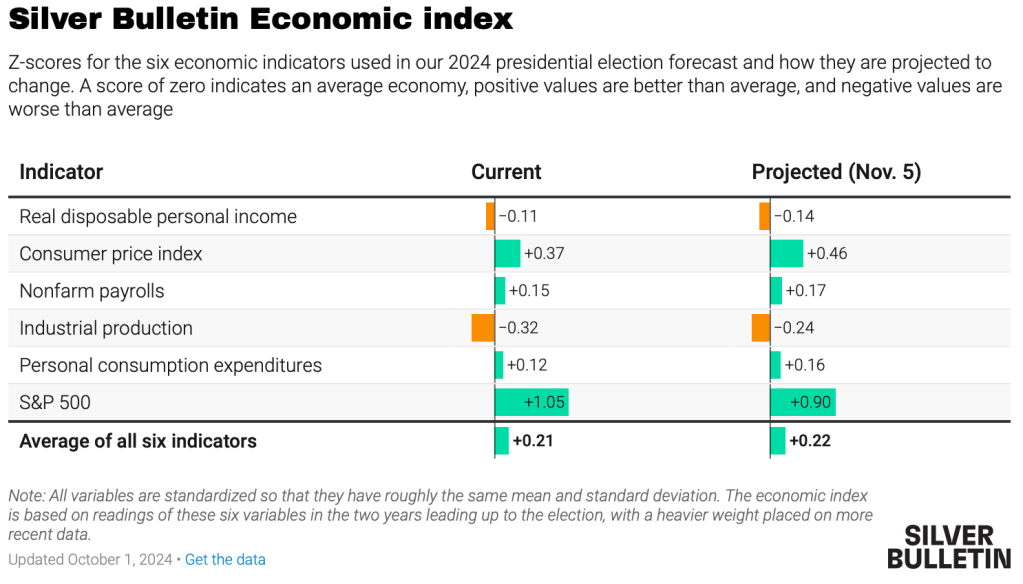
Overall I see this as one more set of indicators that showing an election that is very close, but slightly favoring Harris. Just like prediction markets (Harris currently at a 50% chance on Polymarket, 55% on PredictIt) and forecasts based mainly on polls (Nate Silver at 55%, Split Ticket at 56%, The Economist / Andrew Gelman at 60%). Some of these forecasts also include national economic data:

Gelman suggests that the economy won’t matter much this time:

We found that these economic metrics only seemed to affect voter behaviour when incumbents were running for re-election, suggesting that term-limited presidents do not bequeath their economic legacies to their parties’ heirs apparent. Moreover, the magnitude of this effect has shrunk in recent years because the electorate has become more polarised, meaning that there are fewer “swing voters” whose decisions are influenced by economic conditions.

But while the economy is only one factor, I do think it still matters, and that forecasters have been underrating state economic data, especially given that in two of the last 6 Presidential elections the electoral college winner lost the national popular vote. I look forward to seeing more serious research on this topic.

Herd Mentality Among Pediatricians Caused Current Peanut Allergy Epidemic

A headline, “How Pediatricians Caused the Peanut Allergy Epidemic” got me to click the other day. The article makes some important points, I think.

Having a peanut allergy is a serious health concern, both as an adult and for one’s child. For a sensitized person, exposure to peanut-containing products can be fatal if an Epi-pen or emergency room is not available for an epinephrin injection. Since this is an economics blog, I’ll note that a 2012 survey estimated the economic cost of any food allergy in US children at $24.8 billion annually, or $4184 per child. This includes direct medical costs, and the indirect costs, including opportunity costs, for children and their caregivers.

Out of an abundance of caution, pediatricians in the 1990s started recommending that parents keep peanuts from their infants and children. Instead of protecting children, however, this policy has done just the opposite. The incidence of peanut allergies has soared, with now some 2.5% of the pediatric population showing peanut allergies:

Around the year 2000 peanut allergies began to skyrocket. Sales of EpiPens, used in cases of peanut-induced anaphylactic shock, became a major expense for parents and a growing profit center for the manufacturer. … So, what changed? How did peanuts go from cheap, nutritious food source to become the little death pills that we think of them today? The answer is not what you would expect: pediatricians created the peanut allergy epidemic.

Meanwhile, the more that health officials implored parents to follow the recommendation, the worse peanut allergies got. From 2005 to 2014, the number of children going to the emergency department because of peanut allergies tripled in the U.S. By 2019, a report estimated that 1 in every 18 American children had a peanut allergy. 

It did not have to go like this.  I poked about the web and found another article, titled The Medical Establishment Closes Ranks, and Patients Feel the Effects, which framed matters in terms of physician behaviors:

 Peanut allergies in American children more than tripled between 1997 and 2008, after doctors told pregnant and lactating women to avoid eating peanuts and parents to avoid feeding them to children under 3. This was based on guidance issued by the American Academy of Pediatrics in 2000.

You probably also know that this guidance, following similar guidance in Britain, turned out to be entirely wrong and, in fact, avoiding peanuts caused many of those allergies in the first place.

That should not have been surprising, because the advice violated a basic principle of immunology: Early exposure to foreign molecules builds resistance. In Israel, where babies are regularly fed peanuts, peanut allergies are rare. Moreover, at least one of the studies on which the British advice was based showed the opposite of what the guidance specified.

As early as 1998, Gideon Lack, a British pediatric allergist and immunologist, challenged the guidelines, saying they were “not evidence-based.” But for years, many doctors dismissed Dr. Lack’s findings, even calling his studies that introduced peanut butter early to babies unethical.

When I first reported on peanut allergies in 2006, doctors expressed a wide range of theories, at the same time that the “hygiene hypothesis,” which holds that overly sterile environments can trigger allergic responses, was gaining traction. Still, the guidance I got from my pediatrician when my second child was born that same year was firmly “no peanuts.”

It wasn’t until 2008, when Lack and his colleagues published a study showing that babies who ate peanuts were less likely to have allergies, that the A.A.P. issued a report, acknowledging there was a “lack of evidence” for its advice regarding pregnant women. But it stopped short of telling parents to feed babies peanuts as a means of prevention. Finally, in 2017, following yet another definitive study by Lack, the A.A.P. fully reversed its early position, now telling parents to feed their children peanuts early.

But by then, thousands of parents who conscientiously did what medical authorities told them to do had effectively given their children peanut allergies.

This avoidable tragedy is one of several episodes of medical authorities sticking to erroneous positions despite countervailing evidence that Marty Makary, a surgeon and professor at Johns Hopkins School of Medicine, examines in his new book, “Blind Spots: When Medicine Gets It Wrong, and What It Means for our Health.”

Rather than remaining open to dissent, Makary writes, the medical profession frequently closes ranks, leaning toward established practice, consensus and groupthink.

This article describes further instances of poorly-founded medical advice. Women were scared away from helpful estrogen hormone replacement therapy for many years because of unfounded fears of breast cancer. Blood donor institutions suppressed concerns about AIDS in donated blood, in order to not rock the boat:

In 1983, near the beginning of the AIDS crisis, the American Red Cross, the American Association of Blood Banks and the Council of Community Blood Centers rejected a recommendation by a high-ranking C.D.C. expert to restrict donations from people at high risk for AIDS. Instead, they issued a joint statement insisting that “there is no absolute evidence that AIDS is transmitted by blood or blood products.” The overriding concern was that Americans would not trust the blood supply, or donate blood, if people questioned its safety.

As with the advice on peanuts, a reversal came about far later than it should have. It took years for the blood banking industry to begin screening donors and it wasn’t until 1988 that the F.D.A. required all blood banks to test for H.I.V. antibodies. In the interim, half of American hemophiliacs, and many others, were infected with H.I.V. by blood transfusions, leading to more than 4,000 deaths.

That is poignant for me, since a good friend of mine died from AIDS that he contracted through a blood transfusion in that timeframe.

Well, what to do now about peanuts? It seems an obvious action is to expose infants to peanuts, at 4-6 months, along with other solid foods – – perhaps with the caveat to start with small doses and preferably stay within driving distance of an emergency room should that be needed. As for children who now manifest peanut allergies, there is some hope of desensitizing them if you start young enough, preferably no more than three years old.
The Power is still out

We’re on day 4 without electricity, so this will be a brief post. Things I’ve learned or had reinforced:

  1. Prepping for the apocalypse is silly but prepping for a disaster is not. This time has been inefficient and uncomfortable, but not especially problematic. Compared to Asheville, we got off quite easy, a fact made all the clearer by our fortune to maintain a fairly normal life thanks to the most modest of preparations: a couple charged phone banks, LED lamps, batteries, a propane tank and grill, and coolers pre-filled with ice.
  2. Price controls during a disaster, formal and informal, remain problematic. More than few people saw their esteem of Clemson drop as fans descended on the region for the football game and grab up every bag of ice they laid eyes on to facilitate their tailgating, a problem that probably could have been averted by simply letting the price of ice quadruple.
  3. Public goods matter and government remains a superior way of providing and coordinating large swaths of them. Not to get all Nozick and Rawls on you, but think of it this way: disaster response and coordination requires scale. Any institution that emerges that is superior in providing such responses will have the scale of government, will be a de facto government, regardless of whether you call it a government or not.
  4. Power lines. Bury the damn power lines. God how I miss living where the bulk of power lines were underground. I never knew how good I had it.
  5. Hank was right. Propane and propane accessories are where it is at.

Stay safe everyone.

Probability Theory for the Minecraft Generation

If you are teaching statistics to 20-year-olds (or maybe even if you are not), you might be interested in ways to make probability theory more engaging. I watched a students eyes light up when I showed this in class, so that makes it feel worth sharing.

The Law of Large Numbers is a standard part of statistics or business analytics classes. Something that goes along with it conceptually is “The Law of Truly Large Numbers,” sometimes also called The Infinite Monkey Theorem. The idea is that if you put monkeys in front of typewriters, perhaps infinite monkeys with infinite typewriters and with infinite time, they will eventually write a Shakespeare play.

To illustrate this feature of probability theory for the video gamers, a fun and well-produced video is
“Can Mobs Beat Minecraft?” by Wifies

There is nothing inappropriate for students. The video is 13 minutes, which is too long to show during a class session. I recommend watching the first minute and a half and then explaining that the middle is a lot of gaming details to prove that it is technically possible that a randomly acting “mob” could eventually beat the entire Minecraft game, given enough time.

At the 10-minute mark, the math begins. You could watch about one more minute and a half to see how he tries to calculate the infinitesimally-small-and-yet-positive probability that this could happen. Given enough time, just about anything that is possible will happen.

Another possibility for a teacher is not to show the video in class but to offer it as an optional or extra credit assignment, so that a student who loves Minecraft could really have fun with it and other students can skip.

For me, this pairs with Chapter 5 on Probability for the textbook Applied Statistics in Business and Economics.

Another teaching tip. If you ever need to print out paper rulers, you might be Googling “printable rulers” and you’ll see a bunch of scams as the top results. THIS link works: https://www.brightonk12.com/cms/lib/MI02209968/Centricity/Domain/517/Ruler_6-inch_by_16.pdf