A market neutral equity fund holds a large number of stocks in both long and short positions, so the net asset value is near zero. In theory, this means that the value of the fund should be fairly insensitive to overall market fluctuations. The fund’s performance depends entirely on the skill of the fund manager in buying (going “long”) stocks with a better chance of going up, while selling short a suite of stocks that are likely to perform more poorly.
Fund managers use criteria (“factors“) such as value, momentum, quality, and mean-reversion to select which stocks to go long versus short. Investors see market neutral funds as a means of producing maybe 4 to 8% return (alpha), with relatively low volatility and low exposure to overall market movements (i.e., low beta). Institutional investors love funds like these for adding diversification to their portfolios, so they hold many tens of billions of dollars of market neutral funds available only to them.
We lowly retail investors have access to some such funds. I will just focus here on two of the larger and more successful retail market neutral funds, offered by AQR Capital Management, and by BlackRock, respectively. These appear in a mutual fund wrapper, instead of an ETF. As with many mutual funds, there are different investor classes for a given fund family. If you invest a huge amount of money, you get the lowest annual fees (e.g., for QMNIX and BDMIX “Institutional” classes), but all the classes for given fund are invested in the same underlying strategy and assets.
To try to put these on the same basis for comparison for us ordinary folks, I will look at versions of each of these funds that do not require over $1 million additional investment, and which do not have an obnoxious (5.25%) upfront sales load. QMNNX is offered by AQR. It holds some international along with US stocks, and is constantly tweaking its long and short portfolio based on a proprietary set of factors, which are based on an enormous amount of data and calculations. The strategy behind BlackRock’s BDMCX is somewhat different. It probably uses similar types of factors (value, momentum, mean-reversion, etc.), but it tries to specifically match long and short companies within industry categories. Thus, in theory, it should be relatively insulated from a crash of say software stocks, since it is long and short in equal amount in that category.
OK, let’s look at actual performance. Here is a 10-year chart, with QMNNX in orange, BDMCX purple, compared to the S&P 500 in blue and BND (total bond market) in light green.
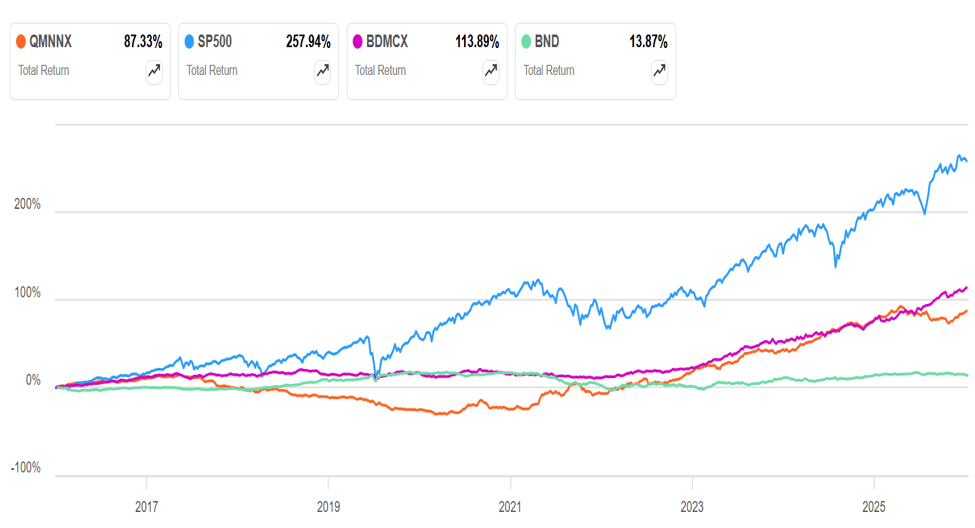
This chart might make you run screaming out the door – both funds did so poorly in the 2016-2021 timeframe that their ten-year total returns are far less than the broad market. But this is not really a fair comparison. These vehicles are not intended to compete with a 100%-long portfolio. A better comparison is to bonds, and it can be seen that both market neutral funds beat BND (green line) handily over this time period. It is worth noting that the AQR fund QMNNX got decimated in the 2018-2022 – – that was a time when the market rewarded ONLY growth, even for stocks which scored badly on traditional “value”. Thus, QMNNX was long the value stocks which were shunned by the market, and short the tech stocks that roared upward. So, while the overall market was ripping upward, QMNNX went down and down and down, losing some 30% of its value while its investors lost faith and sold out. The within-industry matching for BlackRock’s BDMCX protected it from such gross losses, though it showed only modest gains in that 2016-2021 time period.
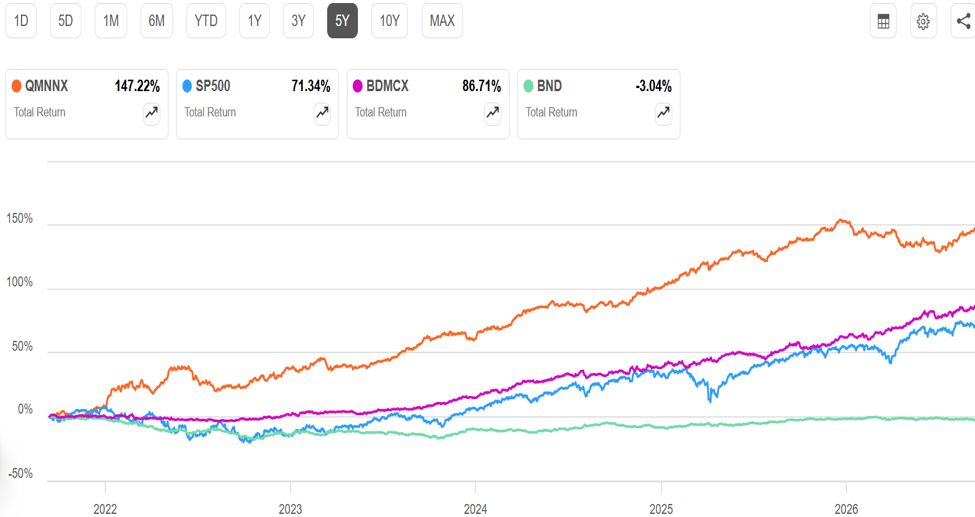
The picture changes entirely when we look at a five-year timeframe (below). QMNNX’s value tilt was finally vindicated in 2022, as the fund soared while tech stocks crashed. Three cheers for diversification! The fund kept up an absolute positive edge over the mighty S&P 500 for each of the years 2023, 2024, and 2025. It seemed like AQR had cracked the code for superior equity returns. Its five-year return is more than double that of the S&P, which is stunning. Meanwhile, BDMCX kept up a steady performance, roughly matching the S&P, but with much lower volatility. That is pretty good. Meanwhile, the rises in interest rates trashed the returns of bonds (green line).
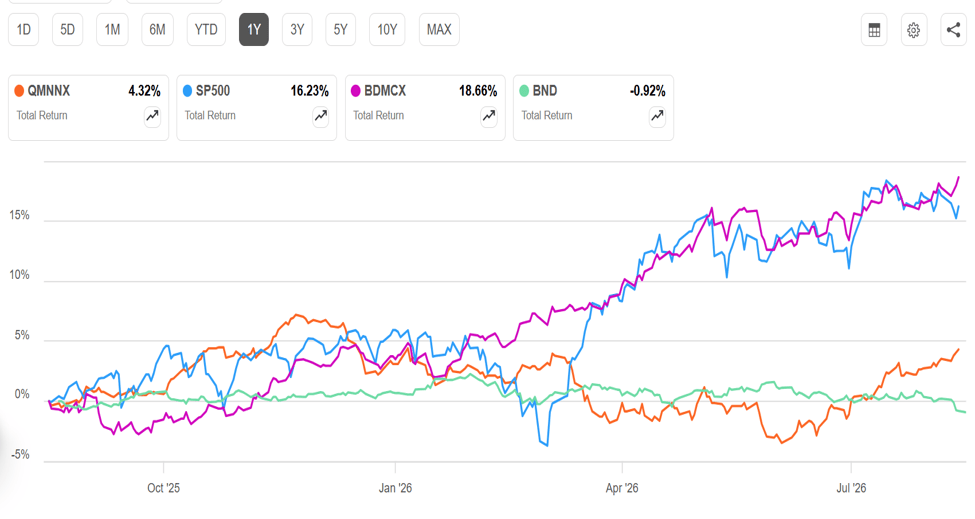
The picture shifts again when we look at one-year total returns (below). BDMCX continues to roughly match the S&P. This is a significant achievement when stocks are in a big bull run, showing that the BlackRock fund managers continue to make very good calls on prospective weak vs strong stocks. QMNNX had a poor first half 2026, with an absolute decline. For some reason, its factors did not correctly forecast relative stock performances. It has started to recover some mojo in the past few months, enough to beat out the long-suffering bond market.
My personal takeaways are:
- We cannot expect this type of fund to routinely beat or even match overall stocks. However, as diversifiers, they might be compared to say bonds or REITs, and they hold up well in that comparison. The overall U.S. market (dominated by big tech) has been going up so much, for so long, that it may seem like any diversification away from stocks is a waste. Time will tell.
- The stellar (market-matching or even market-beating) performances seen for QMNNX and BDMCX over the past five years are probably largely flukes, and should not be relied on going forward.
- Due to its rigorous within-sector net neutral construction, BDMCX is unlikely to soar, but it is also unlikely to crash. I think of it as a “Steady Eddie”. The looser construction of QMNNX gives it the freedom for great outperformance (especially in a tech crash), but makes it more vulnerable to extended losses if the market moves against its view of reality.
Disclaimer: Nothing here should be taken as advice to buy or sell any security.


