Jerome Powell’s term as Fed Chair ends in late May 2026. President Trump has said that he will nominate a new chair and the US senate will confirm them. It may take multiple nominations, but that’s the process. The new chair doesn’t govern monetary and interest rate policy all by their lonesome, however. They have to get most of the FOMC on board in order to make interest rate decisions. We all know that the president wants lower interest rates and there is uncertainty about the political independence of the next chair. What will actually happen once Jerome is out and his replacement is in?
The treasury markets can give us a hint. The yields on government debt tend to follow the federal funds rate closely (see below). So, we can use some simple logic to forecast the currently expected rates during the new Fed Chair’s first several months.
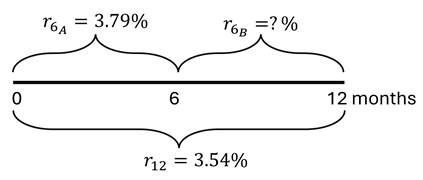
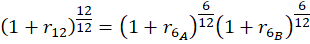
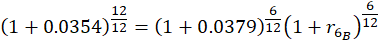
Here’s the logic. As of October 16, the yield on the 6-month treasury was 3.79% and the yield on the 1-year treasury was 3.54%. If the market expectations are accurate, then holding the 1-year treasury to maturity should yield the same as the 6-month treasury purchased today and then another one purchased six months from now. The below diagram and equation provide the intuition and math.
Since the federal funds rate and US treasury yields closely track one another, we can deduce that the interest rates are expected to fall after 6 months. Specifically, rates will fall by the difference in the 6-month rates, or about 49.9 basis points (0.499%). This cut is an expected value of course. Given that the cut is between a half and a zero percent, we can back out the market expectation of for a 0.5% vs 0.0% cut where α is the probability of the half-point cut.* Formally:
The Federal Reserve will probably cut rates next week:
I can’t advise them on the complexpolitics of this, but based on the economics I think cutting would be a mistake. I see one good reason they want to cut: hiring is slow and apparently has been for a year. But that could be driven by falling labor supply rather than falling demand, and most other indicators suggest holding rates steady or even raising them.
Most importantly, inflation is currently well above their 2% target, 2.9% over the past year and a higher pace than that in August. Inflation expectations remain somewhat elevated. Real GDP growth was strong in Q2 and looks set to be strong in Q3 too, and NGDP growth is still well above trend.. The Conference Board’s measure of consumer confidence looks bad, but Michigan’s looks fine.
Financial conditions are loose, with stocks at all time highs and credit spreads low. Its only September and we’ve already seen more Initial Public Offerings than in any year since 2021 (when the last big bout of inflation kicked off):
Crypto prices are back near all time highs and crypto is becoming more integrated into public stocks through bitcoin treasury companies and IPOs from Gemini and Figure.
The Taylor Rule provides a way of putting all this together into a concrete suggestion for interest rates. Some versions of the rule say rates are about on target, while others including my preferred Bernanke versionsuggest they should be closer to 6%. To me this is what the debate should be- do we keep rates steady or raise them? I see good arguments each way, but the case for a cut seems very weak.
I look forward to finding out in a year or two whether I or the FOMC is the crazy one here.
* The Usual Disclaimer, hopefully extra obvious in this case: These views are mine and I’m not speaking for any part of the Federal Reserve System.
After raising rates in 2022 to belatedly combat inflation, the FOMC was feeling successful in 2024. They were holding the line and remaining steadfast while many people were getting all in a tizzy about pushing us into a recession. People had been predicting a recession since 2022, and the Fed kept the federal funds rate steady at 5.33% for an entire year. Repeatedly, in the first half of 2024, betting markets were upset that the Fed wasn’t budging. I had friends saying that the time to cut was in 2023 once they saw that Silicon Valley Bank failed. I remained sanguine that rates should not be cut.
I thought that rates should have been higher still given that the labor market was strong. But, I also didn’t think that was going to happen. My forecasts were that the Fed would continue to keep rates unchanged. At 5.33%, inflation would slowly fall and there was plenty of wiggle room for unemployment.
Then, we had a few months of lower inflation. It even went slightly negative in June 2024. Some people were starting to talk about overshooting and the impending recession. I documented my position in August of 2024. Two weeks later, Jerome Powell gave a victory lap of a speech. He said that “The time has come for policy to adjust”. Instead of discerning whether the FOMC would cut rates, the betting markets switched to specifying whether the cut would be 0.25% or 0.5%. The Fed chose the latter, followed by two more cuts by the end of the year.
I was wrong about the Fed’s policy response function. But why? Was the FOMC worried about the downward employment revisions? That was big news. Did they think that they had inflation whipped? I’m not sure. There was a lot of buzz about having stuck the soft landing. In late 2024, I leaned toward the theory that the Fed was concerned about employment. Like, they thought that we had been doing better until then.
There’s so much to say about interest rates. Many people think about them in the context of whether they should refinance or in terms of their impact on borrowing. But interest rates also matter for production beyond impacting loans for new productive projects. Interest rates aren’t just a topic for debtors.
Interest rates impact all production that takes time. That’s the same as saying that interest rates affect all production – but the impact is easier to see for products that require more time to produce.
There’s this nice model called ‘Portfolio Theory’. Taken literally, it says that everything you own can be evaluated in terms of its liquidity, the time until it will be sold, its expected returns, and the volatility and correlation of those returns. Once you start to look at the world with this model, then it’s much easier to interpret. Buying a car? That’s usually a bad investment. It’s better to tie up a smaller amount of money into that depreciating asset rather than to let a larger sum of money experience dependably negative returns. Of course, this assumes that there are alternative uses for your money and alternative places to invest your resources – hopefully in assets with growing rather than decaying value. People often recommend purchasing used cars rather than new cars. Both new and used cars are bad investments and you can choose to invest a lot or a little.
Producers make a similar calculation. All kinds of things motivate them: love, tradition, excellence… But everyone responds to incentives. Consider vintners. They might be a farmer of grapes and a manufacturer and seller of wine. They might like to talk about nostalgia, forward notes, a peppery nose, and other finer things. But even they respond to prices and opportunity cost.
Interest rates communicate the value of resources over time. For example, if you take out a loan, then the interest rate tells you how much you must to pay in order to keep that money over the life of the loan. The interest rate also reflects how much the lender will be compensated in exchange for parting with their funds. On the consumer side, the interest rate reflects the price that the borrower is willing to pay in order to avoid delaying a purchase.
When a business borrows, the interest rate reflects the minimal amount of value that they would need to create in order to make an accounting profit. For example, if a business borrows $100 for one year at an interest rate of 5%, then they need to earn $105 by the time that they repay the loan in order to break even with zero profit. The business would need to earn more than 5% in order to earn a profit on their borrowing and investment venture.
The longer the business takes to repay their loan, the more interest that accrues. And, the higher the interest rate, the more they need to earn in order to repay their loan.
This logic applies to all production because all production takes time. If production takes very little time, then the impact of the interest cost is miniscule. But, if production takes longer, then interest rates become increasingly relevant. These kinds of products include trees, cheese, wine, livestock, etc. Anything that ages, ferments, or has a lengthy production process will be more sensitive to the cost of borrowing.
How?
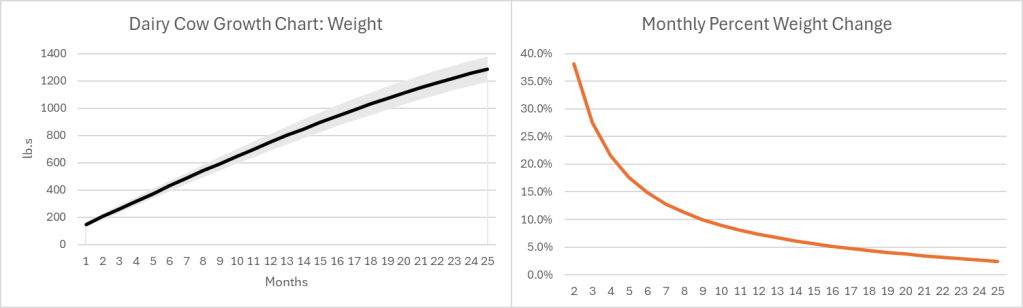
The growth pattern for most (all?) goods looks similar. Below-left is a growth chart for dairy cows . Notice that calves grow quickly at first, and their growth slows over time. For the sake of argument, let’s say that the change in value of a cow mimics the change in weight (Yes, I know that dairy and beef cows are different, but the principle is the same). Below-right is the monthly percent change. Even at an age of 25 months a cow is still growing in value at 2.4% per month or 33% per year.
Of course, there is a risk that some cows don’t survive to slaughter, lowering the expected growth rate. Since most cattle are slaughtered between 18 and 24 months of age, their growth rate at the time of slaughter is 4.4%-2.7% per month. As the interest rate at which farmers borrow rises, the optimal age at slaughter falls. Otherwise, the spread between the growth rate and the interest rate could go negative. Even so, what an investment! If you can borrow at, say, 8% per year, then you’ll make money hand-over-fist on the spread.
Except… Cows cost money to raise, and most of that cost is feed. According to the production indicators and estimated returns published by the USDA, the cost of feed in February of 2023 was $158.11 per hundred pounds of beef. The selling price of beef was $161.07. That leaves $2.96 or a profit of 1.87% earned over the course of 1.5-1.75 years. That investment is starting to look a lot less good, especially since it doesn’t include the cost of maintaining facilities, insurance, etc. It’s no wonder that farmers and ranchers are serious about their subsidies. Clearly, with such tight margins, farmers and ranchers are going to look good and hard at the interest rates that they pay on their debt. And, they do have debt.
However, the recent increase in beef prices is not caused by higher interest rates.
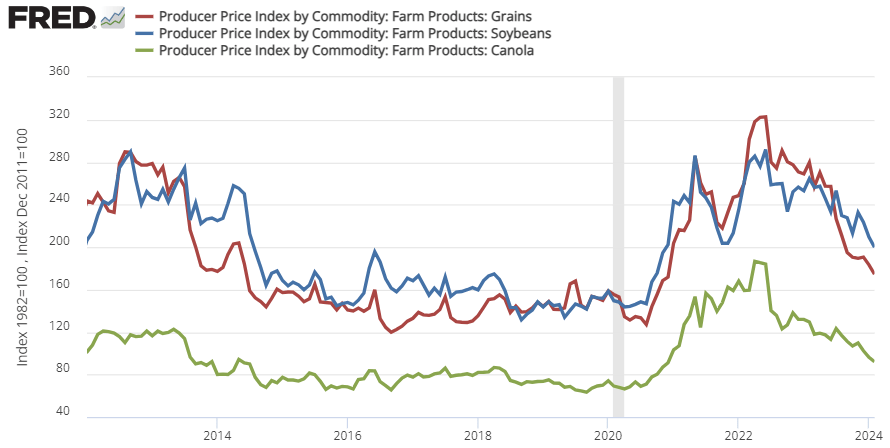
That 1.87% profit margin is at prices and costs from February 2023. Since 2020, the price of cattle feed ingredients (grain, bean, and oil) peaked in the summer of 2022 and are still substantially more expensive than pre-Covid (see below). That means that cows getting slaughtered right now were raised on more expensive feed. This February 2024, the cost of feed per 100lb. of cattle was $191.80. But the cattle selling price was only $180.75. That’s a $11.05 loss for cattle raising. Wholesale prices of cattle might be up recently, but the cost of feed is up by more. It’s not the cattle farmers who are benefiting from the high beef prices. In fact, they’re getting squeezed hard.
There is good news. The cost of feed ingredients has been falling recently, which means that beef farmers should begin to see some relief if the recent trend continues. For Consumers, the price of beef is already down from its 2023 peak.
I’m teaching principles of macro this semester. Making macroeconomics sound important to students is partly about explaining that recessions are painful and significant.
As Alex Tabarrok says, “The Great Depression is Over!” Maybe Gen Z can appreciate the significance of the Great Depression, but it is history. Gen Z has heard of the Great Recession, but keep in mind that a student who is 20-y-o in 2024 was 4 in 2008. It’s a weird one, but there has been a recession more recently. The Covid Recession is what I like to link to, when possible, in class.
To teach the inflation chapter this week, I’m using video clips that I’ll put up here as resources for others.
To start off the inflation chapter and bring in a more global perspective, I show: “Zimbabwe’s inflation rate hits triple digits” This 2-minute news clip was produced by Al Jazeera. They talk about lending and policy in addition to retail price increases.
After we have gone through some definitions, I show two clips of an economic forecast that was recorded in 2021. I don’t usually show such long clips in class, but I’m relying on dramatic irony to make it interesting. The students know the path that inflation took from 2020 to 2024, but Dr. Doti in the video does not. I stop the video occasionally to point out connections to our textbook.
Dr. Jim Doti predicts that an unprecedented increase in the money supply after Covid will lead to inflation. He’s not right about everything, but that’s what makes it so interesting. Right after showing students the quantity theory of money equation, I can show them someone trying to apply it from about minute 25 to about minute 35. (don’t start the video from minute 1)
Then, I go back to my lecture and introduce the Fisher effect. Next, we watch about minute 38 to minute 43 of the 2021 forecast because of the direct connection of inflation to interest rates. Partly this just helps illustrate how messy the real world is.
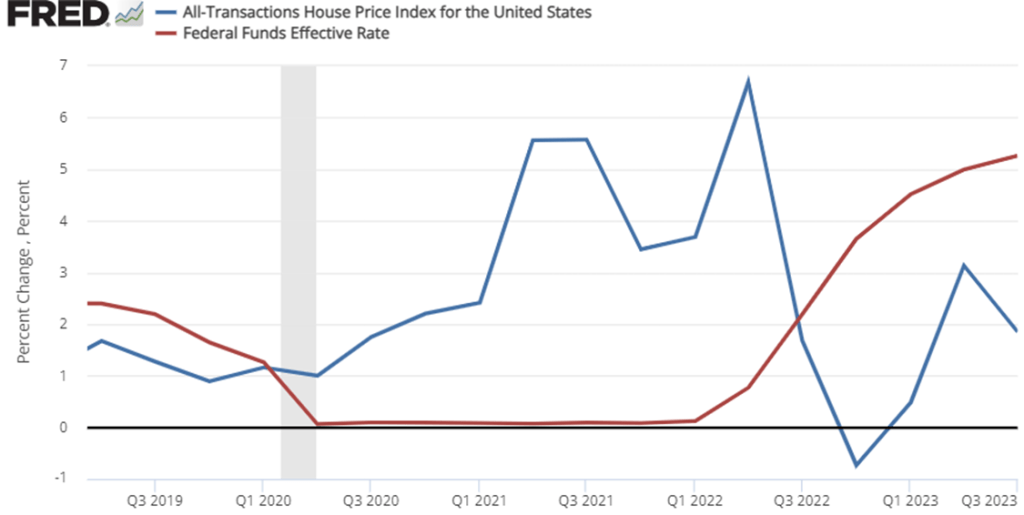
The third quarter ‘All Transaction’ housing price data was just released this week. These numbers are interesting for a few of reasons. One reason is that home prices are a big component of our cost of living. Higher home prices are relevant to housing affordability. This week’s release is especially interesting because it’s starting to look like the Fed might be pausing its year 18-month streak of interest rates hikes. In case you don’t know, higher interest rates increase the cost of borrowing and decrease the price that buyers are willing to pay for a home. Nationally, we only had one quarter of falling home prices in late 2022, but the recent national growth rate in home prices is much slower than it was in 2021 through mid-2022.
Do you remember when there were a bunch of stories about remote workers and early retirees fleeing urban centers in the wake of Covid? We stopped hearing that story so much once interest rates started rising. The inflection point in the data was in Q2 of 2022. After that, price growth started slowing with the national average home price up 6.5%. But the national average masks some geographic diversity.
I make a hobby of reading, and sometimes acting on, investment advice, particularly regarding high-yielding securities (many of my holdings are now yielding over 10%/year). One of the best authors on the Seeking Alpha investing site writes under the name of Colorado Wealth Management. He mainly writes on REIT (real estate investment trust) stocks, but recently opined on the wisdom of raising interest rates to combat inflation regarding some of the major components of CPI.
His article, Why High Yields Will Be Popular Again, may be behind a paywall for some readers, so I will summarize some key points. He kind of sidesteps the influence of massive federal deficit spending that injected trillions and trillions of new dollars into the economy for COVID, which I think has been the major driver for this inflation; and the reignited deficit spending which is already on the books for November and likely even huger for December of this year. However, he does make some interesting (and new to me) points regarding food prices in particular.
He sees the price 2021-2022 price increases in some major food items as being driven by supply constraints, rather then by excessive demand. Specifically eggs, coffee, and vegetable oils have been hit by exogenous factors which have constrained supply; raising interest rates will not help here, and may even hurt if higher rates make it harder for farmers to recover and re-start high production. I’ll transition to his charts and mainly his excerpted words, in italics below:
Avian Flu, Culled Hens, and the Price of Eggs
The background here is that tens of millions of chickens, including egg-laying hens, have been deliberately killed (“culled”) this year in an attempt to slow the spread of avian flu. This, of course, cuts into the egg supply and raises egg prices. We went through a similar cycle in 2015 with avian flu, where culling led to a rise in egg prices, but then prices fell naturally as a new crop of chicks grew into egg-laying hens. Similarly, the current shortage in eggs should correct itself:
Raising interest rates has never produced additional eggs. Raising interest rates and driving a recession (with larger credit spreads) only makes it more difficult for farmers to get the funding necessary to replace tens of millions of hens that were culled to slow the spread of the avian flu….If interest rates don’t work, what will? The cure for high prices is high prices. We can see how it played out with the Avian flu in 2015:
Is Jerome Powell going to lay even one egg? Probably not.
Are farmers going to focus on turning their chicks into egg-laying hens? Absolutely.
Since eggs go into several other products, it drives inflation throughout the grocery store. Even if a product doesn’t use eggs, the drop in egg production means more people eating other foods.
Drought in Brazil and the Price of Coffee
Coffee prices have been rising rapidly. Well, domestic prices have been rising rapidly. Global prices actually declined since peaking in February 2022:
So, what drove the price up? Brazil normally produces over 35% of the world’s coffee and bad weather in Brazil (not to mention the pandemic impacts) drove dramatically lower production in 2021. As the shortfall in production became evident, global prices began rising rapidly. That’s why the global [wholesale] prices were ripping higher in 2021, not 2022. However, [retail] consumers are seeing most of the impact over the last several months.
War in Ukraine and the Price of Sunflower Oil
Margarine requires vegetable oil. Soybean, palm, sunflower, and canola oil are the key ingredients. What country produces the most sunflower oil? Ukraine. This is one of several inflationary impacts of the war. You can see the impact of reduced supply in the following chart:
Government Bungling in Indonesia and the Price of Palm Oil
What happened to palm oil? How could it soar so much and then fall so hard?
The first issue is that dramatic increases in the price of fertilizer made production more expensive. … That contributed to a reduction in supply. However, Indonesia is the world’s largest exporter of palm oil. Yet exports of palm levy were subject to a huge levy. That made exporting far more expensive. Despite the levy, it was still worth producing and exporting palm oil. Then the Indonesian government decided to simply ban exports over concern about higher domestic prices. Banning exports for a country that produces 59% of the world’s total palm oil exports had a predictable impact.
If you guessed that the supply of palm oil couldn’t be sold domestically, you’d be right. The ban was lifted. However, it was only after:
“High palm oil stocks have forced mills to limit purchases of palm fruits. Farmers have complained their unsold fruits have been left to rot. There were 7.23 million tonnes of crude palm oil in storage tanks at the end of May, data from the Indonesian Palm Oil Association (GAPKI) showed on Friday.“
With palm oil prices at all time-record highs, nearly triple the level from two years prior, the supply was left to rot. Each business tried to make the best decision they could, given the ban on exports. Rather than record profits for mills and record profits for farmers, the produce was wasted. That’s supply constraints for the global market, and it destroys the local economy.
Global prices are plunging now as mills seek to unload their storage. As bad as the higher prices were for the rest of the world, no one suffered worse than the farmers whose product became worthless as a result of government failure.
Contrary to today’s popular opinion, higher interest rates won’t do anything to improve production of vegetable oil.
US housing prices shot up during the pandemic. People spending all day at home wanted bigger houses, and the Fed fueled their demand with low interest rates. But home owners didn’t want to sell- the total number of homes on the market is less than half what it was a year ago. This combination of rising demand & falling supply has sent prices way up & cut the time homes spend on the market.
Contrary to popular belief, its actually rare for economists to make market forecasts and most of us aren’t especially well-equipped to do so- but I’m going to try anyway! I think home prices will almost certainly stop growing so quickly, and may actually fall, within two years.
Why? The end of the pandemic, the rise of new construction, and the end of low interest rates.