Consumption is the largest component of GDP. In 2019, it composed 67.5% of all spending in the US. During the Covid-19 recession, real consumption fell about 18% and took just over a year to recover. But consumption of services, composing 69% of consumption spending, hadn’t recovered almost two years after the 2020 pre-recession peak. For those keeping up with the math, service consumption composed 46.5% of the economic spending in 2019.
We can decompose service consumption even further. The table below illustrates the breakdown of service consumption expenditures in 2019.

I argued in my previous post that the Covid-19 pandemic was primarily a demand shock insofar as consumption was concerned, though potential output for services may have fallen somewhat. When something is 67.5% of the economy, ‘somewhat’ can be a big deal. So, below I breakdown services into its components to identify which experienced supply or demand shocks. Macroeconomists often get accused of over-reliance on aggregates and I’ll be a monkey’s uncle if I succumb to the trope (I might, in fact be a monkey’s uncle).
Before I start again with the graphs, what should we expect? Let’s consider that the recession was a pandemic recession. We should expect that services which could be provided remotely to experience an initial negative demand shock and to have recovered quickly. We should expect close-proximity services to experience a negative demand and supply shock due to the symmetrical risk of contagion. Finally, we should expect that services with elastic demand to experience the largest demand shocks (If you want additional details for what the above service categories describe, then you can find out more here, pg. 18).
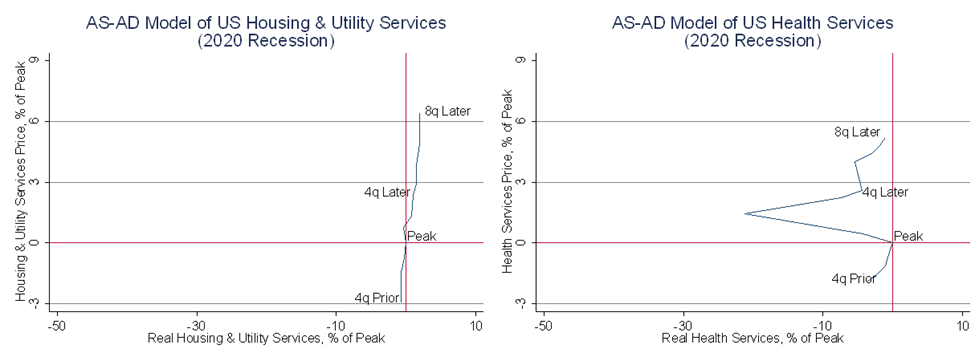
Below are the AS-AD graphs for housing & utility and health services. Both sectors experienced immediately higher prices, but output only declined for health services. Spending for housing never fell and ultimately increased by 8%. The demand for health services fell initially for six months, and then was ultimately up by 4%. Note that there is no apparent decline in the supply of housing services. When the pandemic hit, people demanded more housing and the commensurate utilities. But, despite people immediately demanding less healthcare, prices rose – reflecting the increased cost of production. We like to say that healthcare workers were particularly at risk of catching Covid. But we really mean that their job was most hampered by catching covid. After all, grocery store retail employees were also on the front lines and no more immune than nurses and doctors.
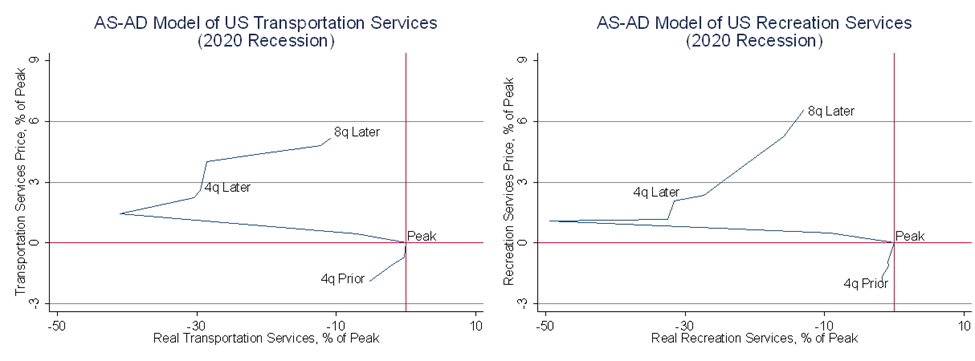
Below are the AS-AD graphs for transportation and recreations services. Spending fell immediately, but remained depressed by 5.7% and 7.1% respectively. Again, despite the fall in demand, prices rose implying that supply fell also. Not only did people demand less travel and recreation early during the pandemic, suppliers of these services also weren’t so eager either. Now we’re two years later. Lower demand and substantially lower prices implies that we are not as productive at producing these services as we once were. These lower productivities are probably due to the suddenly less safe work environments for which employees require greater compensation.
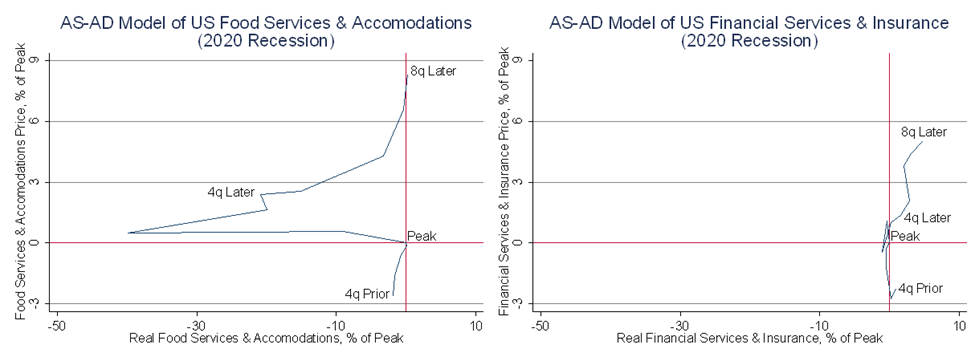
Finally, below are the AS-AD graphs for food services and financial services. Demand for food and financial services fell immediately as the pandemic began, but total spending has since risen 8.6% and 10% above the pre-recession peak. Similar to the above graphs, food services have experienced a decline in the willingness to supply that is probably driven by the now greater opportunity costs of not working in food service. There are safer occupations out there and there are still some residual government pandemic policies that are making employees less eager to work. Regardless, an increase in demand and a decrease in supply has resulted in a fully recovered, though much more expensive, food service industry.
The financial services graph looks like the housing and utility graph. Except for an initial recessionary stutter, rising demand for financial services has been met with a relatively stable supply. Both prices and out have risen as consumers have enticed more resources to the financial services sector. Indeed, in-person financial services were already going the way of the dodo, and the pandemic rewarded firms who were willing to meet demand.
Compositionally, we can make some generalizations. The pandemic by no means reduced output uniformly across all consumer services. During and after the pandemic, remote work became more popular along with working from home. Utilities a financial services were able to accommodate the demand for physical isolation and there was no real recession in those sectors.
You wouldn’t necessarily think that health services and food services are particular similar, but the graphs say that they share some fundamental characteristics. Both sectors experienced sharp declines in demand, but that demand ultimately rebounded as people preferred not to put-off medical services. Different in motivation and similar in effect, eating outside of the house was seen as a hallmark of normalcy. We put up with a lot during the pandemic, and eating at a restaurant tasted particularly sweet to many people after months of being cooped up at home. These two sectors recovered. However, the costs of providing these comforting services increased due to job worsened job safety.
Lastly, after two years, people still haven’t regained the taste for transportation and recreation services. Total spending is still depressed, output is still below the pre-recession peak, and prices are higher. Not only that, but suppliers have also not been keen on providing these close-proximity services. It’s as if there has been a collective agreement to divert resources elsewhere in the economy.

2 thoughts on “It’s Still Hard to Find Good Help These Days”