Waxing Crescent: New Orleans 2013-2023

The scars of Hurricane Katrina were still obvious eight years afterward when I moved to New Orleans in 2013. Where I lived in Mid-City, it seemed like every block had an abandoned house or an empty lot, and the poorer neighborhoods had more than one per block. Even many larger buildings were left abandoned, including high-rises.

Since then, recovery has continued at a steady pace. The rebuilding was especially noticeable when I spent a few days there recently for the first time since moving away in 2017. The airport has been redone, with shining new connected terminals and new shops. The abandoned high-rise at the prime location where Canal St meets the Mississippi has been renovated into a Four Seasons. Tulane Ave is now home to a nearly mile-long medical complex, stretching from the old Tulane hospital to the new VA and University Medical Center complex. There are several new mid-sized health care facilities, but most striking is that Tulane claims to finally be renovating the huge abandoned Charity Hospital:

Old Charity Hospital, January 2023

The new VA hospital opened in 2016 as mostly new construction, but they’ve now managed to fully incorporate the remnants of the abandoned Dixie Beer brewery:

VA Hospital incorporating old Dixie Beer tower, January 2023

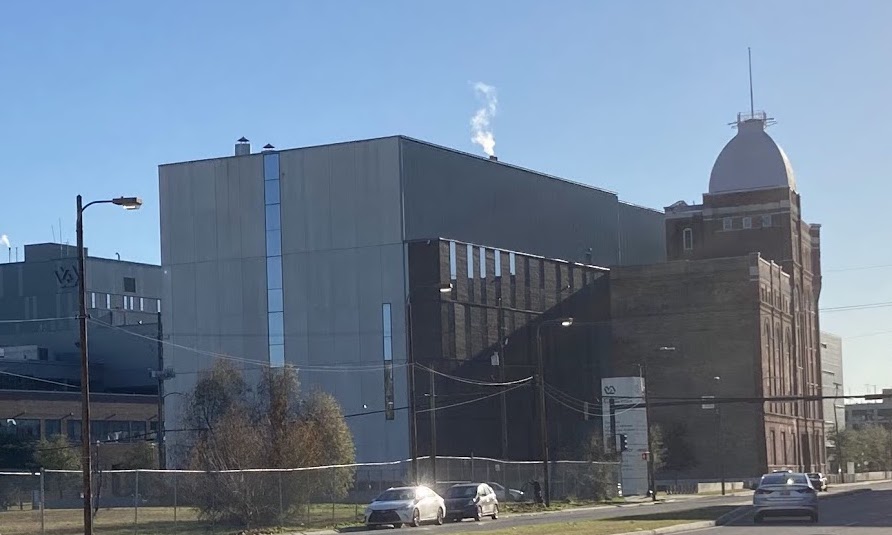
Dixie beer itself opened a new beer garden in New Orleans East, and just renamed itself Faubourg Brewery. Some streets named for Confederates have also been renamed, though you can still see plenty of signs of the past, like the “Jeff Davis Properties” building on the street renamed from Jefferson Davis Parkway to Norman C Francis Parkway.

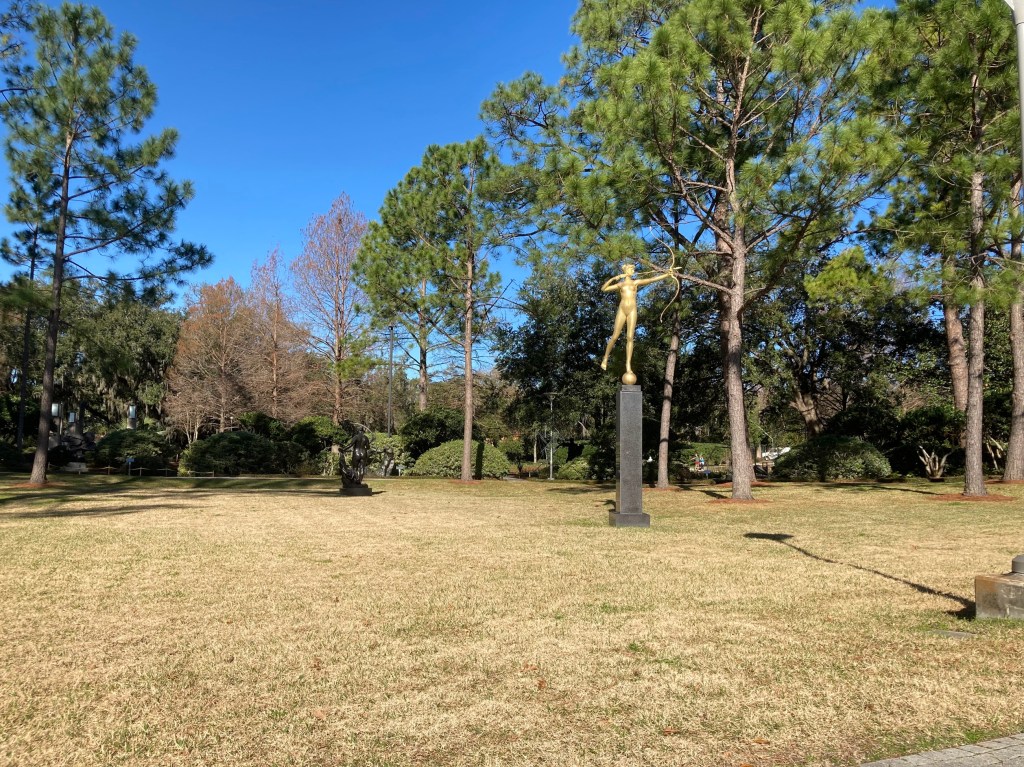
Other big additions I noticed are the new Childrens’ Museum and the greatly expanded sculpture garden in City Park:

Of course, even with all the improvements, many problems remain, both in terms of things that still haven’t recovered from the hurricane, and the kind of problems that were there even before Katrina. The one remaining abandoned high-rise, Plaza Tower, was actually abandoned even before Katrina.

My overall impression is that large institutions (university medical centers, the VA, the airport, museums, major hotels) have been driving this phase of the recovery. The neighborhoods are also recovering, but more slowly, particularly small business. Population is still well below 2005 levels. I generally think inequality has been overrated in national discussions of the last 15 years relative to concerns about poverty and overall prosperity, but even to me New Orleans is a strikingly unequal city; there’s so much wealth alongside so many people seeming to get very little benefit from it.

The most persistent problems are the ones that remain from before Katrina: the roads, the schools, and the crime; taken together, the dysfunctional public sector. Everywhere I’ve lived people complain about the roads, but I’ve lived a lot of places and New Orleans roads were objectively the worst, even in the nice parts of town, and it isn’t close. The New Orleans Police Department is still subject to a federal consent decree, as it has been since 2012. The murder rate in 2022 was the highest in the nation. Building an effective public sector seems to be much harder than rebuilding from a hurricane.

As much as things have changed since 2013, my overall assessment of the city remains the same: its unlike anywhere else in America. It is unparalleled in both its strengths and its weaknesses. If you care about food, drink, music, and having a good time, its the place to be. If you’re more focused more on career, health, or safety, it isn’t. People who fled Katrina and stayed in other cities like Houston or Atlanta wound up richer and healthier. But not necessarily happier.

On Counting and Overcounting Deaths

How many people died in the US from heart diseases in 2019? The answer is harder than it might seem to pin down. Using a broad definition, such as “major cardiovascular diseases,” and including any deaths where this was listed on the death certificate, the number for 2019 is an astonishing 1.56 million deaths, according to the CDC. That number is astonishing because there were 2.85 million deaths in total in the US, so over half of deaths involved the heart or circulatory system, at least in some way that was important enough for a doctor to list it on the death certificate.

However, if you Google “heart disease deaths US 2019,” you get only 659,041 deaths. The source? Once again, the CDC! So, what’s going on here? To get to the smaller number, the CDC narrows the definition in two ways. First, instead of all “major cardiovascular diseases,” they limit it to diseases that are specifically about the heart. For example, cerebrovascular deaths (deaths involving blood flow in the brain) are not including in the lower CDC total. This first limitation gets us down to 1.28 million.

But the bigger reduction is when they limit the count to the underlying cause of death, “the disease or injury that initiated the train of morbid events leading directly to death, or the circumstances of the accident or violence which produced the fatal injury,” as opposed to other contributing causes. That’s how we cut the total in half from 1.28 million to 659,041 deaths.

We could further limit this to “Atherosclerotic heart disease,” a subset of heart disease deaths, but the largest single cause of deaths in the coding system that the CDC uses. There were 163,502 deaths of this kind in 2019, if you use the underlying cause of death only. But if we expand it to any listing of this disease on the death certificate, it doubles to 321,812 deaths. And now three categories of death are slightly larger in this “multiple cause of death” query, including a catch-all “Cardiac arrest, unspecified” category with 352,010 deaths in 2019.

So, what’s the right number? What’s the point of all this discussion? Here’s my question to you: did you ever hear of a debate about whether we were “overcounting” heart disease deaths in 2019? I don’t think I’ve ever heard of it. Probably there were occasional debates among the experts in this area, but never among the general public.

COVID-19 is different. The allegation of “overcounting” COVID deaths began almost right away in 2020, with prominent people claiming that the numbers being reported are basically useless because, for example, a fatal motorcycle death was briefly included in COVID death totals in Florida (people are still using this example!).

A more serious critique of COVID death counting was in a recent op-ed in the Washington Post. The argument here is serious and sober, and not trying to push a particular viewpoint as far as I can tell (contrast this with people pushing the motorcycle death story). Yet still the op-ed is almost totally lacking in data, especially on COVID deaths (there is some data on COVID hospitalizations).

But most of the data she is asking for in the op-ed is readily available. While we don’t have death totals for all individuals that tested positive for COVID-19 at some point, we do have the following data available on a weekly basis. First, we have the “surveillance data” on deaths that was released by states and aggregated by the CDC. These were “the numbers” that you probably saw constantly discussed, sometimes daily, in the media during the height of the pandemic waves. The second and third sources of COVID death data are similar to the heart disease data I discussed above, from the CDC WONDER database, separated by whether COVID was the underlying cause or whether it was one among several contributing causes (whether it was underlying or not).

Those three measures of COVID deaths are displayed in this chart:

Continue reading

Drivers of Financial Bubbles: Addicts and Enablers

I recently ran across an interesting article by stock analyst Gary J. Gordon, The Bubble Addicts Are Here To Stay: A Bubble Investment Strategy. This article may be behind a paywall.  I will summarize it here. Direct citations are in italics.

SOME RECENT FINANCIAL BUBBLES

Gordon starts by recapping four recent financial bubbles:

The commercial real estate bubble of the mid-1980s

The internet stock craze of the late 1990s (with the highest price/earnings valuations ever – – e.g., a startup called Netbank possessed nothing but a website, yet was valued at ten times book value; and went bankrupt a few years later)

The mid-00s housing bubble.

The 2020/2021 COVID bubble:  “The trifecta of a ‘disruptive business model’ stock bubble, SPACs and crypto. You know how this story is ending.”

Gordon then presents an explanation of why humans keep doing financial bubbles, despite the experiences of the past. He suggests that there are both bubble addicts, who have a need to chase bubbles and therefore create them, and bubble enablers who are only too happy to make money off the addicts.

THE BUBBLE ADDICTS

The greedy. Some of us just think we deserve more. I think of an acquaintance who said he was approached to invest with Bernie Madoff, who famously promised steady 10% returns. My friend turned down the offer because he required 15% returns.

Pension funds. This $30 trillion pool of investment dollars targets about a 7% return in order to meet future pension obligations. If pension fund managers can’t consistently earn at least 7%, they have to go to their sponsor – a state government, a corporate CEO, etc. – and ask for more money, or for pension benefits to be cut. And probably lose their job in the process.

Back in the day, bonds were the mainstay pension fund investment. But over the past 20 years, bond yields haven’t gotten the pensions anywhere close to 7%. So increasingly they have invested in stocks and alternative investments like private equity, as this chart shows:

Source: Pew Institute

And venture capital fundraising, in large part from pension funds, has soared since the pandemic…

How many great new ideas are out there for venture capitalists to invest in? [Obviously, not an unlimited number]. So their investments are by necessity getting riskier. But if the pension funds back away from the growing risk, they have to admit they can’t earn that 7%. Then bad things happen, to retirees and to pension plan sponsors and then to pension fund managers. So pension fund managers are pretty much addicted to chasing bubbles.

The relatively poor. The “absolutely poor” have income below defined poverty levels. The “relatively poor” feel that they should be doing better, because their friends are, or their parents did, or because the Kardashians are, or whatever. Their current income and prospects just aren’t getting them to the lifestyle they aspire to. [Gordon provides example of folks chasing meme stocks and crypto, and getting burned]. …But can the relatively poor just walk away from chasing bubbles? Not without giving up dreams of better lifestyles.

THE BUBBLE FEEDERS

Bubbles don’t just spontaneously occur; they require skilled hands to shape them. And those skilled hands profit handsomely from their creations. Who are these feeders?

Private equity and venture fund managers. They typically earn a 2% management fee plus 20% of profits earned. That adds up fast. A $10 billion venture fund could easily generate $400 million a year in income, spread among a pretty small group of people. VC News lists 14 venture capitalists who are billionaires.

SPAC sponsors. [ A SPAC (Special Purpose Acquisition Company) is a shell corporations which raises money through stock offerings, for the purpose of going out and buying some existing company. SPAC sponsors make a bundle, and so are motivated to promote them. SPACs proliferated in 2020-2021, and for a while pumped money into acquiring various small-medium “growth” companies. But now it is clear that there are not a lot of great underpriced companies out there for SPACs to buy, so SPACs are fizzling]

Wall Street earns fees from (A) raising funds for private equity, venture capital and SPACs, (B) buying and selling companies, (C) trading bubble stocks, crypto, etc., and (D) other stuff I’m not thinking of right now.

The Federal Reserve. Part of the Federal Reserve’s mandate is to reduce unemployment. Lowering interest rates increases stock values, which creates wealth, which drives the “wealth effect”. The wealth effect is the estimate that households increase their spending by about 3% as their wealth increases. More spending increases GDP, which reduces unemployment, which makes the Fed happy, and politicians happy with the Fed.

In my view, the wealth effect is why the supposed economic geniuses at the Fed never figure out that bubbles are occurring, so they never take steps to minimize them.

Social media and CNBC certainly benefit from more viewers while bubbles are blowing up [i.e., inflating].

INVESTING IN CURRENT MARKET ENVIRONMENT

Gordon sees us still in recovery from the recent bubble of “disruptor companies” and crypto, and so the market may have more than the usual choppiness in the next year. So he advises being nimble to trade in and out, and not mindlessly commit to being either long or short. “Value stocks are probably the best near-term bet, even if they can’t offer the adrenaline jolt offered by bubble stocks.”

On the paucity of new ideas and the paradox of choice in modern research

I was once told that papers are never finished, only surrendered. It’s one of those turns of phrase who’s observational accuracy has only increased. I don’t know that I’ve felt good about submitting a paper for review in over a decade, and that includes the one’s that were accepted and subsequently published.

When I submitted papers early in my career I felt great. There was both a sense of accomplishment and eagerness to learn what the reviewers might think, a hopeful optimism. That eagerness didn’t reflect overwhelming confidence so much as naivete as to what the review process entailed. Now I know too much.

What I know, what I always know, is that more could be done. More alternative empirical specifications could be added to the robustness section. Newer models could be considered for the underlying mechanism. Older models too. Different literatures could be engaged and contended with. Summary statistics could be visualized. Specifications could be bootstrapped, a different identification stratgy used. I never applied for administrative data in Denmark. Wait, they don’t have this policy in Denmark. I could have tried Sweden. Or Dallas. Wasn’t there a close election in Baltimore in 1994?

This isn’t a rant or lament about the journal reviewing process. For every petty or uninformed referee report I’ve received in my career I’ve received three that were entirely fair and one that was so good the reviewer deserved to go in the acknowledgements of future drafts. This is more a reflection on a trap born of our own knowledge and imaginations.

There are so many tools at our disposal, so many data sets, so many options that I worry that we are collectively succumbing to a paradox of choice. The paradox of choice, for those who do not recall, was a theory that suggested that the number of options facing consumers was net lowering their utility because of the search and decisionmaking costs those options entailed. I think this theory is deeply wrong, but I am also going to be incredibly unfair to it here and simply dismiss it out of hand as a consumer theory. Instead, I want to consider a more collective application to the modern social scientific enterprise.

Every research paper is an attempt to contribute new ideas and refine old ones. There is occasional handwringing over the paucity of new ideas in economic research and the abandonment of broad swaths of traditionally difficult economic subjects. Explanations for these pathologies tend to be more sociological than economic in construct, invoking political preferences or mood affiliation. Others focus on the institutions of academic research, specifically faculty hiring and tenure. I’d like to add the paradox of choice to the mix.

There are countless methodological, theoretical, and rhetorical choices that can be made that will result in nearly identical research contributions. If your aim is to contribute a wholly new idea, then every one of those choices comes with the opportunity cost of the countless alternatives. If, on the other hand, your contribution is a refinement of a pre-existing idea in an already rich vein of research, then the choices you made are the contribution. For refinements, the choices made are a reason to recommend acceptance of your paper. For newer, more original contributions, your choices can be more easily framed as reasons to reject it. A more cynical academic might fear that the more original the contribution, the more likely the referee is to succumb to the Nirvana fallacy, disapproving of your paper’s choices relative to an imagined paper more perfectly in line with the choices the referee would have made if they had thought of the idea.

Now consider these two mechanisms in parallel for a young researcher. Not a wonderkid that faculties on other continents are already talking about. Consider an above average newly minted PhD from a top 25 economics department. They are executing their first research project since accepting a tenure track position, a defined question with explicit policy relevance. There are dozens of data sets they could pursue, hundreds they could build, and a countless number they could imagine feasibly existing. They could pick a workhorse model or contruct an entirely new pathway forward from dozens of building blocks. There are 3-4 “hot” identification strategies in their field, but they could also consider something off the beaten path.

Research projects aren’t binary constructs, “new” or “refining contributions”, but it’s not unreasonable to place their contributions on a spectrum of “entirely new” (i.e. Newtonian physics) to “marginal refinement” (i.e. weakening the asssumptions in a minor mathematical proof). From the start, our new faculty member will observe the inherent riskiness of overdifferentiating from the field, turning every choice into a reason referees might reject their paper. This will push them down the spectrum towards marginal refinements. Then they will start the iterative process of executing and writing up their research.

As they execute their analysis they will see the forking paths of alternative choices. Different specifications will be added to robustness tables. Alternative models will merit their own appendix. They will begin to write defensively, trying to anticipate and refute arguments from their mental model of a reviewer. They will try to divert an imagined conversation away from the conclusion that the choices made in the paper are wrong. The risk of newness only becomes starker. There must be, and remains, the contribution in the paper, but it will become narrower, buttressed on all sides by the rising masonry of appendices and references, it’s only weakness the narrow channel through which its contribution is made. This iterative process will continue until the opportunity cost of time not spent on their next project forces the unconditional surrender of their paper to that still unvanquished tyrant, diminishing returns.

All of this is weighing on young faculty shoulders. A million choices to be made, a million reasons to be rejected. So what do you do? You find your tribe. A tribe not based in the schools of thought that dominated the 1970’s but in the schools of methodological choices. This is how we estimate gravity models of trade. This is how we estimate monopsony rents. This is how we model the impact of the minimum wage on employment. If you want to be cynical, there are no doubt similar tribes of policy outcomes, but I don’t think those are what haunt the face-on-desk stress dreams of assistant professors working on a Sunday night.

We can get more new ideas the same way we can get bolder, more enthusiastic young researchers. Not by reducing their choices, but by lowering the price of those choices. Easier said than done, and maybe I’ll write up some thoughts on how lower the prices of researcher choices, but the first step is likely cultural i.e. I have no idea how to pull it off. The most important step may simply be reorienting how we read papers, shifting the focus from “What did the authors do right or wrong?” to “What do we learn from this?”

New Survey on Bootcamp Graduates

I have been investigating how to get more talent in the tech industry for a while. There is not a lot of data on precisely how people select into tech and what might cause more people to train for in-demand jobs. Gordon Macrae, in his substack The View, has a recent relevant post Issue #9: Tracking 100 bootcamp graduates from 2015.

Gordon ran his own survey of 100 graduates of coding bootcamps. Coding bootcamps are a fascinating element that help fill in the skills gap. They are not well-understood, and we don’t have much publicly available data of the sort that helps researchers measure the outcomes of a traditional college education.

Here are some of his results from this preliminary survey:

Of this total, 68% of the graduates surveyed in 2022 were doing roles where the bootcamp was necessary for them to work in that role. What I found fascinating, though, was that this figure varied wildly depending on the bootcamp they attended. 

On the lowest end, just 50% of graduates from Bootcamp A were doing jobs in 2022 that required having gone to a bootcamp. Conversely, 90% of Bootcamp D graduates were working in technical roles seven years after graduating.

What is more, the percentage of bootcamp graduates in technical roles at 7 years after graduation has gone done by 15%. The average immediately after graduation was 82% working in a technical role. 

Other resources:

There is more work to be done in this area.

House Rich – House Poor

Last week I presented a graphic that illustrates the changing average price of homes by state. This week, I want to illustrate something that is more relevant to affordability. FRED provides data on both median salary and average home prices by state. That means that we can create an affordability index. Consider the equation for nominal growth where i is the percent change in median salary (s), π is the percent change in home price (p), and r is the real percent change in the amount of the average home that the median salary can purchase (h).

(1+i)=(1+π)(1+r)

Indexing the home price and salary to 1 and substituting each the percent change equation (New/Old – 1) into each percent change variable allows us to solve for the current quantity of average housing that can be afforded with the median salary relative to the base period:

h=s/p-1

If h>0, then more of the average house can be purchased by the median salary – let’s vaguely call this housing affordability. Both series are available annually since 1984 through 2021 for all 50 states and the District of Columbia. The map below illustrates affordability across states. Blue reflects less affordable housing and green reflects more affordable housing since 1984.

Continue reading

Highlights from ASSA 2023

I expected the meetings would shrink, but I was still surprised by how much they did:

That said, I mostly didn’t notice the smaller numbers on the ground, because most of the missing people are those on the job market, who used to spend most of their time shut away doing interviews anyway. There was still a huge variety of sessions and most seemed well-attended. ASSAs is also still unparalleled for pulling in top names to give talks; I got to talk to Nobel laureate Roger Myerson at a reception. But there may be a trend of the big names being more likely to stay remote:

The big problem with attendance falling to 6k is that they’ve planned years worth of meetings with the assumption of 12k+ attendance. Getting one year further from Covid and dropping mask and vaccine mandates might help some, but the core issue is that 1st-round job interviews have gone remote and aren’t coming back. The best solution I can think of is raising the acceptance rate for papers, which in recent history has been well under 20%.

In terms of the actual economic research, two sessions stood out to me:

How many factors are there in the stock market? Classic work by Fama and French argues for 3 (size, value, and market risk), but the finance literature as a whole has identified a “zoo” of over 500. Two papers presented one after the other at ASSA argued for two extremes. “Time Series Variation in the Factor Zoo” argues that the number of factors varies over time, but is quite high, typically over 20 and sometimes over 100:

In contrast, “Three Common Factors” argues that there really are just 3 factors, though they are latent and not the same as the Fama-French 3 factors. In this case, the whole zoo of factors in the literature is mostly non-robust results driven by p-hacking and a desire to find more factors (fortune and fame potentially await those who do). Overall these asset pricing papers make me want to look into all this myself; when reading them I’m always struck by an odd mix of reactions- “I don’t understand that”, “why would you do it that way, it seems wrong and unnecessarily complicated”, and “why didn’t the field settle such a seemingly basic question decades ago?”.

Hayek: A Life this session covered the new book by Bruce Caldwell (who taught me much of what I know of the history of economic thought) and Hansjoerg Klausinger. Discussants Emily Skarbek and Stephen Durlauf agreed it is surprisingly readable for a long work of original scholarship, calling it a beautifully written 800p pageturner. Vernon Smith asked Caldwell if Hayek read the Theory of Moral Sentiments. Caldwell: “he cited it.” Smith: “but did he read it? Seems like he didn’t understand it very well.” Caldwell agreed he may not have, or if he did it was a German translation.

Vernon Smith’s own talk featured great comments on market instability: instability in markets comes from retrading. Markets are stable when consumers just value goods for their use, like haircuts and hamburgers. The craziness and potential for bubbles and crashes comes in when people are thinking about reselling something, whether it be tulips, stocks, houses, or crypto.

I asked Bruce Caldwell at a reception how he was able to finish writing such a big book that involved lots of archival work and original research. He said “one chapter at a time”, and noted that its fine to write the easiest chapters first to get the ball rolling.

Overall, while ASSA is diminished from the pre-Covid days and I often disagree with the AEAs decisions, its still a top-tier conference, especially when in New Orleans.

The Decline of Working Hours, in the Long Run and Recently

If you look at the long-run trends in labor markets, one of the most obvious changes is the decline in working hours. The chart from Our World in Data shows the long-run trend for some countries going back to 1870.

Hours of work declined in the US by 43% since 1870. In some countries like Germany, they fell a lot more (59%). But the decline was substantial across the board. One thing to notice in the chart above is that for the very recent years, the US is somewhat of an outlier in two ways. First, there hasn’t been much further decline after about the mid-20th century. Second, average hours of work in the US are quite a bit higher than many of developed countries (though similar to Australia).

But the labor market in the US (and in other countries) is in a very unusual spot at the present moment after the pandemic. So what has happened really recently. Many economists are looking into this question of hours and other questions about the labor market, and a new working paper titled “Where Are the Workers? From Great Resignation to Quiet Quitting” presents a lot of fascinating data about the current state of work in the US. The paper is short (just 14 pages) and readable for non-experts, so I encourage you to read it all yourself.

Here is one table and one chart from the paper that I will highlight, which shows that hours of work have been falling, but in a very specific set of workers: those who work lots of hours, and those with high incomes. For workers at the high end of hours worked, the 90th percentile, they have dropped from 50 hours to 45 hours of work per week just from 2019 to 2022. But workers at the median? Unchanged at 40 hours per week. (The data comes from the CPS.)

The figure below is only for male workers, and it shows a similar decline in hours worked for those at the high end of the earnings distribution. For those at the bottom, hours of work at mostly unchanged.

Bank for International Settlements: $70 Trillion Dollars Is Missing from Official Global Financial Accounting

Seventy trillion dollars is a lot of money. It is nearly three times the size of the U.S. GDP, and approaches total global GDP (around $100 trillion). That is the amount of funds that are missing from normally reported financial statistics, according to a December, 2022 report from the Bank for International Settlements. That report caused a bit of a flurry in financial circles.

It’s not that this money has been stolen, it’s just that it is not publicly known exactly where it is, i.e., how much money that which parties owe to whom. Here is the Abstract of this paper:

FX swaps, forwards and currency swaps create forward dollar payment obligations that do not appear on balance sheets and are missing in standard debt statistics. Non-banks outside the United States owe as much as $25 trillion in such missing debt, up from $17 trillion in 2016. NonUS banks owe upwards of $35 trillion. Much of this debt is very short-term and the resulting rollover needs make for dollar funding squeezes. Policy responses to such squeezes include central bank swap lines that are set in a fog, with little information about the geographic distribution of the missing debt.

Much of this money is in the form of currency swaps, especially foreign exchange (FX) swaps. Even though the U.S. economy no longer dominates the whole world, the U.S. dollar remains the premier basis for international trade and even more for foreign exchange:

As a vehicle currency, the US dollar is on one side of 88% of outstanding positions – or $85 trillion. An investor or bank wanting to do an FX swap from, say, Swiss francs into Polish zloty would swap francs for dollars and then dollars for zloty.

Who cares? Well, the incessant demand for dollars periodically leads to a dollar funding squeeze in international trade, which in turn reverberates into world GDP.

Currency Swaps as Lending Events

In many cases these currency swaps effectively amount to short-term lending /borrowing (of dollars). Much of the financial world is utterly dependent on smoothly flowing short-term funding to cover longer term debt or investments. Borrowing short-term (at usually lower interest rates) and investing or lending out longer-term (at higher rates) is how many institutions and funds exist. For instance, depositors at banks effectively lend their deposits to the bank (short-term), in return for some pitiful little interest on their checking or savings accounts, while the banks turn around and make say 5 year or 30-year loans to businesses or home-buyers. Banks earn profits on the spread between the interest rates they receive on the funds they loan out, and the typically lower rates on the short term funds they “borrow” from their depositors.

This “mismatch” between the maturities of borrowed funds (especially dollars) and invested funds can cause a complete melt-down of the financial system if holders of dollars stop being willing to lend them out, or to lend them out at less than ruinous interest rates:

The very short maturity of the typical FX swap/forward creates potential for liquidity squeezes. Almost four fifths of outstanding amounts at end-June 2022 in Graph 1.B matured in less than one year. Data from the April 2022 Triennial Survey show not only that instruments maturing within a week accounted for some 70% of FX swaps turnover, but also that those maturing overnight accounted for more than 30%. When dollar lenders step back from the FX swap market, the squeeze follows immediately.

Financial customers dominate non-financial firms in the use of FX swaps/forwards. Non-bank financial institutions (NBFIs), proxied by “other financial institutions” in Graph 1.C, are the biggest users of FX swaps, deploying them to fund and hedge portfolios as well as take positions. Despite their long-term foreign currency assets, the likes of Dutch pension funds or Japanese life insurers roll over swaps every month or quarter, running a maturity mismatch.  For their part, dealers’ non-financial customers such as exporters and importers use FX forwards to hedge trade-related payments and receipts, half of which are dollar-invoiced. And corporations of all types use longer-term currency swaps to hedge their own foreign currency bond liabilities .

It is really bad if pension funds or insurance companies get starved of needed ongoing funding. Central banks, especially the dollar-rich Fed, have had to repeatedly jump in and spray dollar liquidity in all directions to mitigate these “dollar squeezes”.  The BIS authors’ main concern is that these big public policy decisions are currently made in absence of data on what the actual needs and issues are.  Hence, “Policy responses to such squeezes include central bank swap lines that are set in a fog.”

This all is part of the murky “Eurodollar” universe of dollar-denominated bank deposits circulating outside the U.S. (more on this some other time).  Investing adviser Jeffery Snider offers the “Eurodollar University” on podcasts and on YouTube, in which he explores the many dimensions of the Eurodollar scene. He likens the Eurodollar system to a black hole: we cannot observe it directly, but we can estimate its size by its effects.

In his YouTube talk on this BIS paper, among other things Snider notes that this short-term lending associated with currency swaps functions much like repo borrowing, except the currency swaps (unlike repo) do not appear on bank or other balance sheets as assets/liabilities. That is part of the attraction of these swaps, since they are effectively invisible to regulators and are not constrained by e.g., capital requirements.

What the Fed does in a dollar squeeze is largely lend dollars to large dealer banks. But unless those other banks then lend those dollars out into the private marketplace of manufacturers and shippers and pension funds, having trillions of dollars in central bank reserves has little effect. It is not the case that “the Fed floods the world with dollars”  — actually, mainstream banks get those dollars, and then lend out at high rates to the dollar-starved rest of financial world, where they can actually do something.

The result, according to Snider, is that the Eurodollar is the only functional reserve currency in existence. This is the real, effective banking system (not “reserves” sitting on some bank’s balance sheet), even though the current accounting system doesn’t show it.

On Costco, Defector Media, and the Illusion of -Isms

I’m fond of telling my wife that most people wouldn’t call us rich, but sometimes Costco makes me feel like I am. By the standards of the past, including both of our upbringings, the goods that our Costco membership makes accessible to us is something that never ceases to amaze. I’ll look at our cart some months and find myself astonished at the goods we are about to casually purchase. It really goes to show you how far solidarity can take you within a proper union.

Sure, its probably better described as a consumer’s union, but the principles are largely the same and the value of the outcome is undeniable. Consumers rarely find themselves with significant bargaining power. Its not terribly problematic most of the time – competition pulls prices towards a market clearing level and everyone walks away sufficiently happy. But the fact remains that bits get taken out here and there. The world is full of little price markups where markets get thin, where consumers face a tradeoff – either pay the premium of shallower local tributaries or swim back to the well-populated seas of the median consumer.

What Costco offers is a memberhip in their union. Pay your dues and let us bargain on your behalf. The solidarity of your consumer dollars will grant you leverage like you will rarely experience in your consumer life. It’s not a democratic union, but you can costlessly exit at any time, which is more than I can say about every democratic people’s republic. You can only count on the incentive of retaining your membership to motivate your buying representatives, but that as it turns out is a $28 billion incentive. They serve their members through two purchasing streams: massive amounts of the stuff nearly everyone buys (produce, milk, eggs, chicken, etc) and a rotation of goods each of which maybe only 1 to 2% of their members buy. Those goods are the real miracle, the stuff that where markets would be so thin that a member might find their buyers union negotiating 30 to 50% lower prices. Most of the goods on any day don’t match their needs but over the course of the year are fundamentally changing the standard of living for a household.

Costco is a miracle of socialism. We can only hope they will be ruthlesslessly copied in other channels of our consumer lives.

My favorite sports blog was Deadspin. Sure, it was filled with some sophmoric politics, but it was also the most reliably uncompromised takes on sports that were available. Then it got bought out. Their corporate overlords tried to reign them and their union in, but it all fell apart, culminating in a massive staff walkout. In a moment of shining glory, several of the former staffers and editors decided to take the plunge and start their own site as a subscription based enterprise.

They organized their structure as a partnership, based in both a more democratic ownership structure and a committment to making their simple enterprise one built to serve their writers. Not quite a workers cooperative, but not a component of a broader media company either. If anything, it’s structure probably more closely resembles a medium sized legal or accounting partnership (I don’t actually know, I’m just speculating based on tidbits from stories and podcast discussions including some of their writers).

They wrangled together a team of talented, often incredibly talented writers. Does some third-year college English major politics creep through the writing sometimes? Sure, but if that’s too much of a burden you should probably just go ahead stop reading anything, in any medium, on any internet, ever again. Do I think the economics of some of their very best writers to be absolutely silly? Yes again, but I actually find it a healthy reminder that incredibly smart people can be incredibly wrong about things outside (or inside) of their expertise. I would do well to remember this myself.

What they do have, however, is Ray Ratto, who’s voice of crushing condescension I hear in my head whenever I watch someone do something obviously stupid with the well-lubricated confidence of a professional sports person. They have David Roth, whose casual vocabulary of metaphor is unmatched in my life. They have a score of writers who are confident they don’t just have to chase down every scandal around the next catfished college player or the indiscreet unsolicited selfies sent by future embezzlers. They can just do their job and be confident that it is what their subscribers are paying them to do. It also means that freelancers and intermitter writers can work for Defector and know that the paycheck will reflect the market rate for competence and not the market rate for new college grads living at home and telling their parents the real pay was the exposure.

Defector can do all of this for their partners and employees because they have cut out the media middlemen without having to give up the scale of each going independent on Substack. They have essentially found a way to pull off the dream of every failed new magazine of the 90s – they made their own thing and found customers to pay them for it. They leveraged the internet in all the ways we hoped, unburdened with phystical printing, untethered to a single regional labor pool, and unbeholden to corporate ownership whose revenue ambitions could never be aligned with the best way to serve the employees and the readers those employees actually want to serve.

Defector media is a miracle of capitalist entrepreneurship. We can only hope they will be ruthlesslessly plagiarized in dozens of other media subjects.

Which of course brings it back to one of my favorite hobby horses. Capitalism and socialism are no longer a useful dichotomy, if they ever were. It’s all just competition, there are always prices. The only things that change are the currencies and the rules. Sometimes you bargain with dollars and contracts. Sometimes with favors, promises, and threats. Sometimes power comes from resources, other times from which end of the sword you’re holding. Unions, cooperatives, corporations. They are all just different ways of organizing, of solving a collective action problem. The rewards to organized solidarity can be enjoyed by anyone, whether it’s members of a private buyers club or electricians in a federated union. The fruits of entrepreneurship, of producing a good in an innovative way that better connects producers of sports content to the consumers of that content, will always be available to those willing to take a risk in a competitive marketplace.

To be clear, Costco doesn’t solve the externalities of wide varieties of consumption any more than Defector Media will cure inequalities of wealth. They don’t offer miracle cures. What they offer is steps taken towards a better world that don’t conveniently align with the typical political allegiances and policy mascots of a middle class suburban consumer or Brooklyn-based blogger. Because they’re not politics. They’re something that actually has to work.