A chart showing the average income by major was recently making the rounds on social media. So, I tried to replicate it. It turned out that some of the college majors were omitted. That part actually makes sense. The 2024 American Community Survey includes 174 degree fields – which is way too many for a clearly labeled bar chart. So, for local advertisement, I used only the majors and their equivalents that are offered at my university. That chart is below (unweighted).
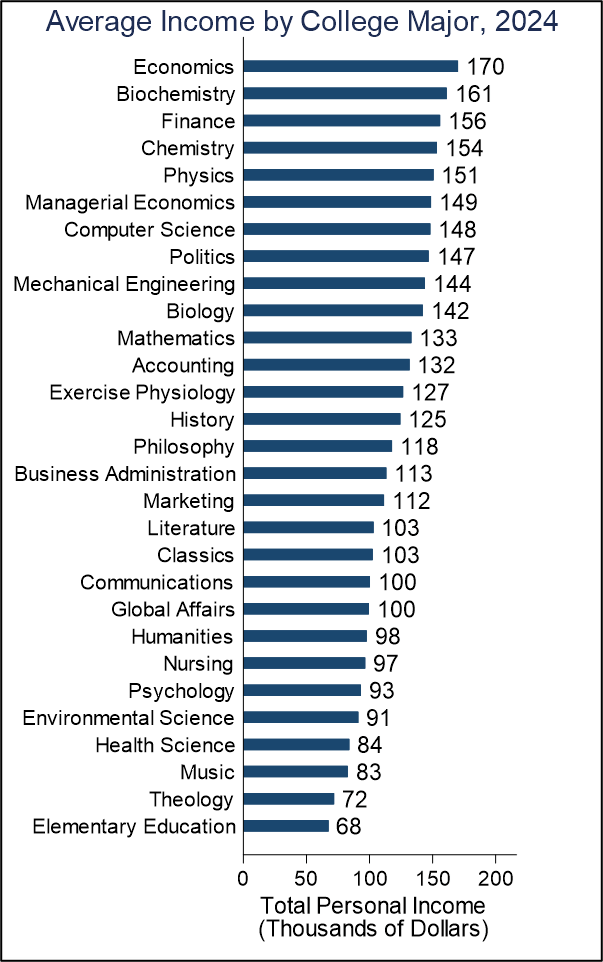
These are just raw average earnings by college major for employed adults. They all have decent sample sizes. Below is the cumulate distribution of sample size for each major. The smallest sample size is 45 (Military Technologies) and only 3% have sample sizes below 100. Only 34% have sample sizes below 1k.
You better believe that my colleagues and I show this chart to every single one of our classes. Obviously, it’s truncated from the full 174 majors, but it’s the relevant chart for us. If we use the full sample of college majors, Economics ($170k) drops to 3rd highest income, behind “Petroleum Engineering” ($173k) and “Health and Medical Preparatory Programs” ($183k). To be perfectly honest, those latter two sound a lot more difficult and have surprisingly little pay bump in compensation. Being more difficult is also consistent with the smaller sample size Economics=13k, Petroleum Engineering=343, and Health and Medical Preparatory Programs=1,099.
One challenge that I’ve heard about the chart is that top business schools, such as Wharton, have Economics majors and various business concentrations. So, those top performing financiers are getting categorized as Economics in a way that is a bit misleading to young students elsewhere who are trying to decide on a major. If that’s true, then we should see Economics drop in the rankings if we omit the top-most earners. After all, the criticism is that they’re pulling up the average.
Since we can’t tell who in the data went to the top business schools, I’m reticent to make just chop off the top tail of the distribution. The more general point is how skewed the income is within each major. Is Economics unique in having few very high earners? Below is a scatter plot of total income skewness vs the mean by major. We can clearly see two things. 1) Higher average incomes are associated with *less* skewness – not more. 2) Economics is among that higher earning and lower skewed group. Therefore, not only is the average income for economists high, that higher income is more accessible to a high proportion of those degree holders,
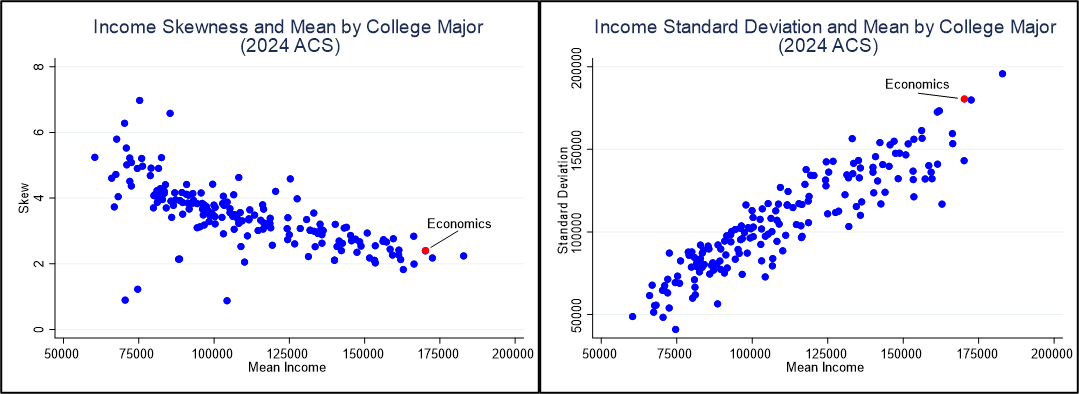
As I tell my students, higher incomes are not just for selfish materialists. Higher real incomes mean that you have more options. You can afford higher quality everything. You can also afford therapy and various medical treatments that are typically considered helpful, but elective. And of course, you can also choose to stay home or to work less. That’s what we see in the above two graphs. The average income for economists is high, the skew is low, and the standard deviation is also high. A Higher standard deviation is exactly what we would expect when people have choices about their compensation! Being more productive gives one the ability to choose lower income, if it means more time with family, or time for other pursuits. That’s the story that I see in these charts. Economics is an awesome major without all of the beneficial income characteristics. But those sure don’t hurt.


It’d be better if these were subgrouped by College. For example, The College of Liberal Arts at UT Austin houses Economics (and doesn’t separately distinguish Managerial Economics as a major)within the College of Liberal Arts, while Finance is within the McCombs School of Business.
The CoLA also houses many others on this list, while the College of Natural Sciences is the home of Chemistry (including Biochemistry), Biology, Physics, Computer Science, Mathematics, etc.
in my experience, the “College” which houses your degree program is every bit as important as the degree program itself.
LikeLiked by 1 person
That sounds very sensible! Though, we can tell from the scatter plot that the skewness for Econ is pretty low. So, whatever the causes of the highest earners (schools, colleges, program, etc), it’s not the primary driver of the high average. Alas, ACS doesn’t provide the specifics for a lot of the education variables. Also, these are raw averages, so all of the typical caveats apply (selection, covariates, etc).
LikeLike
Bachelor’s, Master’s,or Doctorate?
LikeLike
bachelor’s!
LikeLike
These all seem high… is it not household income?
LikeLike
But then they aren’t high enough to be household… I get $142k as unweighted mean total personal income for economics majors in the 2024 ACS https://sda.usa.ipums.org/sdaweb/analysis/exec?formid=mnf&sdaprog=means&dataset=us2024a&sec508=false&dep=inctot&row=degfieldd&weightlist=%23%23none&main=means&transform=none&percentileopt=none&cflevel=95&wncases=on&color=on&ch_type=bar&ch_color=yes&ch_width=600&ch_height=400&ch_orientation=vertical&ch_effects=use2D&decmeans=2&dectotals=0&decdiffs=1&decmedian=2&decse=1&decsd=1&decminmax=2&decwn=1&deczstats=2&csvformat=no&csvfilename=means.csv
LikeLiked by 1 person
Correct not household. Haha – you made me sweat for a moment! My numbers are conditional on employment and ages 18-135 (unweighted).
It does seem that older economists make a lot of money. Maybe it’s all that early saving and S&P growth contributing to a comfortable retirement (my ‘data’ computer is in the office).
https://sda.usa.ipums.org/sdaweb/analysis/exec?formid=mnf&sdaprog=means&dataset=us2024a&sec508=false&dep=inctot&row=degfieldd&filters=empstat%281%29%2Cage%2818-135%29&weightlist=%23%23none&main=means&transform=none&percentileopt=none&cflevel=95&wncases=on&color=on&ch_type=bar&ch_color=yes&ch_width=600&ch_height=400&ch_orientation=vertical&ch_effects=use2D&decmeans=2&dectotals=0&decdiffs=1&decmedian=2&decse=1&decsd=1&decminmax=2&decwn=1&deczstats=2&csvformat=no&csvfilename=means.csv
LikeLiked by 1 person
Ah, conditional on employment would do it
LikeLike