Working Hard for the Money

40 hours. That’s what we think of as a typical workweek. 8 hours per day. 5 days per week. Perhaps the widespread practice of working from home during the pandemic (as well as the abnormal schedule changes for those unable to work from home), has led some to rethink the nature of the workweek. But the truth is that the workweek has always been evolving.

Take this chart, for example. It comes from Our World in Data (be sure to read their excellent related essay as well), and the historical data comes from a paper by Huberman and Minns. I’ve singled out 4 countries, but you can add others at the OWiD link.

The historical declines are dramatic. This is especially true in Sweden. The average Swedish worker labored for over 3,400 hours per year in 1870. Today, that’s down to 1,600 hours. In other words, the typical Swede works less than half as many hours as her historical counterpart. Wow! The decline for the US is not quite as dramatic, but still astonishing: a US worker today labors for only about 57% of the hours of his 1870 predecessor.

It’s tempting to focus on the differences across countries today: the average worker in the US works about 250 hours more than the average French worker. That’s 6 weeks of vacation! And as recently as 1980, the US and France were roughly equal on this measure. We might also wonder why these historical changes happened. For a very brief introduction to the research, I recommend the last section of this essay by Robert Whaples.

But still, the historical declines are dramatic, even if we in the US haven’t seen much improvement in the past generation (and those poor Swedes, working 100 hours per year more than 40 years ago).

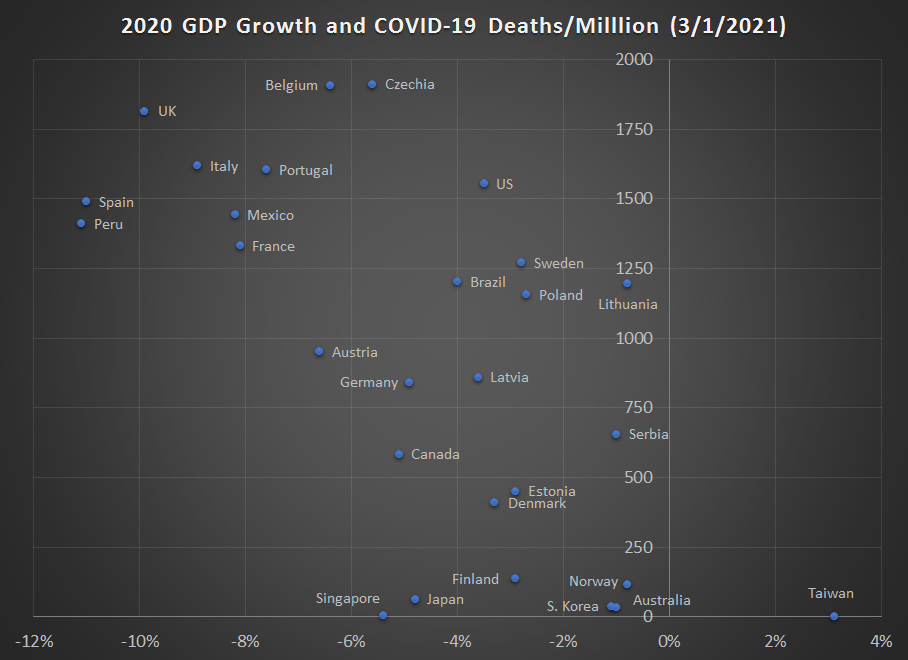
I think another natural question to ask is whether GDP data is distorted, at least as a measure of well being, given these differences in working hours. The answer is partially. Let’s look at the data!

Continue reading

The Luck (?) of the Irish

Poor Ireland. Long oppressed by the Brits. Losing 25% of their population in the Great Famine due to both deaths and emigration. Today, there are possibly 10 times as many Irish Americans as there are residents of Ireland. There are as many Irish Canadians as there are residents of Ireland.

Poor Ireland.

And indeed, Ireland used to be literally very poor, at least in an economic sense. In 1960, their GDP per capita was about half of the United Kingdom. As recently as 1990, they were still only at about 70% of the United Kingdom and the rest of Western Europe. That’s all according to the latest Maddison database figures, which are probably as close to accurate as we can find. But after 1990, we probably shouldn’t use those figures, for reasons peculiar to Ireland.

Today? Ireland is much wealthier. But how much wealthier? It’s tricky. Ireland’s GDP is inflated significantly due to a lot of foreign investment. And possibly some tax evasion/avoidance. You see, Ireland is a tax haven. It has one of the lowest corporate tax rates in the world. That means we have to interpret the data with care, but only because it is such a great place to invest.

Continue reading

Dow 1,000,000?

While the Dow Jones Industrial Average is one of the most widely quoted stock market indexes, it is well known to have many shortcomings. Specifically, it is price weighted (most indexes are value weighted), and that the 30 companies included are arbitrarily chosen.

But there’s an even bigger problem: it excludes dividends. This doesn’t matter much day-to-day, but it does matter a lot in the long run.

A new working paper, “Replicating the Dow Jones Industrial Average,” looks at both of these problems. First, they find that while price-weighting is weird, it doesn’t matter much. Also, if you just used the 30 largest companies in the US, rather than the 30 that are somewhat arbitrarily included, the return doesn’t change much. Either way, you get an average annual return of between 6.5% and 7.0% over the period 1929-2019. The DJIA is indeed a weird index, but that doesn’t seem to matter.

But the exclusion of dividends (and their reinvestment) is a massive problem over the long run. The authors find that the DJIA would have finished 2019 at a value over 1 million (specifically: 1,113,047) if dividend reinvestments were included (referred to as the “total return” index) rather than the 28,538 that it actually closed at. In other words, the average annual return of the DJIA from 1929-2019 was 11% rather than 7% (these are nominal returns, not inflation-adjusted).

If you know anything about compound growth, this is huge! At 11%, an investment will double roughly every 6 years rather than roughly every 10 years at 7% (using the rule of 70, or more precisely the rule of the natural log of 2). Over a 90 year period, that means the investment will be worth 40 times as much. Even using a log scale, as the chart here does, the dramatic difference is clear when you include dividends.

Economists can’t offer too much in the way of investment advice, other than: get your money into an index fund! Now!

GDP Growth in 2020

Last year was a historically bad year for many reasons, but to economists that badness is most visible in our widest measure of the economy: Gross Domestic Product. All issues with GDP aside, especially as a perfect measure of relative living standards, the annual real (inflation-adjusted) growth rate of GDP gives us a good picture of how much national economies were harmed by the pandemic, private behavior changes, and government restrictions (disentangling these three effects is hard — I will leave that to the academic journals rather than a blog post).

While GDP is reported with a lag of several months and is subject to revision, many countries have now reported full GDP data for 2020. For those that don’t follow GDP very closely, for a developed country an annual rate of growth of about 2% is pretty normal and respectable. For further context, in the US recent recessions had declines of -2.5% in 2009, -0.1% 1991, and -1.8% in 1982 (the 2001 recession never had an annual decline, only a few quarterly declines). While it is unusual for countries to go more than 10 years without a decline, it does happen. For example, Australia’s last annual decline was in 1991, when it declined -1.3%. But that’s unusual.

This chart shows the 2020 GDP growth rates (mostly negative, with one exception — Taiwan) for 2020 for most countries were I could find data. What this number shows us is the total amount of economic activity in 2020 compared with the total amount of economic activity in 2019 (adjusted for inflation, of course). I believe this is a better measure than others you might see, such as data that compares the level in the 4th quarters of 2020 and 2019 (a country could have had a terrible 2nd quarter but still gotten back close to the prior year level, and a simple Q-over-Q measure would miss that decline). As I did for the 3rd quarter data, this chart also plots the cumulative COVID-19 death rates on the vertical axis.

GDP data comes from government statistical agencies and media reports. COVID-19 death data is from Our World in Data.

What can we learn from this data?

Continue reading

Economic Research on COVID-19

The past 12 months has been dominated by COVID-19, the related recession, the government response, and other matters. But it has not just dominated our lives, it has also dominated new research, including research by economists!

Working papers from the National Bureau of Economic Research are one place to track on-going research by economists. While not all economic research is released as an NBER working paper (there are other series, and some economists just post them on their own website or department page), the volume of NBER papers should tell us something about the trends.

Here’s a chart showing the weekly NBER working papers that are in some way related to COVID-19. The first batch of three papers was released in late February, one long year ago. The second batch of nine papers came one month later. Since then, there have been papers released every single week, with the exception of the week of Christmas.

In total, there have 373 papers released that relate to COVID-19. The peak comes in late May and early June, with 61 papers released in a 4-week period and 21 of those papers coming out on May 25 alone. Since the May-June peak, we’ve seen a slow decline in papers on COVID-19, and we are now at our lowest level, with just 14 papers released in the past 4 weeks.

Continue reading

The Role of Prices in an Emergency, Winter Storm Edition

When natural disasters and other emergencies strike, two things are certain. First, many essential goods will run out of stock at stores. Second, economists will complain that if only prices would rise in response to the increase in demand, shortages could be avoided.

Let’s take the current winter storm passing through much of the center of the nation, importantly including the southern US where both individuals and governments are unprepared for major winter storms. Here is a sign up at Home Depot in Arkansas:

I can verify that many people in Arkansas don’t have snow shovels. I’ve seen folks using dust pans and leaf rakes to try and clear their driveway. This video is a few years old, but I have no doubt that someone in Arkansas right now is strapping a widescreen TV box to their lawn tractor to clear snow.

So why no snow shovels in Arkansas at Home Depot? The common answer: it doesn’t snow much here, so the stores don’t stock many, and then when it does snow everyone rushes out to buy them.

Simple enough, but the economist says: WRONG! The reason Home Depot doesn’t have any snow shovels in Arkansas is because they didn’t raise the price. Why do economists insist on this?

Continue reading

Broad Base, Low Rates: Every US State Fails on Good Sales Tax Principles

In a previous post, I contrasted the income and property taxes, but I left out the other important tax: the retail sales tax. So let’s rectify that omission.

The retail sales tax is like the “Little Engine that Could,” delivering a steady stream of revenue to governments, while mostly staying out of the passionate debates surrounding the income and sales taxes. About 23% of state and local tax revenue comes from general sales taxes in the US, roughly equal to income taxes, and if you include selective sales taxes it’s slightly larger than the property tax share.

But there’s a problem with sales tax. The sales tax “base,” basically the extent of economic activity that the base covers, has been shrinking. A lot. As Jared Walczak has recently written, in just the past 20 years the “breadth” of the sales tax (how much of the potential base it covers) has fallen from about 50% to 30%.

As Walczak also notes, there are seven or so broadly agreed on principles of sales taxes, but I would say there are two primary ones (the first two on his list):

  1. An ideal sales tax is imposed on all final consumption, both goods and services.
  2. An ideal sales tax exempts all intermediate transactions (business inputs) to avoid tax pyramiding.

But US states violate these two principles in various ways, leading to (oddly enough) a tax base that is simultaneously too narrow and too wide. Why is this?

Continue reading

Coase and COVID

Update: I added a comment on the post to clarify why I don’t think that having seniors stay at home is the correct Coasean solution. In short: social isolation has high costs!

Bryan Caplan has an interesting post on COVID and reciprocal externalities. Caplan starts off with the straightforward Coasean statement: “Yes, people who don’t wear masks impose negative externalities on others. But people who insist on masks impose negative externalities, too.”

For those not familiar with Coase’s 1960 article, one of his fundamental insights about property rights is that when property rights are not clearly defined, both parties can be imposing costs on one another. The externalities are reciprocal, not just in one direction. The efficient outcome, when bargaining is not possible, is to allocate the property right such that the “least cost avoider” is the one that adjusts their behavior. In other words, you allocate the property right to the party who would obtain the property right if bargaining were possible.

But Caplan uses this Coasean framework to come to the opposite conclusion that I would. Why?

Continue reading

Minimum Wage vs. EITC: Who Pays?

My co-blogger Mike Makowsky has a great post earlier this week about the minimum wage. Go read it before you read my post. When Mike said he was bothered by the notion that “the welfare state must be channeled through employment,” I very much nodded in agreement. It reminded me of a frustration I have with the entire debate about the minimum wage vs. the Earned Income Tax Credit as policy tools to help out the least well-off in society (yes, some argue they are complements, but let’s put that debate aside for the moment).

Here’s my frustration. In both the popular discussion and occasionally among academics/policy wonks, the difference between the minimum wage and the EITC is often framed this way: employers pay for the minimum wage, but the government pays for the EITC. I know there are important questions about the incidence of the minimum wage, but let’s assume that the proponents of higher minimum wages are correct, and the full cost comes out of business profits.

But the distinction between “employers” and “the government” is not a useful one. Where does the government get its revenue to pay for things like the EITC (or alternatively, food stamps)? They must come from society. There is some diversion of real resources from Group A to Group B. Group A is, in the case of the minimum wage, the owners of businesses — in other words, individuals with high incomes. Group B is the workers. But this is true in the case of both the minimum wage and the EITC!

Continue reading

How Should We Teach Public Goods Theory?

Joshua Hendrickson recently wrote about the provision of public goods, and how we teach public goods in economics. My post today is not so much a reply to Hendrickson, but is inspired by his mediation on public goods as I gear up to teach another semester of Public Finance.

The theory of public goods that economists discuss among themselves is pretty straightforward: when a good is both non-rival and non-excludable, there is a strong case for government intervention of some sort (though not necessarily public provision). The opposite is true when a good is both rival and excludable: there is a strong case for laissez faire.

Seems simple enough, right? But communicating this concept to undergraduates and the general public has been a major challenge. Part of the confusion arises from the term itself, “public good.” Non-economists tend to use the term interchangeably with the notion of “the common good, as is clear from Wikipedia, a dictionary, or a conversation with your grandma. For this reason, I sometimes substitute the awkward phrase “collective consumption good” (this is actually Samuelson’s term in his classic article on the topic), but all the textbooks so use it so I often default to the standard terminology.

From Jonathan Gruber’s Public Finance and Public Policy

But I think there’s a deeper problem than just terminology. Economists have put themselves in a box. Literally. Here’s a standard 2×2 matrix from Jonathan Gruber’s undergraduate public finance textbook. I don’t mean to pick on Gruber here — this is a pretty standard presentation. You can find it in many microeconomics textbooks too, or on Wikipedia. Everything goes in a box! It’s a nice stylized way to think of the terminology. It makes for nice test questions. But here’s the real problem with it as a pedagogical tool: it doesn’t seem to help many students! Or at least, it doesn’t seem to help them retain the knowledge between their micro principles courses and upper division courses (at least in my experience, I’d be happy to hear others chime in here).

So how can we teach this concept better? I have a few ideas. I’d like to hear yours too.

Continue reading