The American Middle Class Has Shrunk Because Families Have Been Moving Up

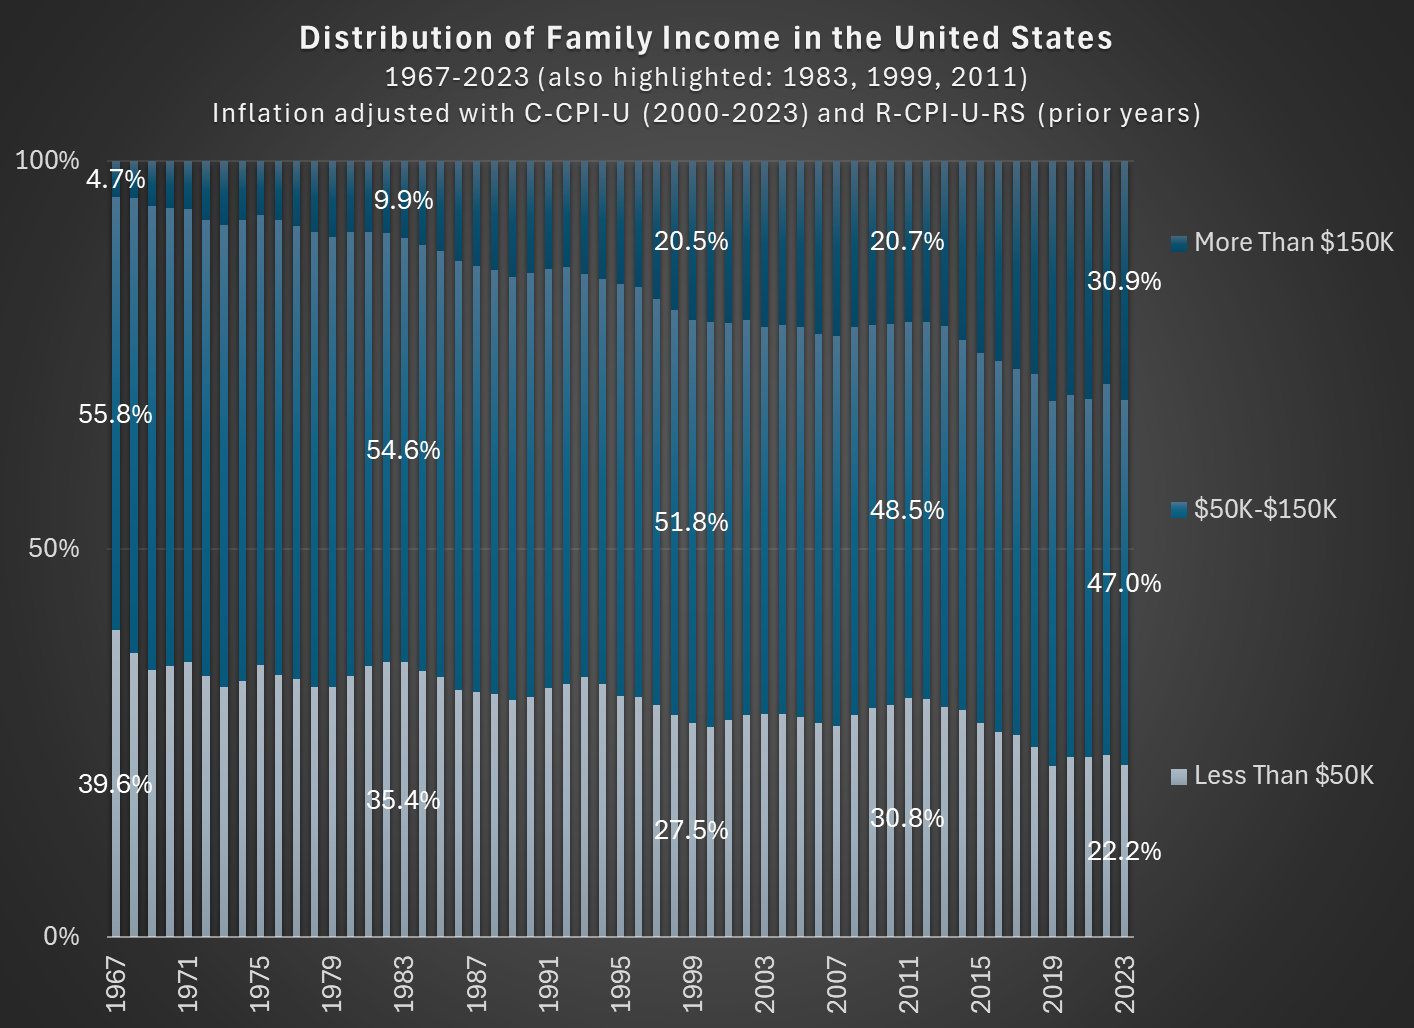
In 1967, about 56 percent of families in the US had incomes between $50,000 and $150,000, stated in 2023 inflation-adjusted dollars. In 2023, that number was down to 47 percent. So the American middle class shrunk, but why? (Note: you can do this analysis with different income thresholds for middle class, but the trends don’t change much.)

The data comes from the Census Bureau, specifically Table F-23 in the Historical Income Tables.

As you can see in the chart, the proportion of families that are in the high-income section, those with over $150,000 of annual income in 2023 dollars, grew from about 5 percent in 1967 to well over 30 percent in the most recent years. And the proportion that were lower income shrunk dramatically, almost being cut in half as a proportion, and perhaps surprisingly there are now more high-income families than low-income families (using these thresholds, which has been true since 2017). The number is even more striking when stated in absolute terms: in 1967 there were only about 2.4 million high-income households, while in 2023 there were 11 times as many — over 26 million.

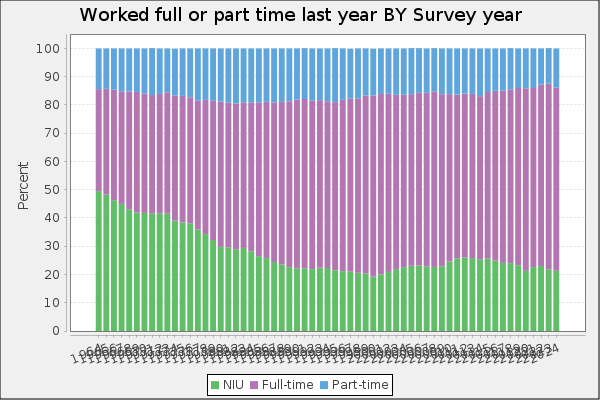
Is this increase in family income caused by the rise of two-income households? To some extent, yes. Women have been gradually shifting their working hours from home production to market work, which will increase measured family income. However, this can’t fully explain the changes. For example, the female employment-population ratio peaked around 1999, then dropped, and now is back to about 1999 levels. Similarly, the proportion of women ages 25-54 working full-time was about 64 percent in 1999, almost exactly the same as 2023 (this chart uses the CPS ASEC, and the years are 1963-2023).

But since the late 1990s, the “moving up” trend has continued, with the proportion of high-income families rising by another 10 percentage points. Both the low-income and middle-income groups fell by about 5 percentage points. Certainly some of the trend in rising family income from the 1960s to the 1990s is due to increasing family participation in the paid workforce, but it can’t explain much since then. Instead, it is rising real incomes and wages for a large part of the workforce.

Government Makes Quasi-Nationalization Deal to Assure Supply of Critical Rare Earths for Defense 

If top government officials were regular readers of this blog, they would have been warned by a headline here more than two years ago, “China To Squeeze West by Restricting Export of Essential Rare Earths “.  For the last few years, the U.S. has been trying to limit Chinese access to the most powerful computing chips, which are largely made by American company Nvidia. But China has some high cards to play in this game. It produces some 90% of refined rare earths and rare earth products like magnets.  These super-powerful neodymium-containing magnets are utterly critical components in all kinds of high-tech products, including wind turbine generators and electric motors for electric vehicles and drones, and miscellaneous military hardware.

It has been painfully obvious at least since 2010, when China put the squeeze on Japan by unofficially slowing rare earth exports to Japan over a territorial dispute, that it was only a matter of time before China played that card again. But the West slumbered on. There is a reasonable amount of rare earth ores that are mined outside China, but nobody wanted to build and operate the expensive and environmentally messy processes to refine the rare earth minerals (carbonates, oxides, phosphates) into the pure metals. Unlike the esoteric and hard-to-imitate processing for cutting edge computing chips, anyone can gear up and start refining rare earth ores. It mainly just takes money, lots and lots of it, to build and operate all the processing equipment for the multiple steps involved*. There was little free market incentive for a Western company to invest in expensive processing, since China could readily bankrupt them by cutting prices as soon as they started up their shiny new process line. Reportedly, the Chinese used this tactic twice before (in 2002 and 2012) to kill nascent refining of the rare earth ores at Mountain Pass mine in California.

As of April of this year, in response to ongoing U.S. export restrictions on chips, China threw its latest rare earth card down on the table, requiring export licenses and imposing other restrictions that throttled rare earth exports. Western manufacturers were soon howling in pain. As of early June:

Global automakers are sounding the alarm on an impending shortage of rare earth magnets as China’s restrictions on the material vital for the automotive, defence and clean energy industries threaten production delays around the world.

German automakers became the latest to warn that China’s export restrictions threaten to shut down production and rattle their local economies, following a similar complaint from an Indian EV maker last week. U.S., Japanese and South Korean automakers warned President Donald Trump on May 9 car factories could close.

The Trump administration quickly caved on chips and in July permitted boatloads of high-end H20 Nvidia chips to ship to China, in return for resumption of rare earth exports from China. Score one for the CCP. As of mid-August, rare earth shipments had climbed back to around half of their pre-May levels, but China ominously warned Western companies against trying to stockpile any reserves of rare earths, or they would “face shortages” in the future.

After this ignominious face-slapping, the administration finally did something that should have been done years ago: they gave an American company a solid financial incentive to buckle down and do the dirty work of refining rare earth ores at large scale. The Defense Department inked a deal with MP Materials Corp, the current operator of the Mountain Pass mine and the modest refining operation there to quickly ramp up production:

The Department of Defense is investing capital in MP across several fronts. This includes a $400 million convertible preferred equity, struck at a fixed conversion price of $30.03. The government gets 10-year MP stock warrants also set for a $30.03 price. As planned, this would get the Department of Defense to about a 15% ownership position in MP Materials. In addition, the Department of Defense will lend MP Materials $150 million at a highly competitive interest rate to help the company expand its heavy rare earth element separation capabilities.

It’s not just a financing deal, however. This arrangement also provides a striking level of influence over pricing and profitability for MP Materials going forward.

For one thing, the Department of Defense will provide a price floor of $110 per kilogram for NdPr. NdPr is a product that is a combination of neodymium and praseodymium. This is a generous floor price…

The Department of Defense’s involvement now gives MP Materials the runway necessary to build what’s being dubbed the 10X magnet manufacturing expansion plant. The Department of Defense is committed to buying the output of this plant with a controlled cost-plus pricing structure. And there will be a profit split with the DoD getting a significant chunk of the upside above certain EBITDA thresholds.

This is being billed as a private-public partnership, but it is akin to nationalization. The government will be heavily involved in planning output and setting pricing here, as well as sharing in profits.  Fans of laissez-faire free markets may be understandably queasy over this arrangement, but national security considerations seem to make this necessary.

I predict that further “private-public” deals will be struck to subsidize Western production of vital materials. Let’s be clear: massive subsidies or similar incentives, in one form or another, will be needed. And this means that Americans will have to devote more resources to grinding out industrial materials, and less to consumer goods; hence, we will likely live in smaller houses, perhaps (gasp) lacking granite countertops and recessed lighting. Economics is all about trade-offs.

Due to its vast, lower-paid, hard-working and highly-capable workforce, the whole Chinese supply chain and production costs run far, far cheaper than anything in the West. We don’t have to produce 100% of what we use, even say 40% might be enough to keep from being helplessly squeezed by another nation. How to do this without descending into unproductive rent-seeking rip-offs will be a challenge.

Some other materials candidates:  China has as of December 2024 completely shut off exports to the U.S. of three key non-rare earth technical elements, gallium, germanium and antimony, so those might be a good place to start. China mines or refines between half and 90% of global supply of those minerals. Also, China has instituted export regulations of for more key metals (tungsten, tellurium, bismuth, indium and molybdenum-related products), so these may be further subjects for squeeze plays. Finally, “China is the world’s top graphite producer and exporter, and also refines more than 90% of the world’s graphite into a material that is used in virtually all EV batteries,” so that is yet another vital material where the West must decide how much it is worth to break its dependence on an unreliable trading partner.
We Don’t Have Mass Starvations Like We Used To

Two ideas coalesced to contribute to this post. First, for years in my Principles of Macroeconomics course I’ve taught that we no longer have mass starvation events due to A) Flexible prices & B) Access to international trade. Second, my thinking and taxonomy here has been refined by the work of Michael Munger on capitalism as a distinct concept from other pre-requisite social institutions.

Munger distinguishes between trade, markets, and capitalism. Trade could be barter or include other narrow sets of familiar trading partners, such as neighbors and bloodlines.  Markets additionally include impersonal trade. That is, a set of norms and even legal institutions emerge concerning commercial transactions that permit dependably buying and selling with strangers. Finally, capitalism includes both of these prerequisites in addition to the ability to raise funds by selling partial stakes in firms – or shares.

This last feature’s importance is due to the fact that debt or bond financing can’t fund very large and innovative endeavors because the upside to lenders is too small. That is, bonds are best for capital intensive projects that have a dependable rates of return that, hopefully, exceed the cost of borrowing. Selling shares of ownership in a company lets a diverse set of smaller stakeholders enjoy the upside of a speculative project. Importantly, speculative projects are innovative. They’re not always successful, but they are innovative in a way that bond and debt financing can’t satisfy. Selling equity shares open untapped capital markets.

With this refined taxonomy, I can better specify that it’s not access to international trade that is necessary to consistently prevent mass starvation. It’s access to international markets. For clarity, below is a 2×2 matrix that identifies which features characterize the presence of either flexible prices or access to international markets.

Continue reading →

What is $300,000 from “The Gilded Age” Worth Today?

SPOILER ALERT FOR THE THIRD SEASON OF THE GILDED AGE

In Season 3 of the drama series “The Gilded Age,” one of the servants (Jack, a footman) earns a sum of $300,000 by selling a patent for a clock he invented (the total sum was $600,000, split with his partner, the son of the even wealthier neighbor to the house Jack works in). In the series, both the servants and Jack’s wealthy employers are shocked by this amount. Really shocked. They almost can’t believe it.

How can we put that $300,000 from 1883 in New York City in context so we can understand it today?

A recent WSJ article attempts to do that. They did a good job, but I think more context could help. For example, they say “Jack could buy a small regional bank outside of New York or bankroll a new newspaper.” Probably so, but I don’t think that quite conveys the shock and awe from the other characters in the show (a regional bank? Ho-hum).

First, the WSJ states that the “figure nowadays would be between $9 and $10 million.” That’s just doing a simple inflation adjustment, probably using a calculator such as Measuring Worth (it’s a good tool, and they mention it later in the story). But as the WSJ goes on to note, that probably isn’t the best way to think about that figure.

Here’s my best attempt to contextualize the $300,000 figure: as a footman, Jack probably made $7 to $10 per week. Or let’s call it $1 per day. That means Jack’s fellow servants would have had to work 300,000 days to earn that same amount of income — in other words, assuming 6 days of work per week, they would have had to work for almost 1,000 years to earn that much income. Jack appears, to his co-workers, to have earned that income almost in one fell swoop (though in reality, he spent months of his free time toiling away at the clock).

Continue reading →

The 2018 Tariffs in Many Graphs

Did president Trump’s first term tariffs, enacted in 2018, increase manufacturing employment or even just manufacturing output? Let’s set the stage.

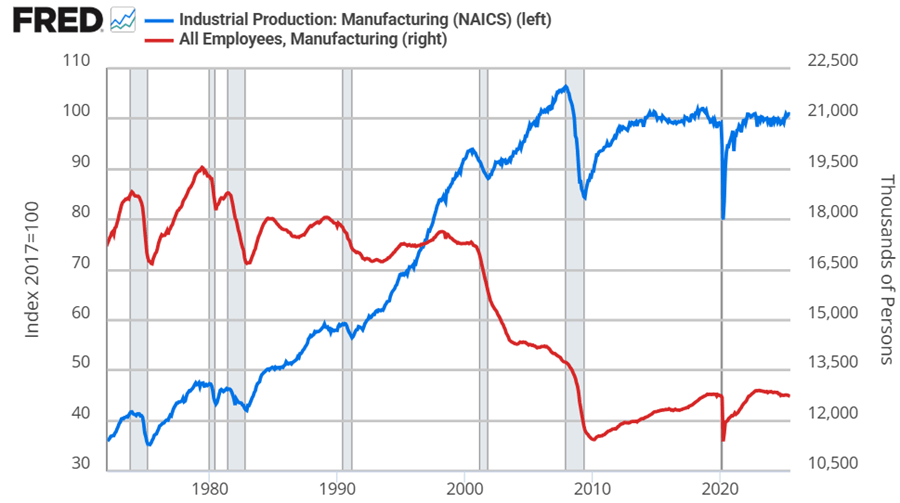
Manufacturing employment was at its peak in 1979 at 19.6 million. That number declined to 18m by the 1980s, 17.3m in the 1990s. By 2010, the statistics bottom out at 11.4m. Since then, there has been a rise and plateau to about 12.8m if we omit the pandemic.

Historically, economists weren’t too worried about the transition to services for a while. After all, despite falling employment in manufacturing, output continued to rise through 2007. But, after the financial crisis, output has been flat since 2014, again, if we omit the pandemic. Since manufacturing employment has since risen by 5% through 2025, that reflects falling productivity per worker. That’s not comforting to either economists or to people who want more things “Made in the USA”.

Looking at the graphs, there’s no long term bump from the 2018 tariffs in either employment or output. If you squint, then maybe you can argue that there was a year-long bump in both – but that’s really charitable. But let’s not commit the fallacy of composition. What about the categories of manufacturing? After all, the 2018 tariffs were targeted at solar panels, washing machines, and steel. Smaller or less exciting tariffs followed.

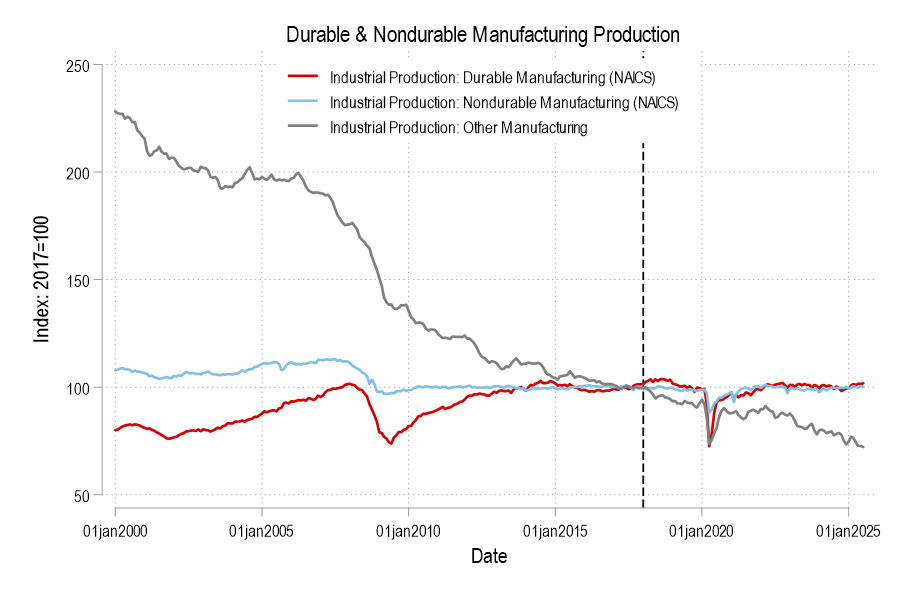
Breaking it down into the major manufacturing categories of durables, nondurables, and ‘other’ (which includes printed material and minimally processed wood products),  only durable manufacturing output briefly got a bump in 2018. But we can break it down further.

Continue reading →

Why I Started Grading Attendance

I’ve taught college classes since 2010, but I never graded attendance directly until this year. I thought that students are adults who can make their own choices about where to spend their time, and if they could do well on my tests and assignments without spending much time in class, more power to them.

But I got tired of seeing students miss a lot of class, then fail by getting poor grades on the tests and assignments, or scramble for the last few weeks to avoid failing. Explaining the importance of attendance didn’t seem to help, so I finally turned to the economist’s solution- incentives. This Spring I tried grading attendance in one class, and this successful experiment plus the growth of AI mean I plan to grade attendance in all classes from now on.

The Benefits:

  • Get to know student’s names faster
  • Students feel rewarded for showing up
  • Students show up more, bringing more energy to the room
  • Students show up more, so they learn more and do better on other assignments
  • Physically showing up is one thing I can be sure the AI isn’t doing for them, it will be a while before humanoid robots are that good

The Costs That Turned Out Not to Be Big Deals

  • I thought students would dislike me policing their whereabouts and give me lower course evaluations (which is part of why I waited for tenure to try this). But my Spring evals were at least as high as usual, with none mentioning the attendance policy. When I asked students in a different class about this, most said they wished I would grade attendance if it meant less weight on exams.
  • I thought tracking attendance would be burdensome, but it turns out my main course software (Canvas) already has an attendance-tracking tool built in that lets you just click on names in a seating chart each day and enters grades automatically. It is certainly less burdensome than grading most assignments.

I still had some students disappear for a while due to personal issues; sometimes even the strongest grade incentives aren’t enough to get people to class. But overall I can’t believe I waited this long. I’m currently putting attendance as 10-15% of the course grade, but I dream about someday running a discussion-based class like a Liberty Fund seminar, doing a 100% attendance/participation grade, and not having to grade anything.

Initial Jobs Reports from BLS are Very Good At Identifying Downturns in the Labor Market

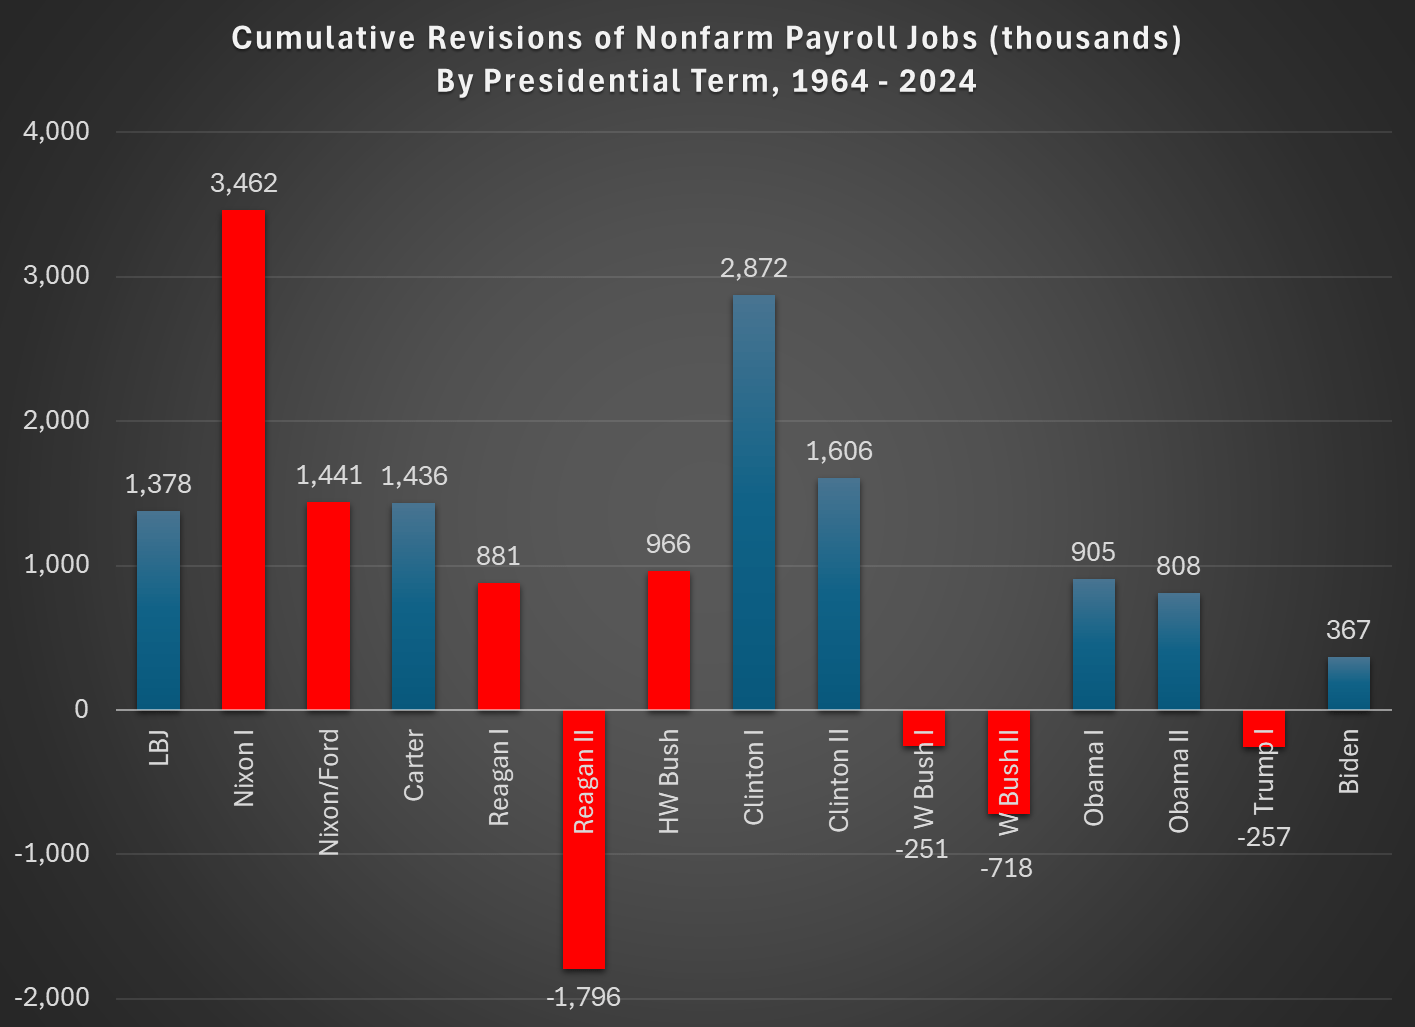
Yesterday I showed that BLS jobs reports from the CES aren’t getting worse over time, if we judge them by how much they are later revised. In fact, they are much better than decades past, with the last 20 years or so standing out as much better than the past.

Today I want to address a related but separate topic: are the initial jobs reports good at telling us when a downturn in the labor market is beginning? This is actually the strongest argument for releasing this survey data in a timely manner, even though the data often goes through significant revisions later. The report typically comes out the first Friday of a new month, so it is very current data. Given that the likely new BLS Commissioner has signaled he prefers the more accurate quarterly release, even though it is 7-9 months after the fact, it is useful to ask if these initial reports have any value in telling us when labor market declines (and recessions) are beginning.

That’s right: you are getting two posts from me this week, on essentially the same topic. Because it’s very important right now.

The short answer: the report is very good for the purpose of identifying downturns, especially the start of the downturns. Let’s walk through the past few recessions.

Continue reading →

BLS Has Been Getting Better at Estimating Jobs, and They are Not More Favorable to Democrats

You’ve probably heard a lot about BLS data recently (or at least more than usual) with Trump firing the BLS Commissioner after a bad monthly revision to the nonfarm payroll jobs figures. But this didn’t come out of the blue, as there was plenty of criticism of the jobs numbers during the Biden term as well, mostly coming from the political right.

The two main criticisms leveled at the BLS, in my reading of it are:

  1. The BLS is getting worse at estimating jobs numbers over time, leading to larger revisions
  2. The revisions are done in a way that is favorable to Democrats

I think both of those claims can be analyzed with the following chart, which also shows those claims to be incorrect:

Continue reading →

Top EWED Posts of 2025

These are notable posts from 2025, roughly presented in descending order, starting with the post that got the most views.

  1. Is there a competitive threat to the NBA?  Mike Makowsky wrote, “… let’s put it this way. Why *wouldn’t* the Saudi Arabian PIF invest $5 billion in creating a rival basketball league?”

2. Perspective: This Stock Correction Fear, Too, Will Pass  In March, Scott Buchanan presented “an optimistic take on the current stock market pullback.”   Indeed, the market came back, despite the tariff doomerism of 2025 Spring.

3. The Middle/Working Class Has Not Been “Hollowed Out” Jeremy Horpedahl, corrector of common myths, corrects a common myth.

4. Montana’s New Property Tax System  Jeremy explains “interesting changes to residential property taxes in Montana.”

5. How Scott Bessent Outfoxed Peter Navarro to Get the 90 Day Tariff Pause from Scott: “As Treasury Secretary, Scott Bessent would be particularly sensitized to the interest rate issue…”

6. Spending on Necessities Has Declined Dramatically in the United States Jeremy reminding us that Americans are richer today.

7. Was the US at Our Richest in the 1890s? If you don’t believe Jeremy, consider one of the American Girl Doll historical books I was just reading to my kid. In our book, a little girl sends a letter to Samantha (the 1904 doll) reporting that both of her parents just died from the flu.

8. The Wild Market of July 8th, 2025 James Bailey on the topic that we are all trying to keep up with this year: “Yesterday the S&P 500 shot up 9% on the news that most of Trump’s new tariffs were paused.”

Special mention to Joey Politano who has been trying to follow the news all year and might go insane according to his Twitter/X.

9. No Tech Workers or No Tech Jobs? I (Joy) wish I had more time to write about the market for tech jobs this year. There is some indication that hiring is slowing. Some people still call it a correction from the Covid tech over-hiring spree. Other people take this as a sign that AI reduces the need for human programmers and otherwise “high-skill” humans, while some refute that claim.

10. Other “I, Pencils”  It was fun for several dozen of us economists when everyone else in the world suddenly re-discovered the value of international exchange.

11. The Best Investments of the 1970s James considers “what were the best investments of the 1970’s?”  Interesting to consider the performance of gold in retrospect considering stagflation.

12. Women Have Always Worked More Than Men: Hours of Work Since 1900 I feel seen.

13. Shocked 2025 is shocking, as Mike pointed out in February.

14. Trump’s Economic Policy Uncertainty Along those lines, Zachary Bartsch examines how people are shocked and confused.

15. Salty SALT in the OBBB Zachary explains. “Economically, the SALT makes it cheaper for individuals to live in high-tax jurisdictions. That’s distortionary.” 

16. Illusions of Illusions of Reasoning I wrote, “evaluating AI reasoning is difficult…”

Reflections: We’ve been doing this for 5 years now, as of August 2025. From the analytics I can see, our posts have been the answer to a stranger’s Google query hundreds of thousands of times. Having been the beneficiary of so many other posts from strangers online, I’m happy about that.

Reminder: You can subscribe to our WordPress site to get posts sent to your email. The widget for putting your email in should be on the right side of your screen on a computer, or you can find it by scrolling to the bottom of the home page on a mobile device. WordPress will let you customize your preferences so that you get emails batched once a week if you prefer that to Every Day.

Based on my crude analytics from WordPress, “traffic” to our site from LLMs is low but increasing. It appears that readers occasionally click over from chatgpt.com or perplexity.ai  What we can’t see is if and when our writing is re-molded as part of an LLM answer without attribution. In one sense, writing online is more important than ever, to feed the beast and help get good quality answers to LLM users. On the other hand, old systems in place like upvotes and view counts that used to motivate people to write for free might crumble in the new world.

From me in 2024: “AI companies have money. Could we be headed toward a world where OpenAI has some paid writers on staff? Replenishing the commons is relatively cheap if done strategically, in relation to the money being raised for AI companies.” 

If anyone knows Mark Zuckerberg, please tell him that I’ll write for a fraction of what he’s paying these new engineers. What if he gave out a writing fellowship on the understanding the person never publishes (else the other bots would scrape it) and just exclusively lets Llama train off of original work?

In our case, anyway, we enjoy writing and learn from the process, so we are looking forward to being here every day.

To find prior year “top post” lists, start with: Updated List of Top Posts for 2024

Hayek on The Volatility Pie

In the Road to Serfdom, Friedrich Hayek uses some basic quantitative logic to make an important point about employment and political economy.

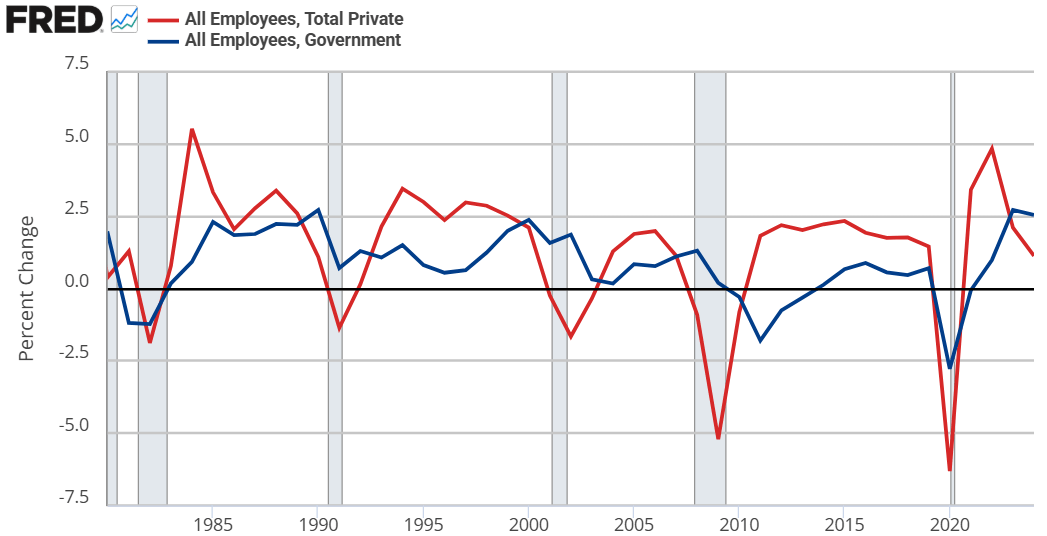
Hayek starts by assuming that government jobs are stable relative to those in the private sector. This might seem obvious, but let’s just start by checking the premises. Below are the percent change in total compensation and total employment for government employees and for the private sector. From year to year, private employment and total compensation is more volatile. So, Hayek’s initial premise is correct.

From there, he proceeds to say that if any part of income or employment is guaranteed or stabilized by the government, then the result must be that the risk and volatility is borne elsewhere in the economy. He reasons that if there is a decline in total spending, then stable government pay and employment implies that the private sector must have a deeper recession than the overall economy. Looking at the above graphs, both government employment and the total compensation are much less volatile.

But can’t governments intervene in macroeconomic stabilization policies effectively? Yes! They can and do stabilize the economy, especially with monetary policy. But Hayek is referring to individual stabilizations. For any individual to be guaranteed an income, all others must necessarily experience greater income volatility. How’s that?

Consider two individuals. Person #1 has an average income of $100. In any given year, his income might be $10 – or 10% – higher or lower than average. For the moment, person #2 is not employed and has income volatility of zero. If the government provides a job with a constant pay rate to person #2, then they still have zero income volatility. But instead of earning a consistent $0, person #2 earns a consistent $50. Nice.

Of course, person #2 gets his pay from somewhere. By one means or another, it comes from person #1. Let’s be generous and assume the tax on person #1 has no resulting behavioral effect. His new average income is $50, being $10 higher or lower in any given year. But now, that $10 deviation is over a base of $50 rather than $100. Person #1’s income varies by 20% relative to his new average!

Reasoning through this, we can consider that a person has a stable portion of their income and a volatile portion. If someone takes a part of your stable portion and leaves you with all of your volatile portion, then your remaining income is now more volatile on average. I think that this point is interesting enough all by itself.

IRL, many of our taxes are not lump sum. Rather, progressive taxation causes a negative incentive for production & earnings. The downside is that we produce less. The upside is that the government takes a higher proportion of our volatile income than of our stable income (because income changes are always on the margin and those marginal dollars are taxed at a higher rate). So, the government shares the income volatility of the private sector. By continuing to pay government employees a stable salary, the government is effectively absorbing some of that year-to-year income volatility on behalf of its employees.* The government is, in a sense, providing income insurance to a subgroup.

What does this have to do with The Road to Serfdom? Hayek argues that, as the government employs an increasing proportion of the population, the remaining private sector experiences increasing income and employment volatility. Such volatility increases private risk exposure so much that people begin to fawn over and increasingly compete for the stability found in government work. He gets anthropological and argues that the economic attraction to government jobs will introduce greater competition for those jobs and subsequently greater esteem and respect for those who are able to get them. This process makes the government jobs even more attractive.

My own two cents is that there is nothing internally unstable about this process. Total real income would fall compared to the alternative. However, such a state of affairs might be externally unstable as other governments/economies compete with the increasingly socialist one.


*An important analogue is that firms behave in a similar way. An individual may receive a relatively constant salary so long as they are employed. But the result must be that the firm bears more of the net-profit volatility. So, as more people want stable private sector jobs, the profit volatility of firms would increase and result in greater [seemingly windfall] profits and losses.