Old Lives Matter

Bryan Caplan has kindly responded to my latest blog post, which was in turn a response to his blog post on the relative value of human lives by age. Caplan has always been kind in his responses, even when responding to pesky graduate students — kind in both his approach and the time he dedicates to responding thoughtfully. So I appreciate his taking the time to respond to me, and I will offer a few more thoughts on the matter.

To briefly summarize: Caplan believes that young lives (10 year olds) are worth 100-1,000 as much as old lives (80 year olds). I contend that they are closer to roughly equally valued. My disagreement with Caplan can be broken down into two categories:

  • A. Caplan’s three reasons why young lives are worth more (a lot more!) than old lives. I didn’t respond to that directly, but I will do so here. I think Caplan is narrowing the goalposts.
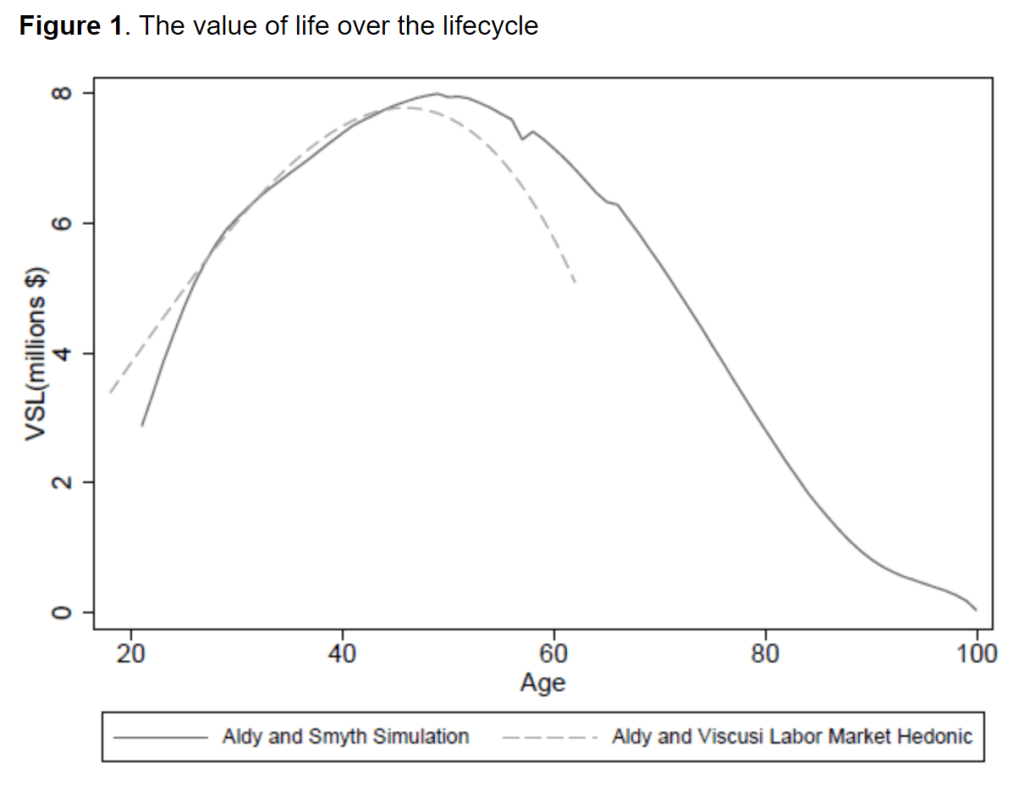
  • B. A disagreement over the shape of the VSL curve over the lifetime, specifically whether an inverted-U-shaped curve makes sense. I’ll say more about this too, but Caplan doesn’t just have a beef with me, but with almost everyone in the VSL literature!

Let’s start with Caplan’s three reasons, which he calls “iron-clad”: young people have more years to live, those years are generally healthier, and young people will be missed more when they are gone. The first in undeniably true on average, the second is probably true almost all the time, and I’m not sure on the third, but I’m willing to admit it’s not a slam dunk either way.

So how can I disagree? These are only three things. There are many other considerations, and we can imagine other reasons that old lives are valued as much or more than younger lives! I’ll call mine 4-6 to go with Caplan’s 1-3:

  1. Old age spending is the largest component of public budgets in developed countries (and this is unlikely mostly due to rent seeking or the self interest of younger generations).
  2. The elderly possess wisdom which is highly valuable and that the young benefit from.
  3. The last years of your life are, on average, worth a lot more — you are usually very wealthy, have no employment obligations, you have grandchildren you love (without the responsibilities of parenting), and are (until the very end) generally healthy too.

Taken as a whole, I think these three reasons present a strong counterargument to Caplan’s three reasons. And I think we could certainly come up with more! My point being that Caplan has picked three areas where clearly young lives have the advantage, but ignored all the good reasons why old lives are more valuable. These is what I mean by we shouldn’t rely on our intuitions. Neither of our lists are exhaustive, but let me elaborate on a few of these.

Continue reading

The Value of Life, Again

Bryan Caplan argues that the life of a 10-year-old is worth 100-1,000 times that of an 80-year-old. But he suggests the modal answer people would give is that the two lives are equally valued.

I’m not sure if he is right about what the modal answer would be that they are exactly equal (though see below for an attempt to answer this question). Surprisingly, though, roughly equally valuing all lives is actually the answer that a normal economic calculation, willingness-to-pay for risk reduction, would give you! Or at least roughly. I haven’t seen an estimate for a 10-year-old, but estimates of the Value of a Statistical Life for 20-year-old is roughly equal to an 80-year-old. I’ve written about this before, and here’s a summary of a working paper by Aldy and Smyth that I am drawing on. Middle age lives are worth more, using this method, though perhaps just 2-3 times more.

Caplan doesn’t directly connect his hypothetical to the COVID pandemic, but in the comments Don Boudreaux does make that connection and says that “surely the correct level of precaution to take against a disease that kills X number of old people is lower [than a disease that kills the same number of young people].” I find this a very interesting statement because Don Boudreaux, and many others, have been against just about any precaution (other than asking the elderly to isolate) in the current pandemic. Would he and others support more caution if they believed the VSL estimate to be true?

So who is right? Caplan’s intuition? Or the modeled VSL calculations? For surely these are miles apart, and they can not both be correct.

As an economist, I have a strong preference in favor of willingness-to-pay over our intuitions. Indeed, Caplan himself as defended the VSL approach quite forcefully!

Continue reading

Teaching Economics with COVID

In many of my blog posts I address either issues related to COVID or teaching economics. In this post, I want to combine the two. One thing economists of a certain age struggle to do is find examples to illustrate economic concepts which will actually connect with 18-22 year olds. The silver lining of the pandemic is that we now have an example that everyone is familiar with, and can be used to illustrate a host of economic concepts.

A great new book by Ryan Bourne, Economics in One Virus, really pushes this idea to the limit. He uses examples related to COVID to explain almost every single concept you would cover in a typical introductory economics course: cost-benefit analysis, thinking on the margin, the role of prices, market incentives, political incentives, externalities, moral hazard, public choice issues, and more.

Continue reading

The Impact of the Pandemic on US States: GDP and Deaths

Following up on my recent post on country GDP growth rates and mortality in 2020, we now have the first look at state GDP growth rates for 2020 from the BEA.

As with the national data, I would look to caution against over-interpreting this data. I’m presenting it here to give a picture of how 2020 went for states (including a few months of 2021 for morality data). One thing you will notice is that there appears to be little correlation with the raw data between GDP declines and mortality. Lots of important factors (policy, behavior, demographics, weather, luck) aren’t controlled for here. Still, I think it’s useful to see all the data in one picture, given how much many of us have been following the daily, weekly, and monthly releases.

Here is the data. Below I’ll explain more how I created this chart, especially the excess mortality data.

Continue reading

On Cylindrical Revolutions

The three technological innovations new to my life in the last year with the greatest impact are:

  1. Pfizer mRNA vaccines (price = $19.50, input costs: no less than $2 Billion, probably more)
  2. Amazon Basics Foam Roller (price $18.99, input costs: $4.44 per ounce of styrofoam)
  3. Zoom teleconferencing (price: $no idea what my school pays for it, input costs: $146 Million in venture funding)

The vaccine, of which I am scheduled to receive my first dose of tomorrow, will allow me to (sort-of) return to my pre-pandemic life. The introduction and regular use of a cylinder of high-density styrofoam has given me a better functioning left leg than I’ve enjoyed in 5 years. Zoom has arguably done more to maintain my the short-term integrity of my income (i.e. it’s allowed me to teach online effectively).

That is a very oddly shaped distribution of investments in high-utility yield innovations.

Biotechnology and medicine as a high investment, high risk, big payoff innovation game is well understood. Less known was whether or not a rapid “innovation on demand” vaccine project was an achievable outcome, no matter how much money was thrown at it. Turns out it was, and we’re left with what might be the most impressive feat of willed innovation since the moon landing. High-resolution teleconferencing technology, on the other hand, is exactly the kind of product we’ve grown accustomed to modern tech firms producing– the supply of such innovative products via the private capital-entrepreneurship pipeline is almost always less in question than the eventual demand it may or may not find in the marketplace.

But what of treating your muscles like sugar cookie dough? This is neither a sophisticated new composition of materials nor, at face value, a particularly complex theory of musculature. But, to my knowledge, this is not something even professional athletes were doing 7 years ago, yet now is both the bleeding edge of physical maintenance and such common knowledge that everyone who’s strained a muscle in the last 6 months currently has one of these cylinders leaning against a wall in their home. And, while I don’t mean to oversell it, the introduction of foam rolling has massively improved the quality of my life, not just when I try to play any sort of sport, but when I walk down a flight of stairs. It’s not crazy to suggest it may buy me an extra decade of easy use of my preferred mode of transportation, and while using my natural knees at that.

Investment in innovation is an interesting thing – there appears to be significant returns to scale at the micro, meso, and macro levels. Firms flush with capital can focus teams on single problems, fill them with talent, and grant them the keys to every piece of equipment deemed to hold even the slightest possibility of aid en route to an end product. There are simply innovative outcomes on the horizon for the Pfizers of the world that will never be available to scrappy new start-ups. At the same time, we can see the network-driven returns to scale in markets, a la Silicon Valley or Hollywood, that only begin to appear when a critical mass of agents all find themselves drawn to the bubbling creative soups that appears in the diners, salons, and coffee shops of whatever place has become the place.

But there are scale returns at the most macro of macro levels as well, and that is where we get miraculous cylinders of foam, as well as wheels on suitcases and the polymerase chain reaction. People are many things. Occupiers of space. Emitters of carbon dioxide. Consumers of fried dough. Sometimes while doing all three they also come up with ideas.

Humans as idea machines lies at the core of Michael Kremer’s theory of economic growth, and it is perhaps my favorite idea within economics in the last 40 years. Simply put, more people leads to more ideas. Population growth is not just a product of innovation, it is a source of it. Every individual is a lottery ticket that we hope pays off with a world changing eureka moment that the rest of us can benefit from and build on for all time going forward. More people, more lottery tickets.

Those organic globules of cognitive betting slips coalesce into the long tail of innovation return on investment. We take the brightest minds, throwing them and piles of cash at our biggest problems, hoping that for the closest thing to a assured payoff. But it’s within the billions of people, and their billions of bad ideas that sometimes aren’t, within which we get countless miracles that change our lives for the better bit by bit, one smoothened middle-aged stride at a time.

Wait for the Lower Cost Version of Policy

I’ve written previously about initial US state compulsory schooling laws in regard to literacy and in school attendance rates. I ended with a political economy hypothesis. Here’s the logic:

  1. Legislators like lower costs, all else constant (more funding is available for other priorities).
  2. Enforcing truancy and educating an illiterate populous is costly.
  3. Therefore, state legislatures that passed compulsory attendance legislation will already have had relatively high rates of school attendance and literacy.

That’s it. Standard political economy incentives. But is it true? Well, we can’t tell what’s going on in politician heads today, much less 150 years ago. Though, we can observe evidence that might corroborate the story. In plain terms, consistent evidence for the hypothesis would be that school attendance and literacy rates were rising prior to compulsory schooling legislation. The figures below show attendance and literacy rates for children ages 10 to 18.

Continue reading

Working Hard for the Money

40 hours. That’s what we think of as a typical workweek. 8 hours per day. 5 days per week. Perhaps the widespread practice of working from home during the pandemic (as well as the abnormal schedule changes for those unable to work from home), has led some to rethink the nature of the workweek. But the truth is that the workweek has always been evolving.

Take this chart, for example. It comes from Our World in Data (be sure to read their excellent related essay as well), and the historical data comes from a paper by Huberman and Minns. I’ve singled out 4 countries, but you can add others at the OWiD link.

The historical declines are dramatic. This is especially true in Sweden. The average Swedish worker labored for over 3,400 hours per year in 1870. Today, that’s down to 1,600 hours. In other words, the typical Swede works less than half as many hours as her historical counterpart. Wow! The decline for the US is not quite as dramatic, but still astonishing: a US worker today labors for only about 57% of the hours of his 1870 predecessor.

It’s tempting to focus on the differences across countries today: the average worker in the US works about 250 hours more than the average French worker. That’s 6 weeks of vacation! And as recently as 1980, the US and France were roughly equal on this measure. We might also wonder why these historical changes happened. For a very brief introduction to the research, I recommend the last section of this essay by Robert Whaples.

But still, the historical declines are dramatic, even if we in the US haven’t seen much improvement in the past generation (and those poor Swedes, working 100 hours per year more than 40 years ago).

I think another natural question to ask is whether GDP data is distorted, at least as a measure of well being, given these differences in working hours. The answer is partially. Let’s look at the data!

Continue reading

Berkson’s Paradox nay Bias and Spring Break Blogging

You may be tempted to observe a negative correlation between the length of my blog posts and fraction of the previous 7 days that can be accounted for as “Spring Break”, but I submit that you may simply be omitting from the sample all of the short blog posts I could hypothetically be writing in crisp fall months.

Do read Lionel’s whole thread though. It’s good.

Thoughts on end-of-semester lectures (Part 1)

At the end of the semester, I like to make a splash with students. For example, in my intermediate microeconomics course I put together a fun lecture. We have some laughs talking about models. We talk Rolling Stones songs like “you can’t always get what you want” (budget constraints) as well as Queen songs like “I want it all” (monotonicity).

We wax philosophical with Robert Frost’s “The Road Not Taken” about opportunity cost. We reiterate that the arguments in utility functions can be a richer set of desires than food and shelter. As Adam Smith says, “Man naturally desires not only to be loved, but to be lovely.” We emphasize that our models are simplified because good models try to get to the heart of the matter.

Sometimes models are dangerous. Like the “monkey illusion” we become so distracted we miss the heart of the matter. One prime example is how Samuelson continued to update the projection about when the USSR would surpass the US economy (check this out for more info) or Easterly’s depiction of the World Bank notion that if you build it, growth will come.

We discuss the importance of models, how they organize our thinking, the dangers of being too wed to a model but also the importance of empirical testing. We use MobLab in class to test our models as I’ve written about here. But, MobLab can’t give us an empirical test of all the important questions. We have to look elsewhere, out in the world to find evidence. One of my favorite examples of this are cross-border comparisons like East and West Germany, North and South Korea, Haiti and the Dominican Republic, etc.

I remind students that incentives matter. Economic institutions influence the costs and benefits of human action. When costs and benefits change, we expect for behavior to change. Throughout the semester we learned to formalize these ideas and they are not without consequence. As this New York Times piece discusses the work of Amartya Sen,

“Nature causes floods and droughts, but most societies have found ways to get food to those afflicted most of the time. Human folly causes famine, which occurs when those ways are blocked. Amartya Sen, a Harvard economist, argued that there has never been a serious famine in a country — even an impoverished one — with a democratic government and a free press. The press acts as a warning system and the pressures of democracy dissuade rulers from famine-producing policies.”

While economics is fun, interesting, and can be light-hearted, economics can also be deadly serious. The stakes of economic illiteracy are enormous.

Next week we go on to Part 2 where I pivot from this section of the end-of-semester talk to the applications of economic ideas to the everyday life of students.

The Luck (?) of the Irish

Poor Ireland. Long oppressed by the Brits. Losing 25% of their population in the Great Famine due to both deaths and emigration. Today, there are possibly 10 times as many Irish Americans as there are residents of Ireland. There are as many Irish Canadians as there are residents of Ireland.

Poor Ireland.

And indeed, Ireland used to be literally very poor, at least in an economic sense. In 1960, their GDP per capita was about half of the United Kingdom. As recently as 1990, they were still only at about 70% of the United Kingdom and the rest of Western Europe. That’s all according to the latest Maddison database figures, which are probably as close to accurate as we can find. But after 1990, we probably shouldn’t use those figures, for reasons peculiar to Ireland.

Today? Ireland is much wealthier. But how much wealthier? It’s tricky. Ireland’s GDP is inflated significantly due to a lot of foreign investment. And possibly some tax evasion/avoidance. You see, Ireland is a tax haven. It has one of the lowest corporate tax rates in the world. That means we have to interpret the data with care, but only because it is such a great place to invest.

Continue reading