Last year I blogged about a service to create your kid’s school Valentine’s cards.
Now, the temperature in Alabama has dropped to a chilly 71 degrees and the pumpkins are out. It’s time for parents to start worrying about who is going to create holiday magic at home.
You can pay someone to do this. An enterprising local has already posted this in a neighborhood group.
Creating holiday magic is a wonderful thing. There are huge positive externalities to even a simple string of lights around your front door. I love it. Creating the magic is also a lot of work. As someone who is forever swamped at work and has already booked three weekend work trips for Fall 2021, my willingness to pay for this service is positive. (I can’t afford this particular service, nor do I need my Christmas tree to look like the one in her picture.)
The rich have always had extra hands to manage their estates. I have a feeling that the percent of households for which this might be a paid service is expanding. There are women in the comments asking this crew to come over.
Tyler has identified talent either earlier than or missed by top undergraduate programs, the best biotech startups, and the best biotech investors, all without any insider knowledge of biotech. In comparison, Forbes 30U30, MIT Tech Review TR35, or Stat Wunderkind, and other industry awards that highlight talent are lagging indicators of success. It’s hard to find an awardee of these programs that was not already widely recognized for their achievements among insiders in their field. The winners of Emergent Ventures are truly emergent.
What explains Tyler’s ability to do this?
1. Distribution: Tyler promotes the opportunity in such a way that the talent level of the application pool is extraordinarily high and the people who apply are uniquely earnest.
2. Application: Emergent Ventures’ application is laser focused on the quality of the applicant’s ideas, and boils out the noise of credentials, references, and test scores.
3. Selection: Tyler has relentlessly trained his taste for decades, the way a world class athlete trains for the olympics.
4. Inspiration: Tyler personally encourages winners to be bolder, creating an ambition flywheel as they in turn inspire future applicants.
This seems right as far as it goes, and there is more depth in the article, but there has to be more to the story than we can see from the outside. Luckily Tyler has said he is writing a book on identifying talent.
If you have ever been through the process of applying to colleges, you have almost certainly heard the term “selective colleges.” If you haven’t the basic idea is that some colleges are harder to get into, for example as measured by what percentage of applicants are accepted to the school. The assumption of both applicants and schools is that a more selective college is “better” in some sense than a less selective college. But is it?
In a new working paper, Mountjoy and Hickman explore this question in great detail. The short version of their answer: selective colleges don’t seem to matter much, as measured by either completion rates or earnings in the labor market. That’s an interesting result in itself, but understanding how they get to this result is also interesting and an excellent example of how to do social science correctly.
Here’s the problem: when you just look at outcomes such as graduation rates or earnings, selective colleges seem to do better. But most college freshmen could immediately identify the problem with this result: that’s correlation, not causation (and importantly, they probably knew this before stepping onto a college campus). Students that go to more selective colleges have higher abilities, whether as measured by SAT scores or by other traits such as perseverance. It’s a classic selection bias problem. How much value is the college really adding?
Here’s how this paper addresses the problem: by only looking at students that apply to and are accepted to colleges with different selectivity levels, but some choose to go to the less selective colleges. What if we only compare this students (and of course, control for measurable differences in ability)?
Now this approach is not a perfect experiment. Students are not randomly assigned to different colleges. There is still some choice going on. But are the students who choose to attend a less selective college different in some way? The authors try to convince us in a number of ways that they are not really that different. Here’s one thing they point out: “nearly half of the students in our identifying sample choose a less selective college than their most selective option, suggesting this identifying variation is not merely an odd choice confined to a small faction of quirky students.”
Perhaps that alone doesn’t convince you, but let’s proceed for now to the results. This chart on post-college earnings nicely summarizes the results (see Figure 3 in the paper, which also has a very similar chart for completion rates)
While writing a paper recently, I was reminded of the importance of economic modelling.
Macroeconomic models are fun to rag on – everybody does it. But all economic models help us to express our understanding of the world clearly and help us to be specific when the temptation to hand-wave is strong. After all, a model is just a fancy way of saying “a system of logic”.
The paper linked above is several revisions in. What you don’t see are the mistakes that my co-author and I made along the way and the vagueness that we had to resolve. An earlier version of the paper simply stated that deaf people were endowed with less human capital than people who could hear. So far so good. But then we said that it was ambiguous who, the deaf or the hearing, would ultimately have more human capital after making additional human capital investments.
This summer I’m writing a series of posts about the curriculum of the research process, from the initial idea to the development of a complete draft. This final week, I’m focusing on how to know when it is really time to hit ‘submit’ on your manuscript – and how to get there.
Many people get the idea that they should be working all the time. Certainly many academics do, which for us means a continuous internal reminder that “you should be writing”.
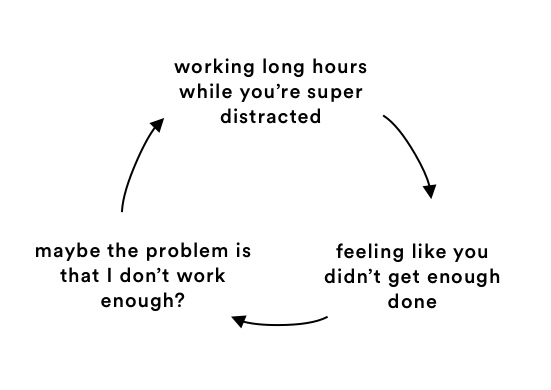
I thought this way in grad school but I don’t anymore. I now almost never work on nights & weekends, and often not on afternoons. Yet I get just as much work done, maybe more, and I’m much happier about it. How can this be?
This post from Ava provides a great explanation. Its very short and you should read it, but I think it illustrates best through its literal illustrations:
Today is a good example. I’m writing this at noon, having just finished the revisions requested by a journal after 3 hours of solid work. Now, rather than start revising the next article & doing a bad job of it, I’ll take the rest of the day off. Real original thought is hard- I know I can do it for about 3 hours on a typical day, I have no one to impress by pretending to work longer, and one way or another the output will speak for itself. As remote work grows, this ability to do the real work and then stop rather than fill time “working” should be available to more people outside of academics.
This summer I’m writing a series of posts about the curriculum of the research process, from the initial idea to the development of a complete draft. This week I’m focusing on how to tackle writing, including writer’s block, taking us from the development of the raw material to the first draft.
This summer I’m writing a series of posts about the curriculum of the research process, from the initial idea to the development of a complete draft. This week, I’m focusing on how to build and utilize a research network to support the development of your project from the initial idea to the data scaffolding of the first draft.
Why do you need a network? Why can’t you just lone wolf this research thing? For starters, going solo necessarily means you’re going to try reinventing the wheel at some point. Beyond that, your network can help you avoid common pitfalls in finding and using specific datasets, alert you to working papers in your general field, expose you to new methods that are being piloted in your discipline, and provide support when the going gets rough (it’s going to at some point). Your network also includes people who could be potential readers for your paper before you submit it to a journal and people who use their platform to boost junior scholars by inviting them to present in conference sessions, seminars, and workshops.
Hello to all the EWED readers! I’m Dr. Darwyyn Deyo, an Assistant Professor of Economics at San José State University and a Visiting Scholar at the Knee Center for the Study of Occupational Regulation. I research law and economics, occupational licensing, and the economics of crime. I would also like to thank Joy for inviting me to write some blog posts this summer! I’ll be writing a series of posts about the curriculum of the research process, from the initial idea to the development of a complete draft. This week, I’m focusing on the mechanics behind choosing that initial idea.
40 hours. That’s what we think of as a typical workweek. 8 hours per day. 5 days per week. Perhaps the widespread practice of working from home during the pandemic (as well as the abnormal schedule changes for those unable to work from home), has led some to rethink the nature of the workweek. But the truth is that the workweek has always been evolving.
Take this chart, for example. It comes from Our World in Data (be sure to read their excellent related essay as well), and the historical data comes from a paper by Huberman and Minns. I’ve singled out 4 countries, but you can add others at the OWiD link.
The historical declines are dramatic. This is especially true in Sweden. The average Swedish worker labored for over 3,400 hours per year in 1870. Today, that’s down to 1,600 hours. In other words, the typical Swede works less than half as many hours as her historical counterpart. Wow! The decline for the US is not quite as dramatic, but still astonishing: a US worker today labors for only about 57% of the hours of his 1870 predecessor.
It’s tempting to focus on the differences across countries today: the average worker in the US works about 250 hours more than the average French worker. That’s 6 weeks of vacation! And as recently as 1980, the US and France were roughly equal on this measure. We might also wonder why these historical changes happened. For a very brief introduction to the research, I recommend the last section of this essay by Robert Whaples.
But still, the historical declines are dramatic, even if we in the US haven’t seen much improvement in the past generation (and those poor Swedes, working 100 hours per year more than 40 years ago).
I think another natural question to ask is whether GDP data is distorted, at least as a measure of well being, given these differences in working hours. The answer is partially. Let’s look at the data!