Many people take a basic statistics course in college. Those course usually include an overview of standard graphs and best practices for visualizing data.
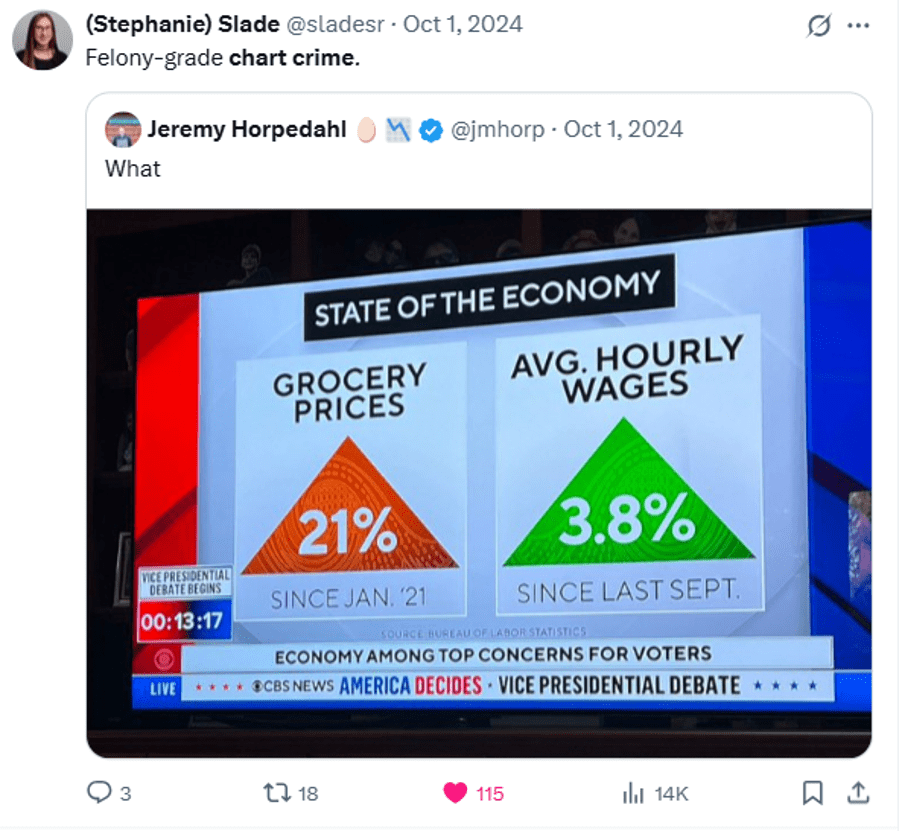
To keep that section from getting boring (“here’s a line graph… here’s a bar chart…”) you can borrow my slides on #chartcrimes Teaching people best practices is more engaging when you can show real examples of charts gone wrong.
These are pictures I dropped directly into slides and talked through:
P.S. Joke I made about this section of my textbook:
My textbook includes a slide specifically telling people not to use techniques thought to be cutting edge in 1998. "Perplexing depth" and "distracting art" 💀 pic.twitter.com/Pk5baBZvK1
I’m piggy-backing off of the FRED blog and off of Jeremy’s post with yet more data. Let’s set the stage.
FRED blog, using BLS data from the Current Population Survey (CPS), shows that the labor force participation rate (LFPR) fell by about 1.4pp for people 55 years and older between 2017 & 2023. CPS data is released quickly, but the sample sizes are not massive. There are 3.4 million people in the 7 years of monthly data (so, a little over 40k people age 55+ per monthly observation).
Also using CPS data, Jeremy shows that FRED commits the fallacy of composition because there are very different people who are 55 and older. Specifically, he illustrates that the LFPR for people ages 55-64 have experienced about a 1.3pp *higher* LFPR in 2023 vs 2017. The implication is that something is happening to the people older than 64.
I use annual CPS instead. Why? Because it can be corroborated with the annual American Community Survey (ACS) data for 2017-2023.
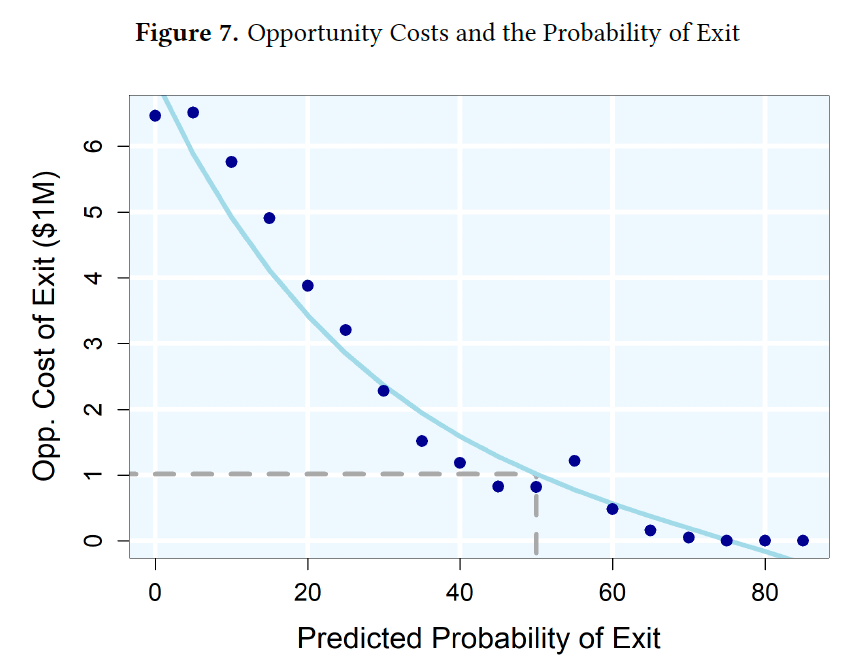
Formerteammates of athletes who died of CTE would require $6 million to offset this disamenity and $1million to be indifferent between exiting and staying in the profession.
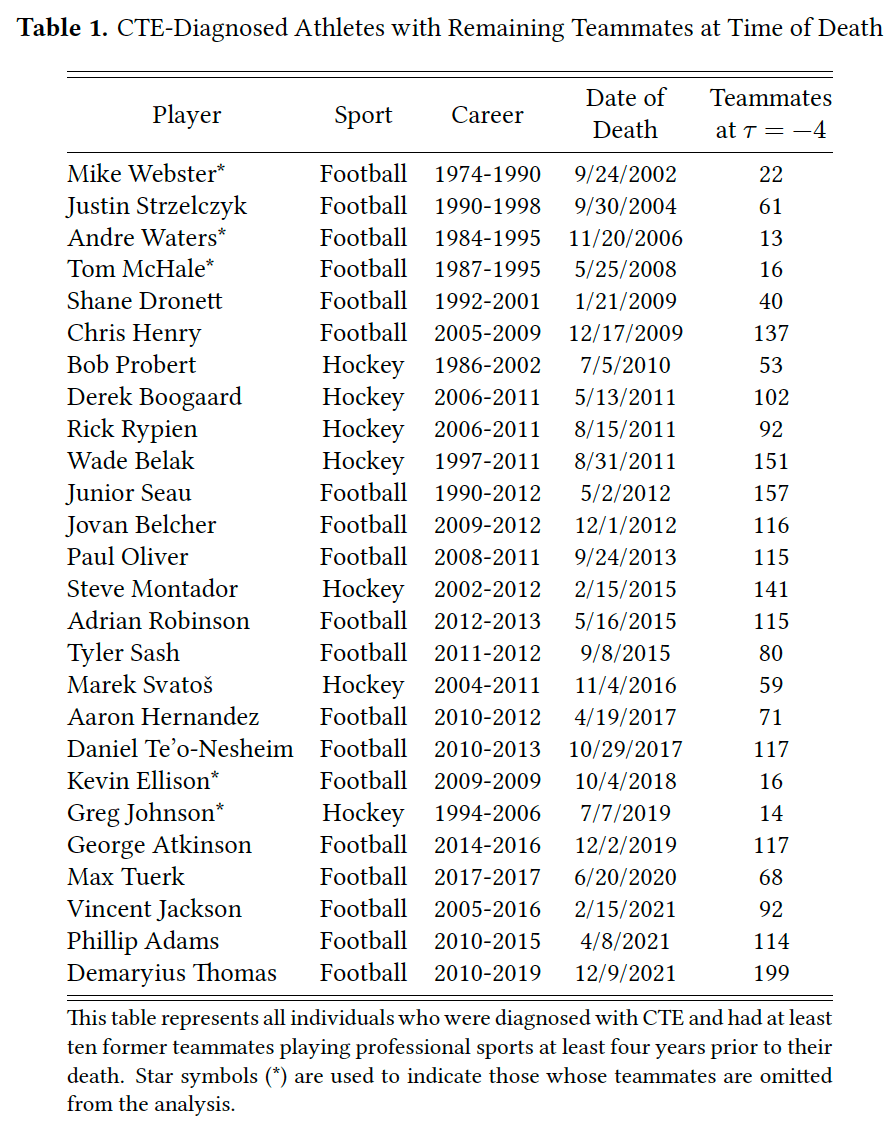
So concludes a paper by Josh Martin. I thought this paper would be about a small group, since CTE deaths mostly happen among long-retired players with few or no former teammates still playing. But it turns out there were a fair number of early deaths, and each player had many teammates who can be affected, totaling 23% of NHL players and 14% of NFL players:
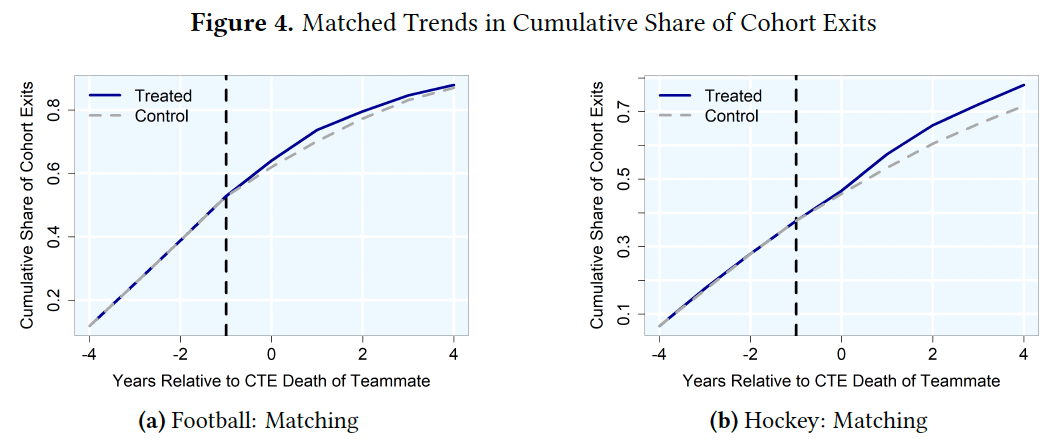
But teams mostly won’t pay worried players enough extra to stay, especially in hockey. So many of them retire early:
Athletes who were teammateswith a former teammate who died with CTE for three or more years and played for a team withthem at least two years before their death are 7.22 percentage points more likely to retire thancharacteristically similar non-treated players in the same years. Relative to the pre-treatmentmean, this represents a 69% increase.
People still respond to incentives though, and if you do pay them enough they mostly take the risk and stay:
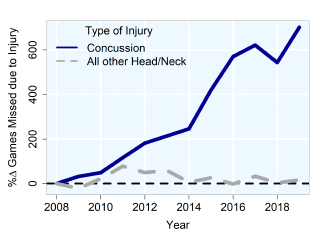
The remaining players will take measures to protect themselves, like skipping games to recover from concussions:
Michael previously pointed out here that these concerns matter more for certain positions, like running backs:
If you want millionaires to show up every week to willingly endure the equivalent of a half-dozen car accidents, you’re going to have to pay them.
This all makes for a good illustration of the theory of compensating differentials, which is sometimes surprisingly hard to observe in the labor market. But sports tend to have the sort of data we can only dream of elsewhere. Which other workers have millions of people observing, measuring, and debating their on-the-job productivity and performance?
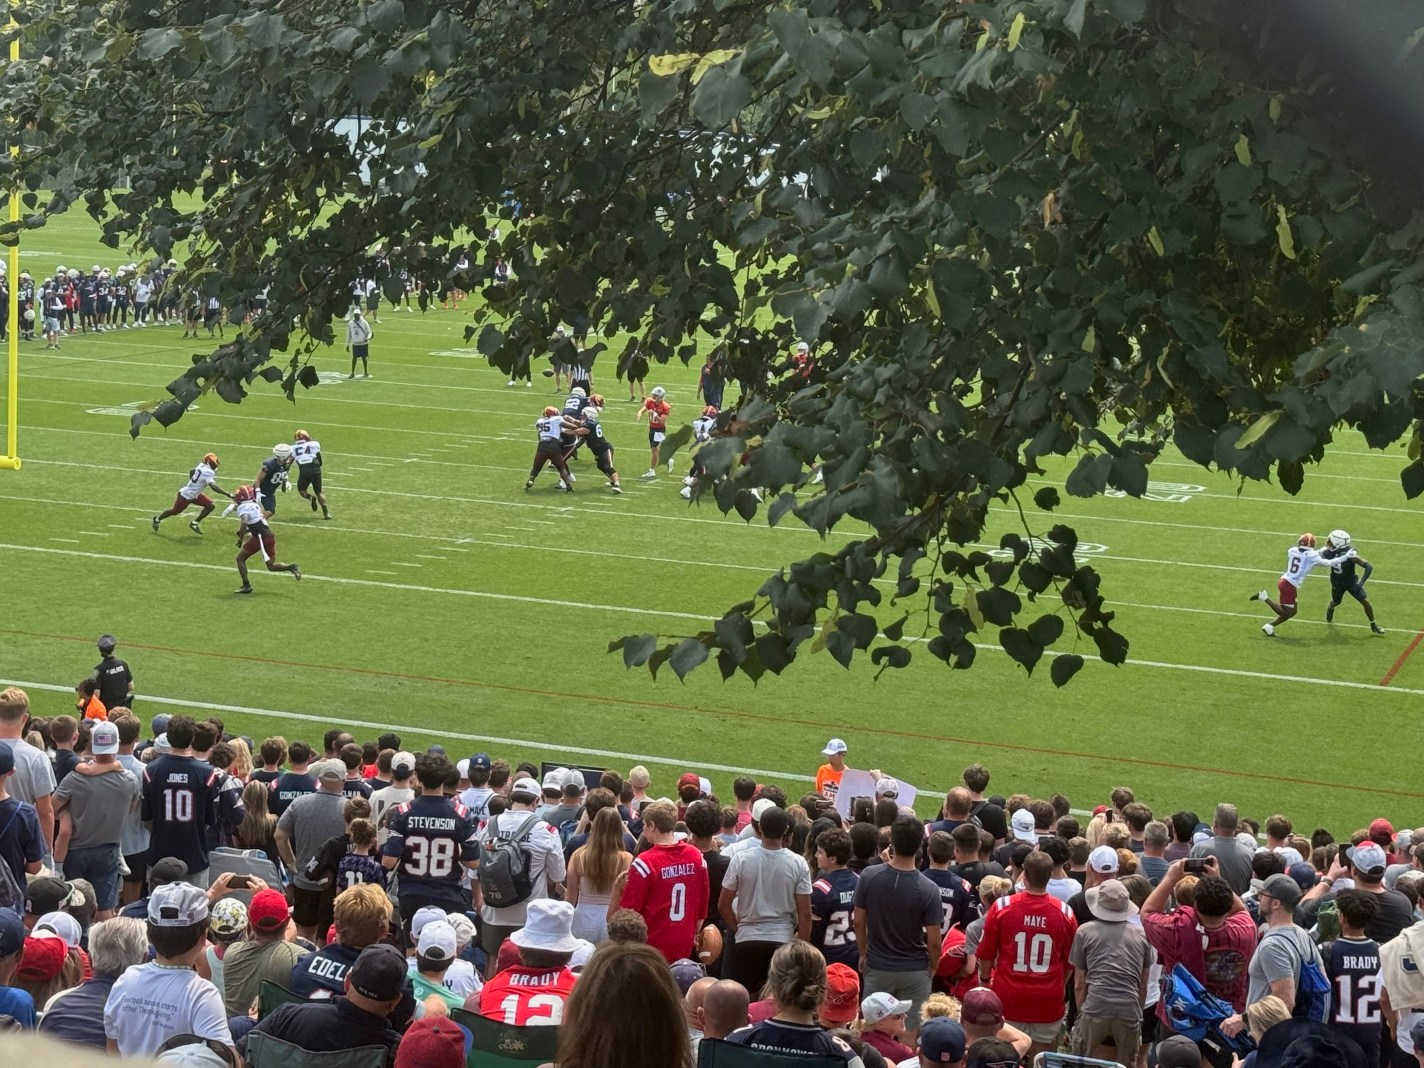
This summer I was one of thousands of people crowding into Foxborough just to watch them practice:
The NFL season kicks off today, and I say the players deserve the millions they are about to earn.
“Both younger and older workers withdrew from the labor force in large numbers during the pandemic: In fact, their participation rates plummeted. Yet, within two years, the younger workers had bounced back to their pre-pandemic participation rates. But the older workers have not.”
They include a chart which seems to back up that assertion:
However, if you look closely, you will see that the older workers’ age group is open-ended. It includes 55-year-olds, as well as 95-year-olds. Given that the US population is aging, this seems like a poor choice.
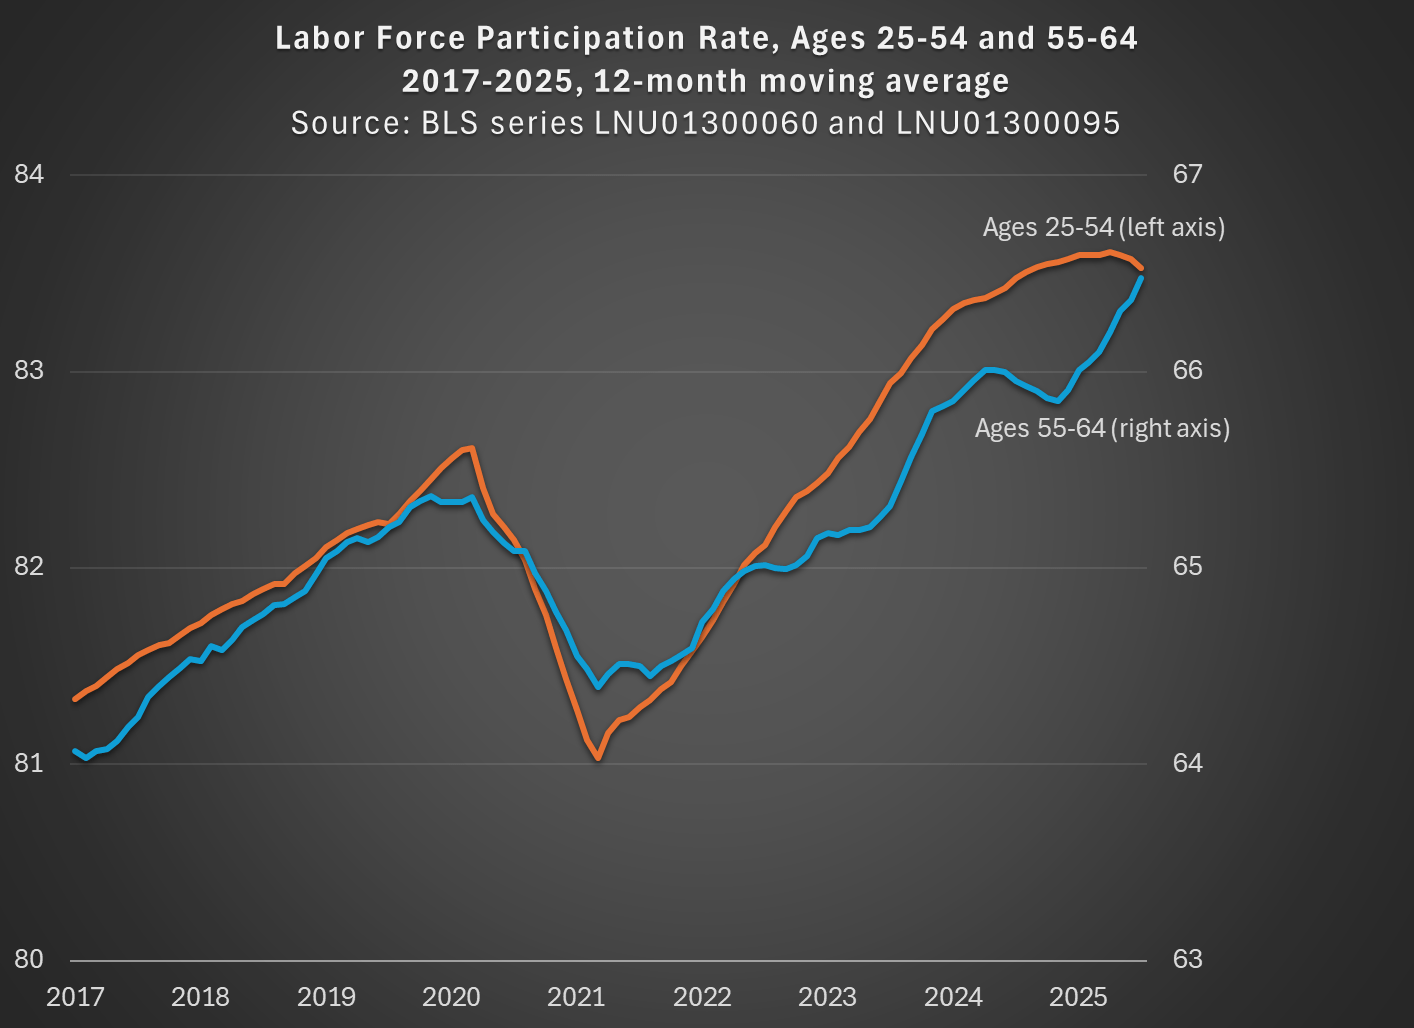
While not available currently in the FRED database, there is data from BLS available for older workers that is not open-ended. For example, we can look at workers ages 55-64, who are older but still young enough that they are mostly below traditional retirement age. I use that data and compare with the 25-54 age group (note: because the 55-64 data isn’t available seasonally adjusted, I use the non-adjusted data for both age groups, then use a 12-month average, so my chart doesn’t exactly replicate the chart above):
By using a closed-end age group for older workers, we see that labor force participation has not only recovered from the pandemic, but it exceeds the pre-pandemic peak for both prime-age and older workers, and had done so by the Spring of 2023. In fact, both are now about 1 percentage point above February 2020. If we want to go to the first decimal place, older workers have actually increased their labor force participation slightly more: 1.1 vs 0.9 percentage points. But these are close enough, given that this is survey data, to say the recovery has been roughly equal.
The St. Louis Fed blog concludes by saying that early workforce retirements “will continue to depress the labor force participation rate of workers aged 55 and older for the foreseeable future.” But it’s not true that the LFPR of older workers is depressed! Provided that we exclude those 65 and older.
Nvidia is a huge battleground stock – – some analysts predict its price will languish or crash, while others see it continuing its dramatic rise. It has become the world’s most valuable company by market capitalization. Here I will summarize the arguments of one bear and one bull from the investing site Seeking Alpha.
In this corner…semi-bear Lawrence Fuller. I respect his opinions in general. While the macro prospects have turned him more cautious in the past few months, for the past three years or so he has been relentlessly and correctly bullish (again based on macro), when many other voices were muttering doom/gloom.
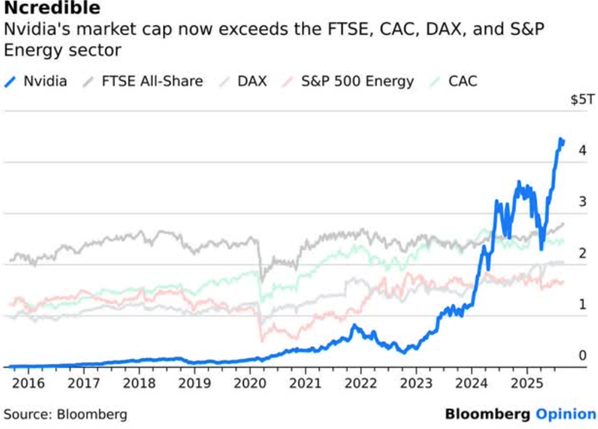
This chart shows that the stock value of Nvidia has soared past the value of the entire UK stock exchange or the entire value of US energy companies. Fuller reminds us of the parallel with Cisco in 2000. Back then, Cisco was a key supplier of gateway technology for all the companies scrambling to get into this hot new thing called the internet. Cisco valuation went to the moon, then crashed and burned when the mania around the internet subsided to a more sober set of applications. Cisco lost over 70% of its value in a year, and still has not regained the share price it had 25 years ago:
… [Nvidia] is riding a cycle in which investment becomes overinvestment, because that is what we do in every business cycle. It happened in the late 1990s and it will happen again this time.
…there are innumerable startups of all kinds, as well as existing companies, venturing into AI in a scramble to compete for any slice of market share. This is a huge source of Nvidia’s growth as the beating heart of the industry, similar to how Cisco Systems exploded during the internet infrastructure boom. Inevitably, there will be winners and losers. There will be far more losers than winners. When the losers go out of business or are acquired, Nvidia’s customer base will shrink and so will their revenue and earnings growth rates. That is what happened during the internet infrastructure booms of the late 1990s.
Fuller doesn’t quite say Nvidia is overvalued, just that it’s P/E is unlikely to expand further, hence any further stock price increases will have to be produced the old-fashioned way, by actual earnings growth. There are more bearish views than Fuller’s, I chose his because it was measured.
AI adoption isn’t happening in a single sequence; it’s actually unfolding across multiple industries and use cases simultaneously. Because of these parallel market build-outs, hyper-scalers, sovereign AI, enterprises, robotics, and physical AI are all independently contributing to the infrastructure surge.
…Overall, I believe there are clear signs that indicate current spending on AI infrastructure is similar to the early innings of prior technology buildouts like the internet or cloud computing. In both those cases, the first waves of investment were primarily about laying the foundation, while true value creation and exponential growth came years later as applications multiplied and usage scaled.
As a pure picks and shovels play, Nvidia stands to capture the lion’s share of this foundational build-out because its GPUs, networking systems, and software ecosystem have become the de facto standard for accelerated computing. Its GPUs lead in raw performance, energy efficiency, and scalability. We clearly see this with the GB300 delivering 50x per-token efficiency following its launch. Its networking stack has become indispensable, with the Spectrum-X Ethernet already hitting a $10b annualized run rate and NVLink enabling scaling beyond PCIe limits. Above all, Nvidia clearly shows a combined stack advantage, which positions it to become the dominant utility provider of AI compute.
… I believe that Nvidia at its current price of ~$182, is remarkably cheap given the value it offers. Add to this the strong secular tailwinds the company faces and its picks-and-shovels positioning, and the value proposition becomes all the more undeniable.
My view: Out of sheer FOMO, I hold a little NVDA stock directly, and much more by participating in various funds (e.g. QQQ, SPY), nearly all of which hold a bunch of NVDA. I have hedged some by selling puts and covered calls that net me about 20% in twelve months, even if stock price does not go up. Nvidia P/E (~ 40) is on the high side, but not really when considering the growth rate of the company. It seems to me that the bulk of the AI spend is by the four AI “hyperscalers” (Google, Meta, Amazon, Microsoft). They make bazillions of dollars on their regular (non-AI) businesses, and so they have plenty of money to burn in purchasing Nvidia chips. If they ever slow their spend, it’s time to reconsider Nvidia stock. But there should be plenty of warning of that, probably no near time crisis: last time I checked, Nvidia production was sold out for a full year ahead of time. I have no doubt that their sales revenue will continue to increase. But earnings will depend on how long they can continue to command their stupendous c. 50% net profit margin (if this were an oil company, imagine the howls of “price gouging”).
As usual, nothing here should be considered advice to buy or sell any security.
$50k in cash compensation is always worth more to employees than $50k in water slides and sagely advice. College football programs that don’t have as many resources tied up in highly paid assistant coaches and non-pecuniary amenities have a short term advantage in the new NIL landscape. Programs will adjust over time, but a lot of that money is locked in for the next 3-5 years.
Referee review has been a mixed bag at best, and a net negative in soccer, but baseball pitching has advanced to the point where it is no longer about beating the batter so much as fooling the umpire. It’s not the raw velocity of pitches that is overwhelming the naked eye, it’s the amount that pitches are now breaking when they cross the plate combined with catchers’ acumen at “framing” pitches with small movements of the mitt. Batters are routinely striking out without ever facing a pitch in the strikezone. #RoboUmps
The English Premiere League has long been the perfect of example of bureaucratic and “focus group” failure. I could go on at length. Watching a handful of games this weekend, it is increasingly clear that they are comfortable letting their league turn into mid 1990’s NHL hockey, with clutching and grabbing replacing skill or, counter-intuitively, even effort. There will be much hand-wringing mid season as to why so many great players are injured, why the order of the league table mostly reflects injury luck, and why teams are overly dependent scoring on boring corner kicks and randomly alotted penalties rather than teamwork and skill. Sigh.
Speaking of the Premiere League, it’s also been interesting watching a sort of resource curse play out with Manchester City two years in a row. There are certain players that are truly one of a kind that every team should want, but few can afford. There is a catch though. When you have one of a kind players there is incentive to train for strategies and tactics that only work optimally with those specific players. If those players are unavailable, a team finds itself having to choose between tactics they can no longer execute optimally or a tactics they have not trained in extensively. Last year Manchester City lost the best midfielder in the world to season long injury, a player who by himself can execute the defensive and offensive duties of what would normally be two specialist players. Playing him by himself in a “single pivot” without defensive support lets you have a numerical advantage elsewhere. Forcing a more mortal human to take on that responsibility, however, proved quite risky. This year they are trying to play without their long time goalie who was, without hyperbole, the greatest passer of the ball to ever play in goal. Watching someone else try to do a job that literally only one human being has ever been able to do has been illustrative of the perils of becoming dependent on irreplicable assets.
I suppose I’m sold on their claim that most kids can learn basic facts and some academic skills from an iPad app. Listen all the way through if you are going to listen at all, because even some cracks in the tech product are revealed after the big pitch in the beginning.
I have been using Duolingo to review my high school French and Spanish. I think the few minutes a day I spend have helped drag some vocabulary back out of long-term storage. Although, as I recently heard a comedian say, “All my friends who have Duolingo are still speaking English to me.”
Folks should consider whether AI learning apps is just MOOCs again. Essentially, they need to get kids to watch (short, this time) videos of lecture content. MOOCs were longer lecture content videos. Maybe shorter is the key, combined with personalized feedback. Maybe not, for getting cheap effective comprehensive education that scales.
About half an hour in, Liemandt asserts that anyone in America would agree that kids learn life skills through “sports” not school. That’s an oversimplification, but I agree that sports ranks higher than “math class” for developing leadership ability.
Since they at Alpha School believe that have solved quickly learning facts, it’s interesting to hear how they do the rest of “education.” The school must fill enough time that the parents don’t have to see their kids half the day and also teach leadership/ communication/character. Alpha school is expensive ($40,000 a year) and there are many paid adults involved who are called “guides and coaches.”
My students at Samford are especially good at taking on leadership roles and creating a thriving community. Residential college provides a good testing ground for leadership and there are real “market tests” of success for things like sorority events, as the Alpha school encourages for older kids.
I applaud people trying to innovate. I think we’ll see more educational apps in schools, and that will be great. I’m not trying to dump on Alpha School. I just think the underperformance arc of MOOCs should temper our enthusiasm.
That’s exactly what he tried to do this past Monday. Trump announced on social media that Lisa Cook, appointed by Biden in 2022, is now fired. Things are about to get awkward.
First, Trump can’t simply fire Fed governors willy-nilly. Remember when DOGE was involved in all of those federal workforce lay-offs earlier in the year? I know, it seems like forever ago. The US Supreme Court ruled on the legality of those firings, including some at government corporations and ‘independent agencies’. The idea behind such entities is that they are supposed to be politically insulated and less bound by the typical red tape of the government. But Trump’s administration argued that the separation from the rest of the executive branch is a fiction and that there is no one else in charge of them if not the president. The Supreme Court agreed with the administration, with one exception.
The subjects of two of our posts from 2023 are suddenly big stories.
First, here’s how I summed up New Orleans’ recovery from hurricane Katrina then:
Large institutions (university medical centers, the VA, the airport, museums, major hotels) have been driving this phase of the recovery. The neighborhoods are also recovering, but more slowly, particularly small business. Population is still well below 2005 levels. I generally think inequality has been overrated in national discussions of the last 15 years relative to concerns about poverty and overall prosperity, but even to me New Orleans is a strikingly unequal city; there’s so much wealth alongside so many people seeming to get very little benefit from it. The most persistent problems are the ones that remain from before Katrina: the roads, the schools, and the crime; taken together, the dysfunctional public sector.
Today, New Orleans is smaller, poorer and more unequal than before the storm. It hasn’t rebuilt a durable middle class, and lacks basic services and a major economic engine outside of its storied tourism industry…. New Orleans now ranks as the most income-unequal major city in America…. In areas that attracted investment — the French Quarter, the Bywater and the shiny biomedical corridor — there are few outward signs of the hurricane’s impact. But travel to places like Pontchartrain Park, Milneburg and New Orleans East that were once home to a vibrant Black middle class, and there are abandoned homes and broken streets — entire communities that never regained their pre-Katrina luster…. Meanwhile, basic city functions remain unreliable.
I wrote in 2023 about a then-new Philadelphia Fed working paper claiming that mortgage fraud is widespread:
The fraud is that investors are buying properties to flip or rent out, but claim they are buying them to live there in order to get cheaper mortgages…. One third of all investors is a lot of fraud!… such widespread fraud is concerning, and I hope lenders (especially the subsidized GSEs) find a way to crack down on it…. This mortgage fraud paper seems like a bombshell to me and I’m surprised it seems to have received no media attention; journalists take note. For everyone else, I suppose you read obscure econ blogs precisely to find out about the things that haven’t yet made the papers.
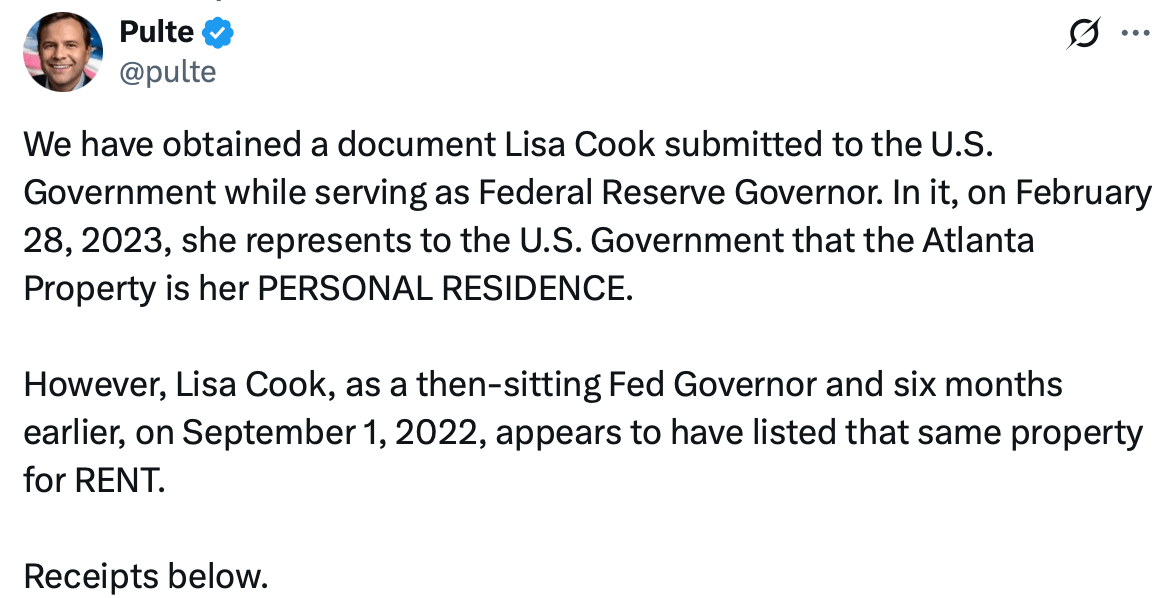
Well, that paper has now got its fair share of attention from the media and the GSEs. Bill Pulte, director of the Federal Housing Finance Agency and chairman of Fannie Mae and Freddie Mac, has been going after Biden-appointed Federal Reserve Governor Lisa Cook over allegations that she mis-stated her primary residence on a mortgage application:
Pulte has written many dozens of tweets about this, at least one of which cited the Philly Fed paper:
Now President Trump is trying to fire Cook. Federal Reserve Governors can only be fired “for cause” and none ever have been, but Trump is using this alleged mortgage fraud to try to make Cook the first.
The Trump administration seems to have made the same realization as Xi Jinping did back in 2012– that when corruption is sufficiently widespread, some of your political opponents have likely engaged in it and so can be legally targeted in an anti-corruption crackdown (while corruption by your friends is overlooked).
I’m one of a few people hoping for the Fed to be run the most competent technocrats with a minimum of political interference:
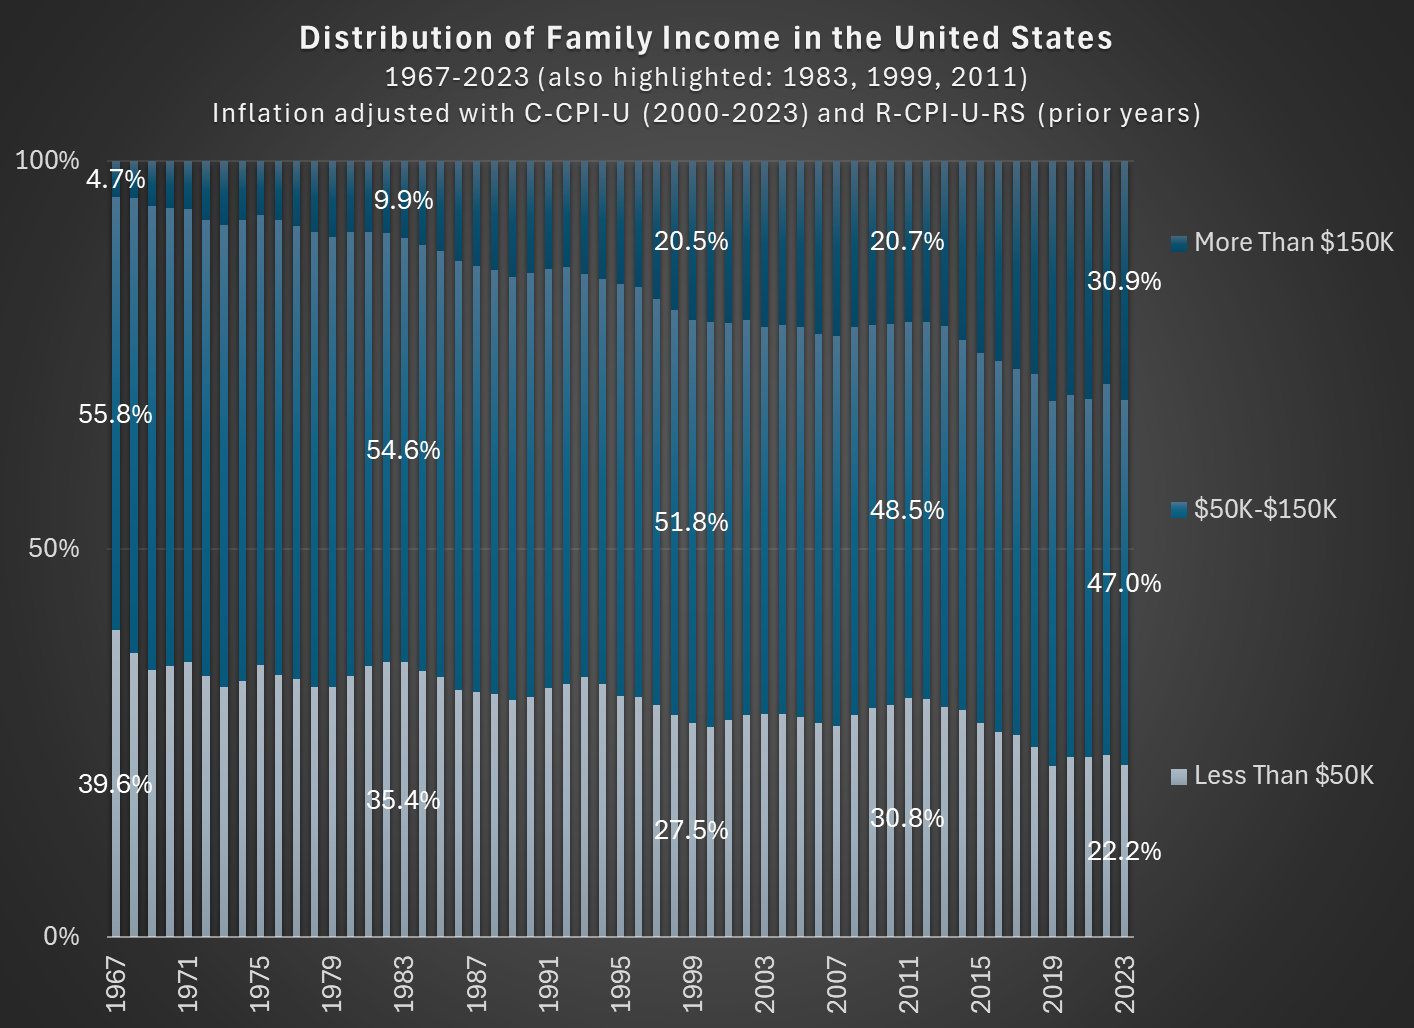
In 1967, about 56 percent of families in the US had incomes between $50,000 and $150,000, stated in 2023 inflation-adjusted dollars. In 2023, that number was down to 47 percent. So the American middle class shrunk, but why? (Note: you can do this analysis with different income thresholds for middle class, but the trends don’t change much.)
As you can see in the chart, the proportion of families that are in the high-income section, those with over $150,000 of annual income in 2023 dollars, grew from about 5 percent in 1967 to well over 30 percent in the most recent years. And the proportion that were lower income shrunk dramatically, almost being cut in half as a proportion, and perhaps surprisingly there are now more high-income families than low-income families (using these thresholds, which has been true since 2017). The number is even more striking when stated in absolute terms: in 1967 there were only about 2.4 million high-income households, while in 2023 there were 11 times as many — over 26 million.
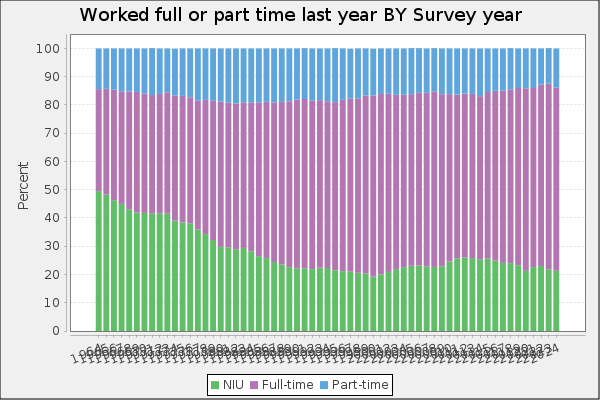
Is this increase in family income caused by the rise of two-income households? To some extent, yes. Women have been gradually shifting their working hours from home production to market work, which will increase measured family income. However, this can’t fully explain the changes. For example, the female employment-population ratio peaked around 1999, then dropped, and now is back to about 1999 levels. Similarly, the proportion of women ages 25-54 working full-time was about 64 percent in 1999, almost exactly the same as 2023 (this chart uses the CPS ASEC, and the years are 1963-2023).
But since the late 1990s, the “moving up” trend has continued, with the proportion of high-income families rising by another 10 percentage points. Both the low-income and middle-income groups fell by about 5 percentage points. Certainly some of the trend in rising family income from the 1960s to the 1990s is due to increasing family participation in the paid workforce, but it can’t explain much since then. Instead, it is rising real incomes and wages for a large part of the workforce.