I’m here to discuss women in the criminal justice system as part of the ongoing BRIDGE series organized by Arnold Ventures. DC remains one of my very favorite cities, one I lived in and around for decades. I arrived with some trepidation, of course, now that the federal government is attempting to “occupy” it while deploying National guard troops (“some armed”) while ICE agents execute their own specific combination of random assault sprinkled in with some light kidnapping. I wasn’t quite sure whether I should expect military vehicles on every other street or just the odd rented van with masked men claiming to be ICE agents pouring out.
What I’ve seen so far is mostly…nothing. I don’t me DC seems normal, not in the slightest. I mean the streets feel emptier. There’s far too few tourists for mid-August. There were families on the steps of the museums, but normally they’d be swarmed. I’m sure to some degree I’m layering my own sensitivies on the scene, but I really do think it is far quieter than it normally is. Than it should be.
Tonight I’m going to head to U street to visit an old friend, have a drink, catch up. I’ve done this a million times, in this exact neighborhood, for going on 20 years. That this time, with a cheap tinny authoritarian claiming to clean up crime while DC is experiencing the lowest rate of violent crime of my lifetime, that this is the only time I’ve really had any sense of insecurity, that something bad could happen around me, is some of a grossest irony I’ve ever experienced first hand.
Anyway, it’s always nice to come home, no matter how hard some are trying to take feeling away.
As marriage rates decline nationally, Esther Perel’s “Where Should We Begin?” offers more than dating advice. These episodes are recordings of real couples or single people today who explain why they are struggling to find relationship success. It provides an anthropological study of why coupling is challenging in the 21st century.
Each couple’s struggle with intimacy and commitment reflects broader questions about what it means to build a life together in an age of individualism. “Where Should We Begin?” doesn’t offer easy solutions to the coupling crisis, but it does helps us understand the deeper currents shaping modern love. Especially now that she has branched out to non-romantic friendship topics this year, almost anyone can find an episode here that might help them navigate one of their own personal problems as if they had the world’s leading relationship therapist on hand.
One of Perel’s points is that modern couples are drowning under expectations that previous generations never faced. Partners are expected to be best friends, passionate lovers, co-parents, financial partners, emotional support systems, and personal growth catalysts all at once. Perel points out that they’re asking their relationship to fulfill needs that used to be met by entire communities.
One episode I listened to is “I Can’t Love You the Way You Want Me To” Description: Their relationship is on the edge. They’re grappling with communication issues and the emotional scars from their past. And they’re trapped. Trapped in an endless cycle of blame, defensiveness, and attack.
As someone who grew up on the periphery of Philadelphia, I was interested in their specific fight. The man said that Philly sports fans are trash. The woman defended the honor of Philly with specific examples, and now they hate each other. Honestly sounds like my high school.
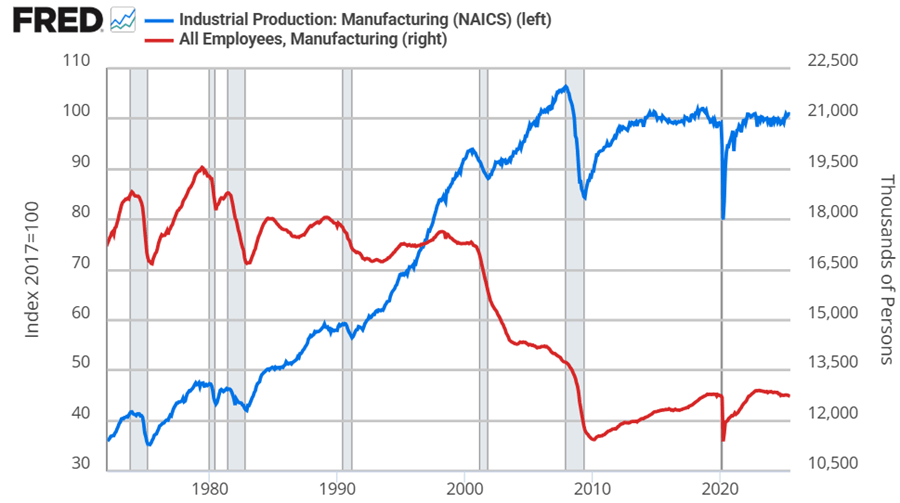
Did president Trump’s first term tariffs, enacted in 2018, increase manufacturing employment or even just manufacturing output? Let’s set the stage.
Manufacturing employment was at its peak in 1979 at 19.6 million. That number declined to 18m by the 1980s, 17.3m in the 1990s. By 2010, the statistics bottom out at 11.4m. Since then, there has been a rise and plateau to about 12.8m if we omit the pandemic.
Historically, economists weren’t too worried about the transition to services for a while. After all, despite falling employment in manufacturing, output continued to rise through 2007. But, after the financial crisis, output has been flat since 2014, again, if we omit the pandemic. Since manufacturing employment has since risen by 5% through 2025, that reflects falling productivity per worker. That’s not comforting to either economists or to people who want more things “Made in the USA”.
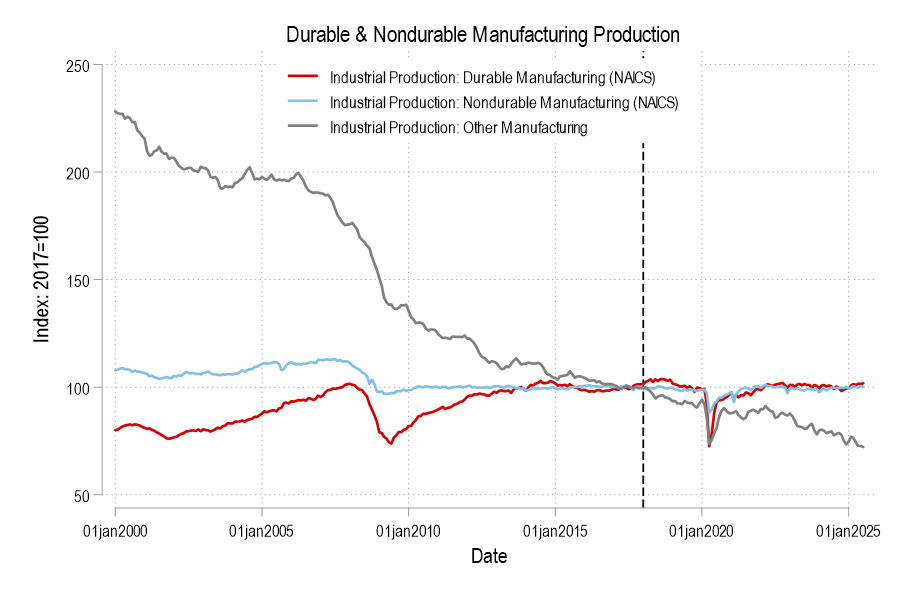
Looking at the graphs, there’s no long term bump from the 2018 tariffs in either employment or output. If you squint, then maybe you can argue that there was a year-long bump in both – but that’s really charitable. But let’s not commit the fallacy of composition. What about the categories of manufacturing? After all, the 2018 tariffs were targeted at solar panels, washing machines, and steel. Smaller or less exciting tariffs followed.
Breaking it down into the major manufacturing categories of durables, nondurables, and ‘other’ (which includes printed material and minimally processed wood products), only durable manufacturing output briefly got a bump in 2018. But we can break it down further.
I’ve taught college classes since 2010, but I never graded attendance directly until this year. I thought that students are adults who can make their own choices about where to spend their time, and if they could do well on my tests and assignments without spending much time in class, more power to them.
But I got tired of seeing students miss a lot of class, then fail by getting poor grades on the tests and assignments, or scramble for the last few weeks to avoid failing. Explaining the importance of attendance didn’t seem to help, so I finally turned to the economist’s solution- incentives. This Spring I tried grading attendance in one class, and this successful experiment plus the growth of AI mean I plan to grade attendance in all classes from now on.
The Benefits:
Get to know student’s names faster
Students feel rewarded for showing up
Students show up more, bringing more energy to the room
Students show up more, so they learn more and do better on other assignments
Physically showing up is one thing I can be sure the AI isn’t doing for them, it will be a while before humanoid robots are that good
The Costs That Turned Out Not to Be Big Deals
I thought students would dislike me policing their whereabouts and give me lower course evaluations (which is part of why I waited for tenure to try this). But my Spring evals were at least as high as usual, with none mentioning the attendance policy. When I asked students in a different class about this, most said they wished I would grade attendance if it meant less weight on exams.
I thought tracking attendance would be burdensome, but it turns out my main course software (Canvas) already has an attendance-tracking tool built in that lets you just click on names in a seating chart each day and enters grades automatically. It is certainly less burdensome than grading most assignments.
I still had some students disappear for a while due to personal issues; sometimes even the strongest grade incentives aren’t enough to get people to class. But overall I can’t believe I waited this long. I’m currently putting attendance as 10-15% of the course grade, but I dream about someday running a discussion-based class like a Liberty Fund seminar, doing a 100% attendance/participation grade, and not having to grade anything.
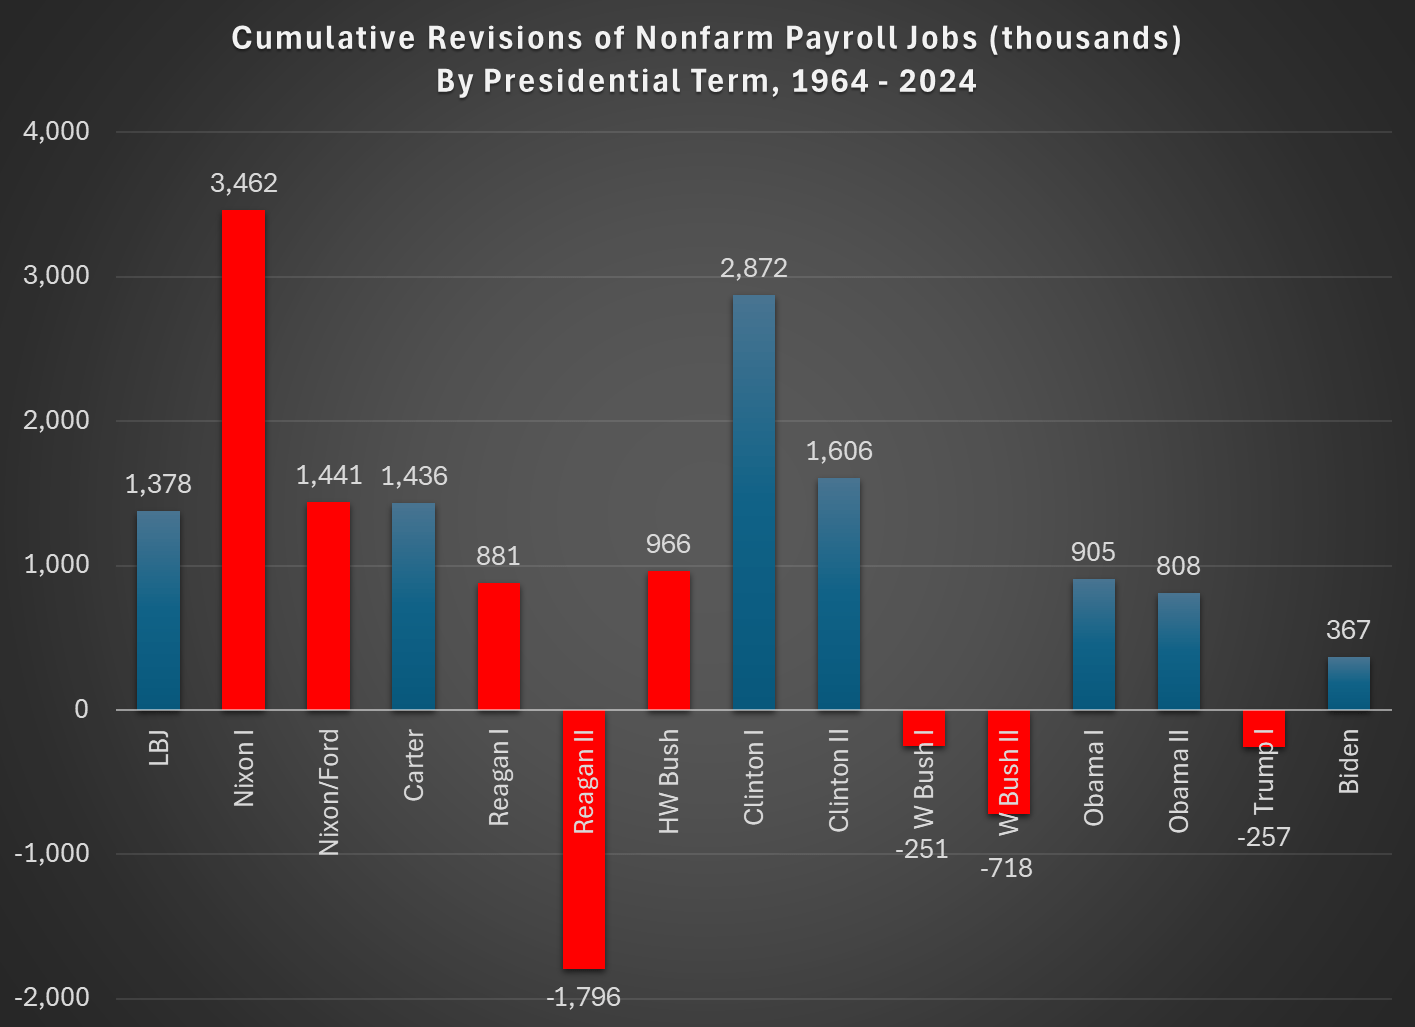
Yesterday I showed that BLS jobs reports from the CES aren’t getting worse over time, if we judge them by how much they are later revised. In fact, they are much better than decades past, with the last 20 years or so standing out as much better than the past.
Today I want to address a related but separate topic: are the initial jobs reports good at telling us when a downturn in the labor market is beginning? This is actually the strongest argument for releasing this survey data in a timely manner, even though the data often goes through significant revisions later. The report typically comes out the first Friday of a new month, so it is very current data. Given that the likely new BLS Commissioner has signaled he prefers the more accurate quarterly release, even though it is 7-9 months after the fact, it is useful to ask if these initial reports have any value in telling us when labor market declines (and recessions) are beginning.
That’s right: you are getting two posts from me this week, on essentially the same topic. Because it’s very important right now.
The short answer: the report is very good for the purpose of identifying downturns, especially the start of the downturns. Let’s walk through the past few recessions.
You’ve probably heard a lot about BLS data recently (or at least more than usual) with Trump firing the BLS Commissioner after a bad monthly revision to the nonfarm payroll jobs figures. But this didn’t come out of the blue, as there was plenty of criticism of the jobs numbers during the Biden term as well, mostly coming from the political right.
The two main criticisms leveled at the BLS, in my reading of it are:
The BLS is getting worse at estimating jobs numbers over time, leading to larger revisions
The revisions are done in a way that is favorable to Democrats
I think both of those claims can be analyzed with the following chart, which also shows those claims to be incorrect:
Back in February, 2023 I wrote an enthusiastic plug for including managed futures funds in an investment portfolio. That was based on several observations. First, bonds have become often positively correlated with stocks, so the traditional 60/40 stock/bond portfolio provides less hedging or diversification than earlier. Second, during the long grinding bear market of Jan-Oct 2022, managed futures funds shot up, nicely hedging stocks. Third, I had only recently discovered managed futures, so they were for me a shiny new toy.
Managed futures funds hold both long and short positions in futures contracts for a variety of commodities (e.g., oil, gas, metals, cattle), stocks (e.g., domestic vs. international) and other financial instruments (domestic and foreign bonds, currencies, interest rates, etc.). Fund managers usually base their positioning on momentum or trend-following. Historical data shows that if a commodity moves up steadily for, say, a month, there is greater than 50% odds that it will continue moving up for some additional time. If the fund’s positioning is correct, it makes money the next week or month. If it is incorrect, the fund loses money.
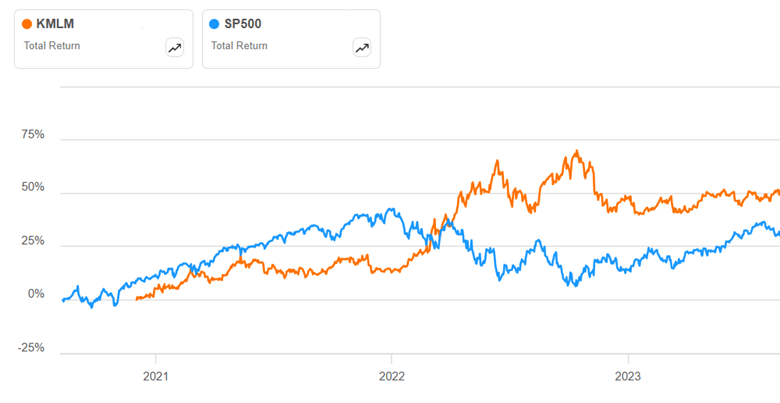
Historically, a good managed futures fund will trade fairly flat or slightly up during a stock bull phase, then step up to give positive return during a stock bear market, to counter the drop in equities prices. We can see below how that worked for managed future (MF) ETF KMLM around 2022. It rose slowly in 2021, then fell back at the end of the year. However, in Jan-Oct 2022 while stocks (and bonds) were painfully grinding down to a 22% loss, KMLM ripped higher by a huge 40%. That seems like a great hedge:
KMLM quickly gave back those gains, for reasons we will discuss. But if you had been consistently rebalancing your portfolio, you would have captured much of those gains.
This sort of performance is why some advisors recommend moving much of your non-stock holdings out of bonds and into managed futures. What’s not to like here?
It turns out that MF funds struggle if there are not fairly long, strong trends in commodity prices. If trends reverse quickly, and then reverse again, then the fund’s positions will lose money over and over. We can see this in the above plot. The story for most of 2022 was interest rates going up and up and up. MF funds were rock stars as they rode that trend for many months. But there was a surprising break in futures trends in November, 2022, as markets suddenly started pricing in an early Fed pivot towards easing in 2023, and so interest rates rose, and bonds and the U.S. dollar tumbled. All the managed futures funds took a sharp hit Nov-Dec 2022. KMLM then went roughly flat for 2023; other MF funds fared worse.
So far, so good. However, it seems like there has been a sea change in futures markets. Before around 2010 or so, there is reason to believe that much of the futures price action was driven by the underlying commodities themselves. For instance, cattle or soybean producers wanted to protect themselves against changes in cattle or soy prices, and so they would buy or sell futures to lock in prices say eight months out. In these situations, there would naturally and normally be months-long trends in futures prices. Wall Street took the other side of those trades. But now it seems to me (can’t give proof reference) that it’s speculators on both sides of the trades, leading to trade algos constantly trying to outguess each other and higher volatility.
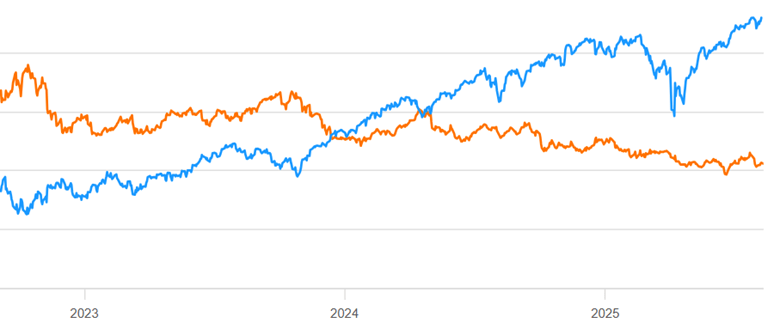
For whatever reason, normal trend-following MF has been a bad business for the past 2 years. Here is a continuation of the chart above, showing mid Aug 2023- mid Aug 2025 for KMLM (orange line) compared to S&P 500 stocks (blue line):
The scale is not shown here, but KMLM lost some 30% of its value during that time period. That is NOT the kind of hedge you want to hold.
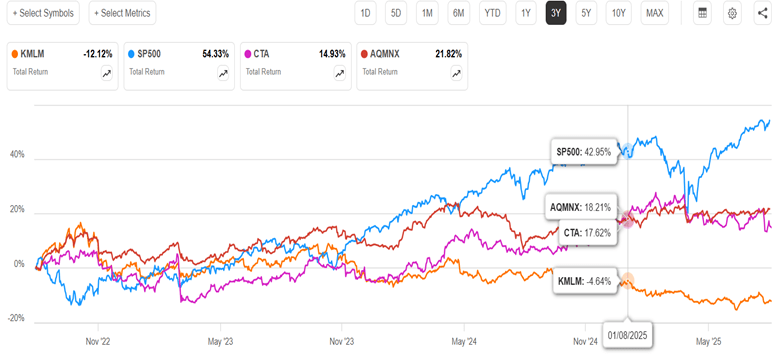
So, should we forget about MF funds? It turns out that not all MF funds perform the same. My informal research suggests that most MF funds have performed similar to KMLM in the past two years (=abysmally). Since my 2023 article, though, (a) an improved MF ETF (CTA) has appeared, and (b) I became aware of a superior MF fund (AQMNX) of the old-style (non-ETF) mutual fund format. Below is a 3-year chart of KMLM, SP500, and the ETF CTA and the mutual fund AQMNX:
We can see that both the new contenders are up instead of down in the past three years, and both were uncorrelated enough to SP500 to cushion the big Feb-April stock drawdown this year. They handily outperformed bonds (e.g. BND, not shown) during this time period.
There are fundamental reasons why those two funds would behave differently than plain vanilla trend-following KMLM. CTA adds a factor called carry (which I will not try to define) to its algo, and also takes large concentrated bets. AQMNX draws on the very sophisticated quantitative resources of the AQM fund family. It also takes long/short bets on equities (e.g. S&P 500 index), which are not in KMLM. AQMNX is not available through all brokerages (it is at Fidelity).
As the months roll by and plain stocks soar effortlessly up and up, it may seem pointless to consider any portfolio hedges. But for those who value diversification, these two funds may merit consider consideration. (As usual, nothing here should be considered advice to buy or sell any security).
Economists have become almost comically skeptical of estimated effects. A researcher estimating the effect of X on Y has always had to consider the bias and efficiency of their estimator, where bias is the result of unconsidered or unobserved forces pulling your estimated effect in one particular direction away from the truth (too positive or too negative), and efficiency is the overall noisiness of the estimate, where a less efficient estimater provides too large a range of possible effect sizes.
Under the umbrella of efficiency were concerns about random measurement error – the basic and unavoidable difficulties in accurately recording the the underlying “true” value. Filed under “everywhere and always”, measurement error is often simply the cost of doing business, while nonetheless limiting the precision which the world can be known and, in turn, the precision with which decision making or policy can be calibrated.
Coping with bias has been in many ways the story of empirical economics and the “credibiilty revolution” of the last 25 years. It’s why “identitication strategy” is the fourth slide of almost any microeconomics presentation, why the econometrics of every great applied economics working paper is seemingly obsolete before it finds itself in print, and why there is a genuine possibility I will retire with a half dozen ulcers before I finish this blog post. Economists make themselves crazy thinking, strategizing, and internalizing criticism about the potential bias in their estimates. Selection bias, omitted variable bias, reverse causality, and even observer bias lurk in the shadows of our minds. To be an expert in causal inference is to anticipate and guard against myriad sources of bias in your empirical analysis. For many living economists, however, there is a new bogeyman.
Systemic measurement error.
Sounds banal enough. And if you’re a chemist, it is. The gauge is consistently measuring every temperature too high, mass too low, electromagnetic spectra too red. Something to test for every day. Vigilence and repetition, the solution. For economists, however, the answer is less simple.
What happens when the data is rigged to make the results too good? Unemployment too low. Wages too high. Expenditures too productive. <Redacted> too <redacted>. Economists have looked for cheaters as a research subject and rooted out fraud within scientific endeavor itself. But it is precious few who have made it their job to sift through manipulated public data and carefully distill the true underlying numbers. And for good reason — as soon as you declare the data unreliable, you open the door to your own personal bias. Your politics, career ambitions, or even just your good hearted desire to observe people being more decent than our own pessimissim might otherwise allow for. To allow yourself to manipulate the potentially fraudulent data is to potentially make a bad situation worse.
Replicability and transparency of analysis was important before, but now we’re entering an even more tedious and slow landscape because critics aren’t just going to want to adjudicate your analysis, they’re going to want to adjudicate every observation in your data set. Or perhaps I am being too negative. There is a genuine upside. As people look to distill and correct for systemic measurement error, they’re going to create greater demand for 1) parallel analysis of similar questions using different techniques on the same data and 2) great forensic analysis of data and the institutions that create it. Never forget that sovietology was a genuine research career. More work to be done, but it can be done.
More work that has to be done. Sigh. My stomach hurts.
These are notable posts from 2025, roughly presented in descending order, starting with the post that got the most views.
Is there a competitive threat to the NBA? Mike Makowsky wrote, “… let’s put it this way. Why *wouldn’t* the Saudi Arabian PIF invest $5 billion in creating a rival basketball league?”
2. Perspective: This Stock Correction Fear, Too, Will Pass In March, Scott Buchanan presented “an optimistic take on the current stock market pullback.” Indeed, the market came back, despite the tariff doomerism of 2025 Spring.
7. Was the US at Our Richest in the 1890s? If you don’t believe Jeremy, consider one of the American Girl Doll historical books I was just reading to my kid. In our book, a little girl sends a letter to Samantha (the 1904 doll) reporting that bothof her parents just died from the flu.
8. The Wild Market of July 8th, 2025 James Bailey on the topic that we are all trying to keep up with this year: “Yesterday the S&P 500 shot up 9% on the news that most of Trump’s new tariffs were paused.”
9. No Tech Workers or No Tech Jobs? I (Joy) wish I had more time to write about the market for tech jobs this year. There is some indication that hiring is slowing. Some people still call it a correction from the Covid tech over-hiring spree. Other people take this as a sign that AI reduces the need for human programmers and otherwise “high-skill” humans, while some refute that claim.
10. Other “I, Pencils” It was fun for several dozen of us economists when everyone else in the world suddenly re-discovered the value of international exchange.
11. The Best Investments of the 1970s James considers “what were the best investments of the 1970’s?” Interesting to consider the performance of gold in retrospect considering stagflation.
15. Salty SALT in the OBBB Zachary explains. “Economically, the SALT makes it cheaper for individuals to live in high-tax jurisdictions. That’s distortionary.”
Reflections: We’ve been doing this for 5 years now, as of August 2025. From the analytics I can see, our posts have been the answer to a stranger’s Google query hundreds of thousands of times. Having been the beneficiary of so many other posts from strangers online, I’m happy about that.
Reminder: You can subscribe to our WordPress site to get posts sent to your email. The widget for putting your email in should be on the right side of your screen on a computer, or you can find it by scrolling to the bottom of the home page on a mobile device. WordPress will let you customize your preferences so that you get emails batched once a week if you prefer that to Every Day.
Based on my crude analytics from WordPress, “traffic” to our site from LLMs is low but increasing. It appears that readers occasionally click over from chatgpt.com or perplexity.ai What we can’t see is if and when our writing is re-molded as part of an LLM answer without attribution. In one sense, writing online is more important than ever, to feed the beast and help get good quality answers to LLM users. On the other hand, old systems in place like upvotes and view counts that used to motivate people to write for free might crumble in the new world.
From me in 2024: “AI companies have money. Could we be headed toward a world where OpenAI has some paid writers on staff? Replenishing the commons is relatively cheap if done strategically, in relation to the money being raised for AI companies.”
If anyone knows Mark Zuckerberg, please tell him that I’ll write for a fraction of what he’s paying these new engineers. What if he gave out a writing fellowship on the understanding the person never publishes (else the other bots would scrape it) and just exclusively lets Llama train off of original work?
In our case, anyway, we enjoy writing and learn from the process, so we are looking forward to being here every day.
In the Road to Serfdom, Friedrich Hayek uses some basic quantitative logic to make an important point about employment and political economy.
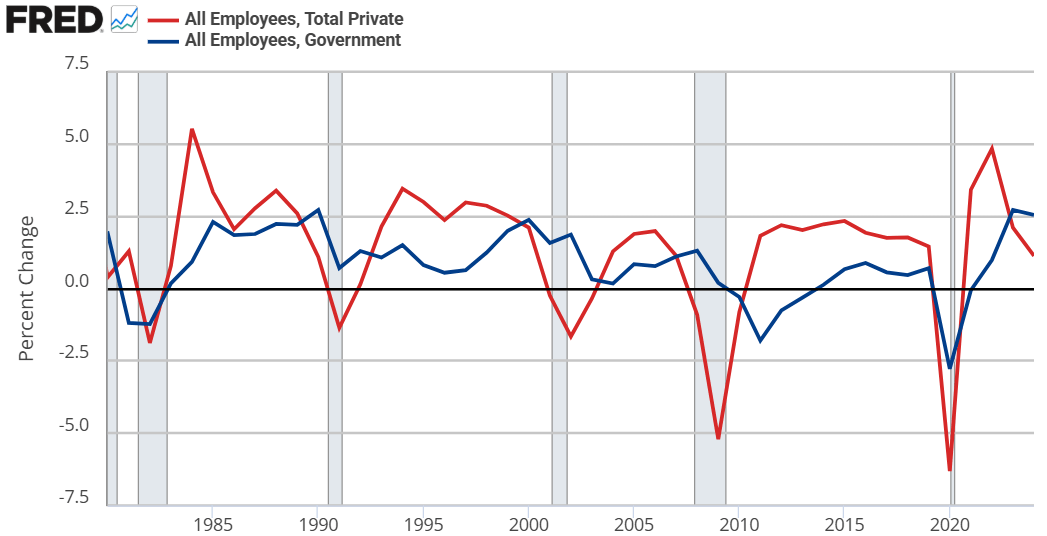
Hayek starts by assuming that government jobs are stable relative to those in the private sector. This might seem obvious, but let’s just start by checking the premises. Below are the percent change in total compensation and total employment for government employees and for the private sector. From year to year, private employment and total compensation is more volatile. So, Hayek’s initial premise is correct.
From there, he proceeds to say that if any part of income or employment is guaranteed or stabilized by the government, then the result must be that the risk and volatility is borne elsewhere in the economy. He reasons that if there is a decline in total spending, then stable government pay and employment implies that the private sector must have a deeper recession than the overall economy. Looking at the above graphs, both government employment and the total compensation are much less volatile.
But can’t governments intervene in macroeconomic stabilization policies effectively? Yes! They can and do stabilize the economy, especially with monetary policy. But Hayek is referring to individual stabilizations. For any individual to be guaranteed an income, all others must necessarily experience greater income volatility. How’s that?
Consider two individuals. Person #1 has an average income of $100. In any given year, his income might be $10 – or 10% – higher or lower than average. For the moment, person #2 is not employed and has income volatility of zero. If the government provides a job with a constant pay rate to person #2, then they still have zero income volatility. But instead of earning a consistent $0, person #2 earns a consistent $50. Nice.
Of course, person #2 gets his pay from somewhere. By one means or another, it comes from person #1. Let’s be generous and assume the tax on person #1 has no resulting behavioral effect. His new average income is $50, being $10 higher or lower in any given year. But now, that $10 deviation is over a base of $50 rather than $100. Person #1’s income varies by 20% relative to his new average!
Reasoning through this, we can consider that a person has a stable portion of their income and a volatile portion. If someone takes a part of your stable portion and leaves you with all of your volatile portion, then your remaining income is now more volatile on average. I think that this point is interesting enough all by itself.
IRL, many of our taxes are not lump sum. Rather, progressive taxation causes a negative incentive for production & earnings. The downside is that we produce less. The upside is that the government takes a higher proportion of our volatile income than of our stable income (because income changes are always on the margin and those marginal dollars are taxed at a higher rate). So, the government shares the income volatility of the private sector. By continuing to pay government employees a stable salary, the government is effectively absorbing some of that year-to-year income volatility on behalf of its employees.* The government is, in a sense, providing income insurance to a subgroup.
What does this have to do with The Road to Serfdom? Hayek argues that, as the government employs an increasing proportion of the population, the remaining private sector experiences increasing income and employment volatility. Such volatility increases private risk exposure so much that people begin to fawn over and increasingly compete for the stability found in government work. He gets anthropological and argues that the economic attraction to government jobs will introduce greater competition for those jobs and subsequently greater esteem and respect for those who are able to get them. This process makes the government jobs even more attractive.
My own two cents is that there is nothing internally unstable about this process. Total real income would fall compared to the alternative. However, such a state of affairs might be externally unstable as other governments/economies compete with the increasingly socialist one.
*An important analogue is that firms behave in a similar way. An individual may receive a relatively constant salary so long as they are employed. But the result must be that the firm bears more of the net-profit volatility. So, as more people want stable private sector jobs, the profit volatility of firms would increase and result in greater [seemingly windfall] profits and losses.